Superconducting properties of the C15-type Laves phase ZrIr2 with an Ir-based kagome lattice
2023-02-20QingSongYang杨清松BinBinRuan阮彬彬MengHuZhou周孟虎YaDongGu谷亚东MingWeiMa马明伟GenFuChen陈根富andZhiAnRen任治安
Qing-Song Yang(杨清松), Bin-Bin Ruan(阮彬彬), Meng-Hu Zhou(周孟虎), Ya-Dong Gu(谷亚东),Ming-Wei Ma(马明伟), Gen-Fu Chen(陈根富), and Zhi-An Ren(任治安),‡
1Institute of Physics and Beijing National Laboratory for Condensed Matter Physics,Chinese Academy of Sciences,Beijing 100190,China
2School of Physical Sciences,University of Chinese Academy of Sciences,Beijing 100049,China
Keywords: ZrIr2,superconductivity,Laves phase,kagome lattice,spin–orbit coupling
1. Introduction
The well-known Laves phases with general formulasAB2constitute a large family in the intermetallic compounds.[1–3]Despite the relatively simple compositions, they hold various crystal structures,intriguing physical properties and hence wide applications, such as magnetic materials,[4,5]hydrogen storage materials,[6,7]and superconducting magnets.[8–10]Thermodynamically stable Laves phases mainly crystallize in three common structures,namely,the hexagonal C14-type(or MgZn2-type), the cubic C15-type (or MgCu2-type), and the hexagonal C36-type(or MgNi2-type). Among them, the C14 and C15 Laves phases were found to be more favorable for the occurrence of superconductivity.[1,11,12]For instance, the C15-type V-based superconductors (Zr1-xHfxV2) have been intensively studied as candidates for application in high-field superconducting magnets.[13–15]In addition,several C15-type superconductors such as CeRu2[16,17]and Au2Pb[18,19]were reported to host possible unconventional superconductivity.
Recently, Ir-based C15-type Laves phasesAIr2(A=Ca,Sr, Ba, Th) have attracted much interest for the coexistence of superconductivity and strong spin–orbit coupling (SOC)effects.[20–26]Although superconductivity inAIr2(A=Ca,Sr,Th)had been discovered before the 1960s,[27]the normal-state and superconducting properties ofAIr2were not systematically studied until these recent reports. Electronic band structure calculations further revealed that the presence of SOC would strongly affect not only the topology of Fermi surfaces but also the lattice stability.[23]All these results suggest that the C15-typeAIr2are good platforms to study the interplay between SOC and superconductivity. However,studies on these compounds face challenges sinceAIr2(A=Ca,Sr,Ba,Th)are either unstable in air or contain toxic/radioactive elements.
ZrIr2is also a C15-type superconductor,whose superconductivity was discovered by Matthiaset al. in 1961.[11]Subsequent studies focused on the magnetic states of rare-earth dopants in ZrIr2,[28–30]but reports on the superconducting nature of ZrIr2were scarce. To date, evidence for bulk superconductivity in ZrIr2has not been revealed,and details of the superconducting properties are still lacking.In particular,thermodynamic measurements on ZrIr2have never been reported,neither have been the superconducting parameters except for the transition temperature(Tc).Given that ZrIr2is stable in air,and the element Zr is friendly to both health and environment,it is necessary to examine the bulk superconductivity and to study the superconducting properties in detail.
In this paper,we report the superconducting properties of ZrIr2based on the measurements of resistivity,magnetic susceptibility, and heat capacity. Bulk superconductivity is confirmed by the heat capacity measurements, and the superconducting parameters are determined for the first time. Moreover, ZrIr2is possibly an s-wave superconductor with strong electron–phonon coupling. First-principles calculations reveal the crucial role of SOC and the three-dimensional feature of Fermi surfaces in ZrIr2.
2. Methods
Polycrystalline samples of ZrIr2were prepared by an arcmelting method. The starting materials were zirconium(powder, 99.5%, may contain trace amount of Hf) and iridium(powder,99.99%). Zr and Ir were thoroughly mixed in a molar ratio of 1.08:2 before pressed into pellets. A slightly excess amount of Zr was used in order to prevent the formation of ZrIr3. The pellets were then arc-melted in high purity argon atmosphere for at least 8 times with intermediate turnovers.The weight losses after arc-melting were always less than 1%.The ingots obtained were subsequently wrapped with tantalum sheets, sealed into quartz tubes, and annealed at 1430 K for three weeks. The final products showed metallic lusters and were stable in air.
X-ray diffraction (XRD) data were collected on a powdered sample using a PAN-analytical x-ray diffractometer(Cu-Kαradiation) at room temperature. Rietveld refinements of the XRD results were carried out using the GSAS package.[31]Measurements of electrical resistivity, as well as heat capacity of the sample were performed on a Quantum Design physical property measurement system (PPMS). While magnetization data were collected on a Quantum Design magnetic property measurement system (MPMS). More details about the measurements can be found elsewhere.[32]Note that all the data in this paper were collected on a sample from the same batch. The magnetization data were corrected by taking the demagnetization factors into account.[33]
First-principles calculations were performed by using the density functional theory(DFT),as implemented in the Quantum ESPRESSO(QE)package.[34]Projector augmented wave pseudopotentials from the PSlibrary were chosen,[35]with exchange–correlation functionals of PBEsol based on the generalized gradient approximation (GGA).[36]The energy cutoffs for the wavefunctions were 70 Ry. A Monkhorst–Pack grid of 163k-points was used in the self-consistent calculation,while a grid of 493k-points was used to calculate the density of states(DOS)and the Fermi surfaces. Before the calculation of charge densities, the cells were fully relaxed till the force on each atom was less than 10-4Ry·Bohr-1. Both the scalar relativistic and the fully relativistic cases were considered in the calculation.
3. Results
3.1. Structural characterization
Figure 1(a) demonstrates the powder XRD pattern of ZrIr2. The pattern can be well refined with a C15-type Laves phase structure (MgCu2-type, space group), indicating the formation of the target phase. The unindexed weak peaks in Fig. 1(a) arise from a small amount (9.8 wt.%) ofα-ZrIr impurity. The Rietveld refinement yields cell parametersa=b=c=7.3596(1) ˚A, in good agreement with previous reports.[11]Details of the refinement results are summarized in Table 1. The cell parameters from DFT relaxations are also listed. The experimental value ofaagrees very well with the theoretical ones. When the SOC effects are taken into account,the discrepancy between experiment(7.3596 ˚A)and theory(7.3614 ˚A)is less than 0.03%.

Table 1. Crystallographic parameters of ZrIr2 from Rietveld refinement of XRD.
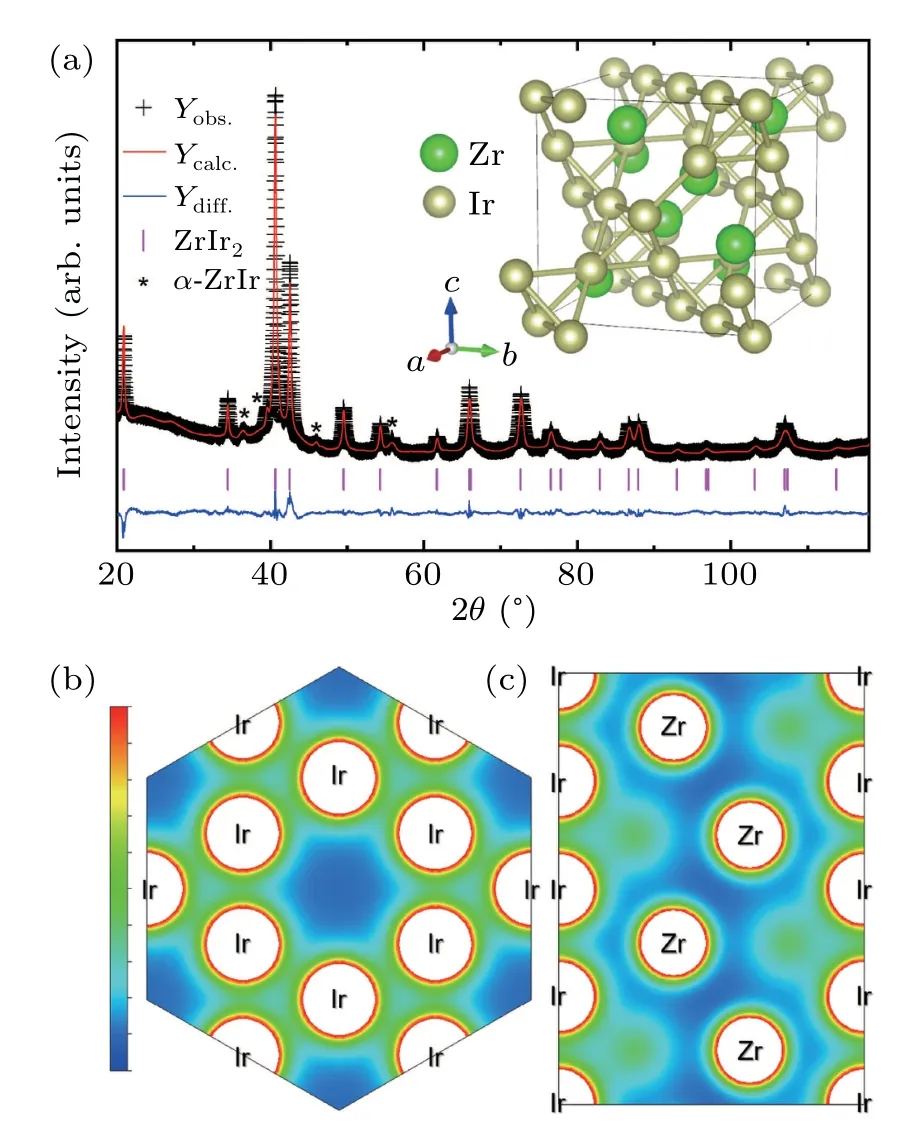
Fig.1. (a)Room-temperature powder XRD pattern of ZrIr2 and its Rietveld refinements. The conventional unit cell is shown as the inset. (b)Calculated valence charge density (bound between 0 and 0.2e/, where e is the electronic charge and a0 is the Bohr radius) on the (111) plane. The kagome lattice of Ir atoms is emphasized. (c) Calculated valence charge density on the(110)plane,in which the low-density region around Zr atoms is visible.
The conventional unit cell of ZrIr2is shown as the inset of Fig. 1(a). The cell is constructed with Zr atoms filling the cavities of the Ir network. Notice the Ir atoms form a kagome lattice, which is clearly shown in the charge density map in Fig.1(b). We also note that the Zr–Ir bonds are partially ionic,as the calculated charge density shows “empty” regions surrounding the Zr atoms, as shown in Fig.1(c). These findings are similar with the cases in isostructural compounds such as SrIr2or SrRh2.[23]
3.2. Superconducting properties
Figure 2(a) shows the temperature dependence of resistivity (ρ) of ZrIr2from 1.8 K to 300 K. Metallic behavior can be inferred from the monotonous decrease ofρto lower temperature, yet the residual resistivity ratio (RRR) is relatively low compared with SrIr2[22,23]or ThIr2.[24]Under zero magnetic field,a sharp superconducting transition is observed below 4.0 K () andρbecomes zero at 3.8 K ().These values are consistent with previous reportedTc(4.1 K)of ZrIr2.[11,27]The transition width is about 0.2 K.In order to estimate the upper critical field (μ0Hc2(T)),ρ(T) was measured under various magnetic fields,as seen in Fig.2(b). The superconducting transition is gradually suppressed with the increase of magnetic field. We thus obtain theμ0Hc2(T) plot,which is shown in the inset of Fig.2(a). In the inset,Tcis defined as the midpoint of superconducting transition.μ0Hc2(0)is determined to be 4.78 T by a Ginzburg–Landau (G–L) fit:μ0Hc2(T)=μ0Hc2(0)[1-(T/Tc)2]/[1+(T/Tc)2].
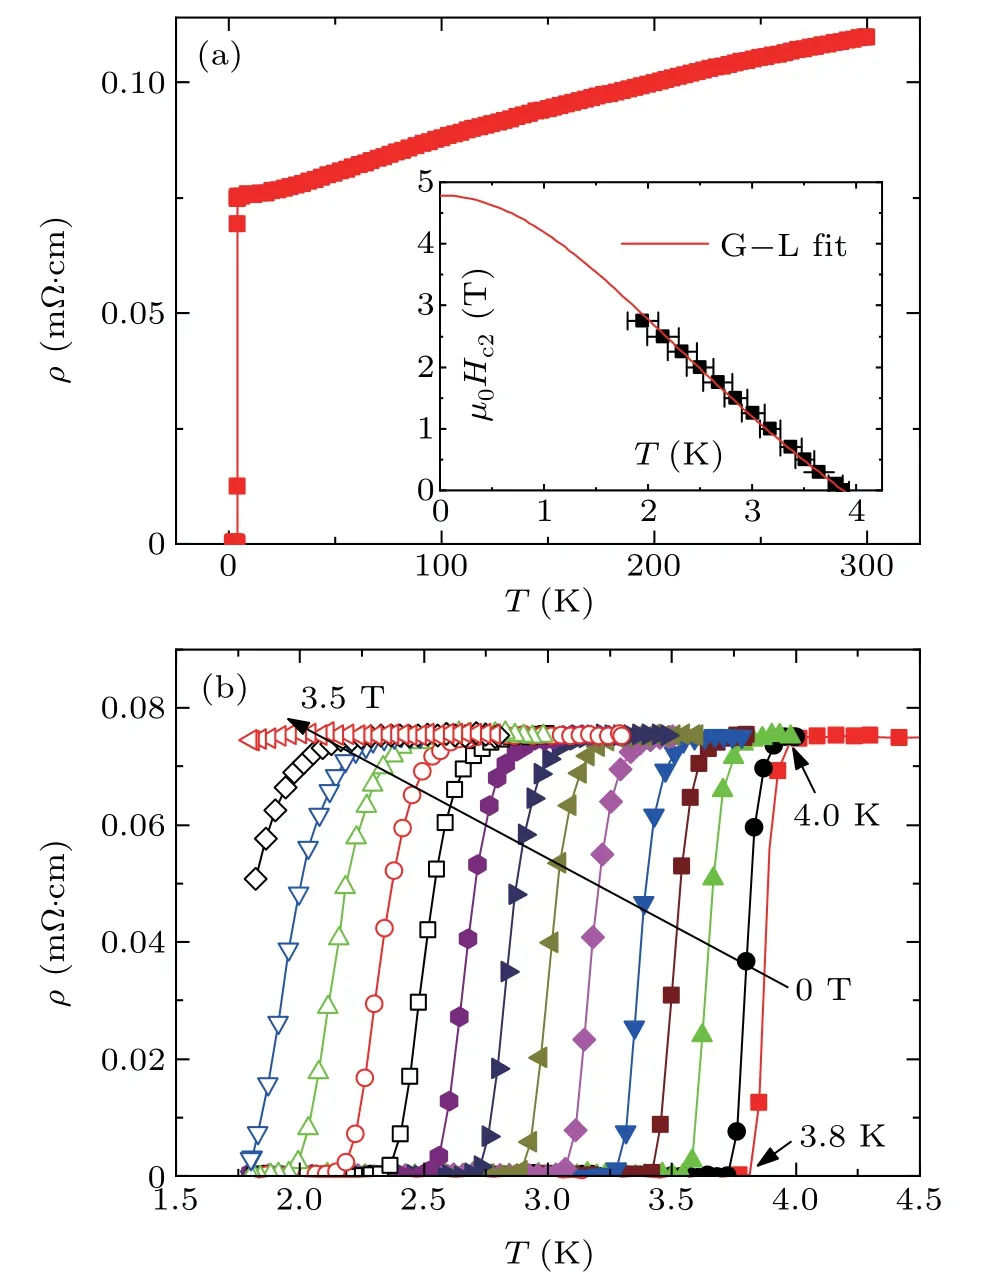
Fig.2. (a) Temperature dependence of resistivity (ρ) of ZrIr2 in zero magnetic field. Inset shows the temperature dependence of upper critical field(μ0Hc2(T)). (b)The superconducting transition region on ρ(T)under various magnetic fields up to 3.5 T.
Zero-field-cooled(ZFC) and field-cooled(FC) DC magnetic susceptibility(4πχ)of ZrIr2from 7.0 K to 1.8 K,measured under 10 Oe magnetic field,is demonstrated in Fig.3(a).The strong diamagnetic signal below 3.8 K indicates the occurrence of superconductivity. The transition temperature is consistent with the one from theρ(T) measurement. The superconducting shielding fraction from the ZFC curves is~103%,confirming the bulk nature of superconductivity. The shielding fraction is larger than 100% because of the experimental errors of the sample dimensions. In addition, the existence of strong magnetic flux pinning effects is revealed by the much lower FC signals. The isothermal magnetization curves (M(H)) at various temperatures from 1.8 K to 3.6 K are shown in Fig.3(b). The fields at which the curves deviate 2.5%from the initial Meissner states are defined as the lower critical fields(μ0Hc1). As a result,the inset of Fig.3(a)shows the temperature dependence ofμ0Hc1,which can be well fitted with the G–L formula:μ0Hc1(T)=μ0Hc1(0)[1-(T/Tc)2],yieldingμ0Hc1(0)=12.8 mT.
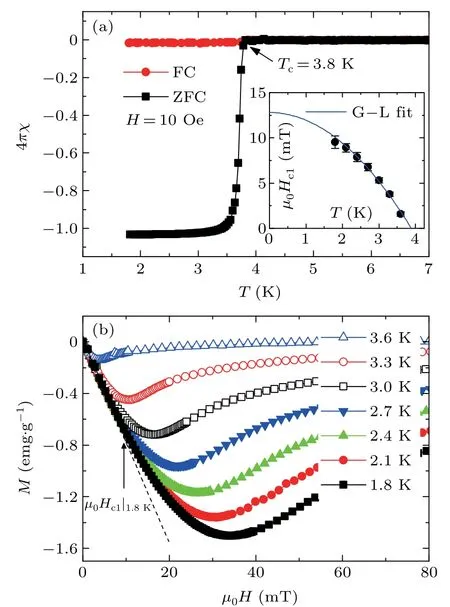
Fig.3. (a) Temperature-dependent DC magnetic susceptibility of ZrIr2 under 10 Oe. Inset shows the evolution of lower critical field μ0Hc1(T).(b)Isothermal magnetization at various temperatures below Tc.
We are able to determine a series of superconducting parameters starting from the values ofHc1(0) andHc2(0). The G–L coherence length (ξGL) is determined to be 8.30 nm byμ0Hc2(0)=Φ0/(),whereΦ0is the magnetic flux quantum. From the relation[37]

the penetration depth (λGL) and the G–L parameter (κGL=λGL/ξGL)are estimated to be 220.4 nm and 26.6,respectively.κGLis much larger than 1/, suggesting type-II superconductivity. The thermodynamic field (μ0Hc(0)) is thus estimated to be 0.14 T by(0)lnκGL=Hc1(0)Hc2(0). These superconducting parameters are summarized in Table 2.
We also measured the specific heat of ZrIr2to examine the superconducting nature. Figure 4(a) shows the temperature dependence of specific heat(Cp)for ZrIr2within the temperature range of 1.8 K–7.0 K at magnetic fields of zero and 5 T.Notice theCpdata have been corrected by subtracting the contribution ofα-ZrIr impurity. The subtraction procedure is similar with that in our previous study.[32]Under zero magnetic field, there was an obvious anomaly onCp(T)at 3.8 K,validating the bulk nature of superconductivity. The anomaly could be completely suppressed when a field of 5 T was applied. The normal-stateCp(T) measured under 5 T can be well fitted with a Debye modelCp(T)/T=γ+βT2+δT4,in whichγis the Sommerfeld coefficient,while the other two terms stand for the phononic contributions. The fittedγandβvalues are 8.68 mJ·mol-1·K-2and 0.909 mJ·mol-1·K-4, respectively. And the fitting curve is shown in Fig. 4(a) as the black dash line. Debye temperature(ΘD)is thus calculated to be 186 K by

in whichNis the number of atoms per formula unit(f.u.),andRis the ideal gas constant. The value ofΘDis comparable with that of SrIr2(180 K).[22]
We can further estimate the electron–phonon coupling constantλepusing the McMillan relation[38]

whereμ*is the Coulomb screening parameter (set to 0.13 in our case).λep= 0.68 is thus obtained, indicating that ZrIr2hosts a weak to moderate coupling strength. Moreover,the DOS at Fermi level(EF)is estimated usingN(EF)=3γ/[(1+λep)] based onγandλep, yieldingN(EF) =2.20 eV-1·f.u.-1.
By subtracting the phononic contributions fromCp, the electronic contributionCeis obtained and shown in Fig.4(b).The normalizedCejump(ΔCe/γTc)is determined to be 1.86.This value is larger than the BCS weak-coupling ratio(1.43),suggesting enhanced electron–phonon coupling in ZrIr2.Ceat the superconducting state can be well fitted with the so-calledα-model,[39]whereCe=T∂S/∂T, and the entropySis expressed as

f= 1/[1 +exp(], in whichΔ(T) =Δ0tanh(1.82[1.018(Tc/T-1)]0.51). These results mean that ZrIr2is possibly an s-wave superconductor with an isotropic gap,and the gap value at zero temperature(Δ0)is fitted to be 0.62 meV.Δ0/kBTcis thus estimated to be 1.92,again validating strong-coupling superconductivity.
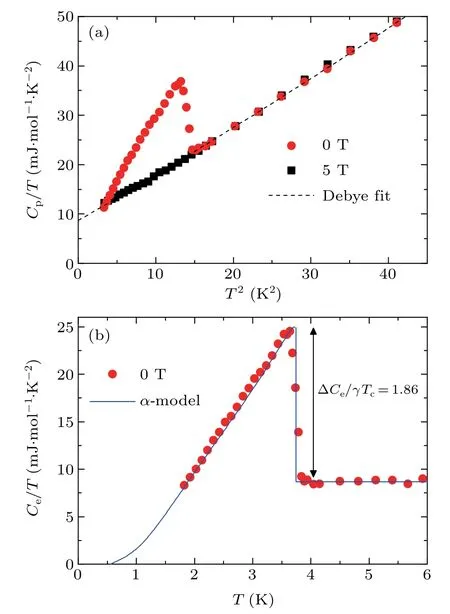
Fig.4. (a)Specific heat(Cp)for ZrIr2 within the temperature range of 1.8 K–7.0 K under zero and 5 T magnetic field. The black dash line is the fit with Debye model.(b)The electronic contribution of Cp below 6 K.The solid line shows the fit with α-model.
3.3. First-principles calculations
Figure 5(a)shows the electronic band structures of ZrIr2nearEFfrom first-principles calculations,in which the results without SOC are plotted as the dash lines, and the SOC results in solid lines. There are three bands crossingEFboth in the absence and presence of SOC,which is consistent with the metallic nature of ZrIr2from resistivity measurement. Notice the inclusion of SOC dramatically changes the band dispersion nearEF. In particular,band splits are obvious(~0.2 eV)at certaink-points, as emphasized by the green circles in Fig.5(a).
The influences of SOC are also reflected in the DOS plots,as shown in Figs.5(b)and 5(c). In both cases(with and without SOC),the DOS nearEFare dominated by Ir-5d and Zr-4d orbitals. The strong hybridization between the two orbitals is indicated by the similar shapes of their corresponding contributions. The theoretical value ofN(EF) is 2.94 eV-1·f.u.-1with SOC. This value is slightly larger than the experimental one, which means that the actualEFis probably lower than calculated. This can be caused by a possible existence of Hf atoms and/or Zr vacancies on the Zr sites.
The three sheets of calculated Fermi surfaces(with SOC)are illustrated in Fig. 5(d). Notice each sheet hosts a Krammers degeneracy. Compared to the isostructural superconductors SrIr2[23]or ThIr2,[24]the Fermi surface topology in ZrIr2is unexpectedly simple, although they all share threedimensional features. To be specific, ZrIr2hosts only one polyhedron-shaped hole-like pocket surrounding theΓpoint,plus one capsule-shaped electron-like pocket surrounding theXpoint.
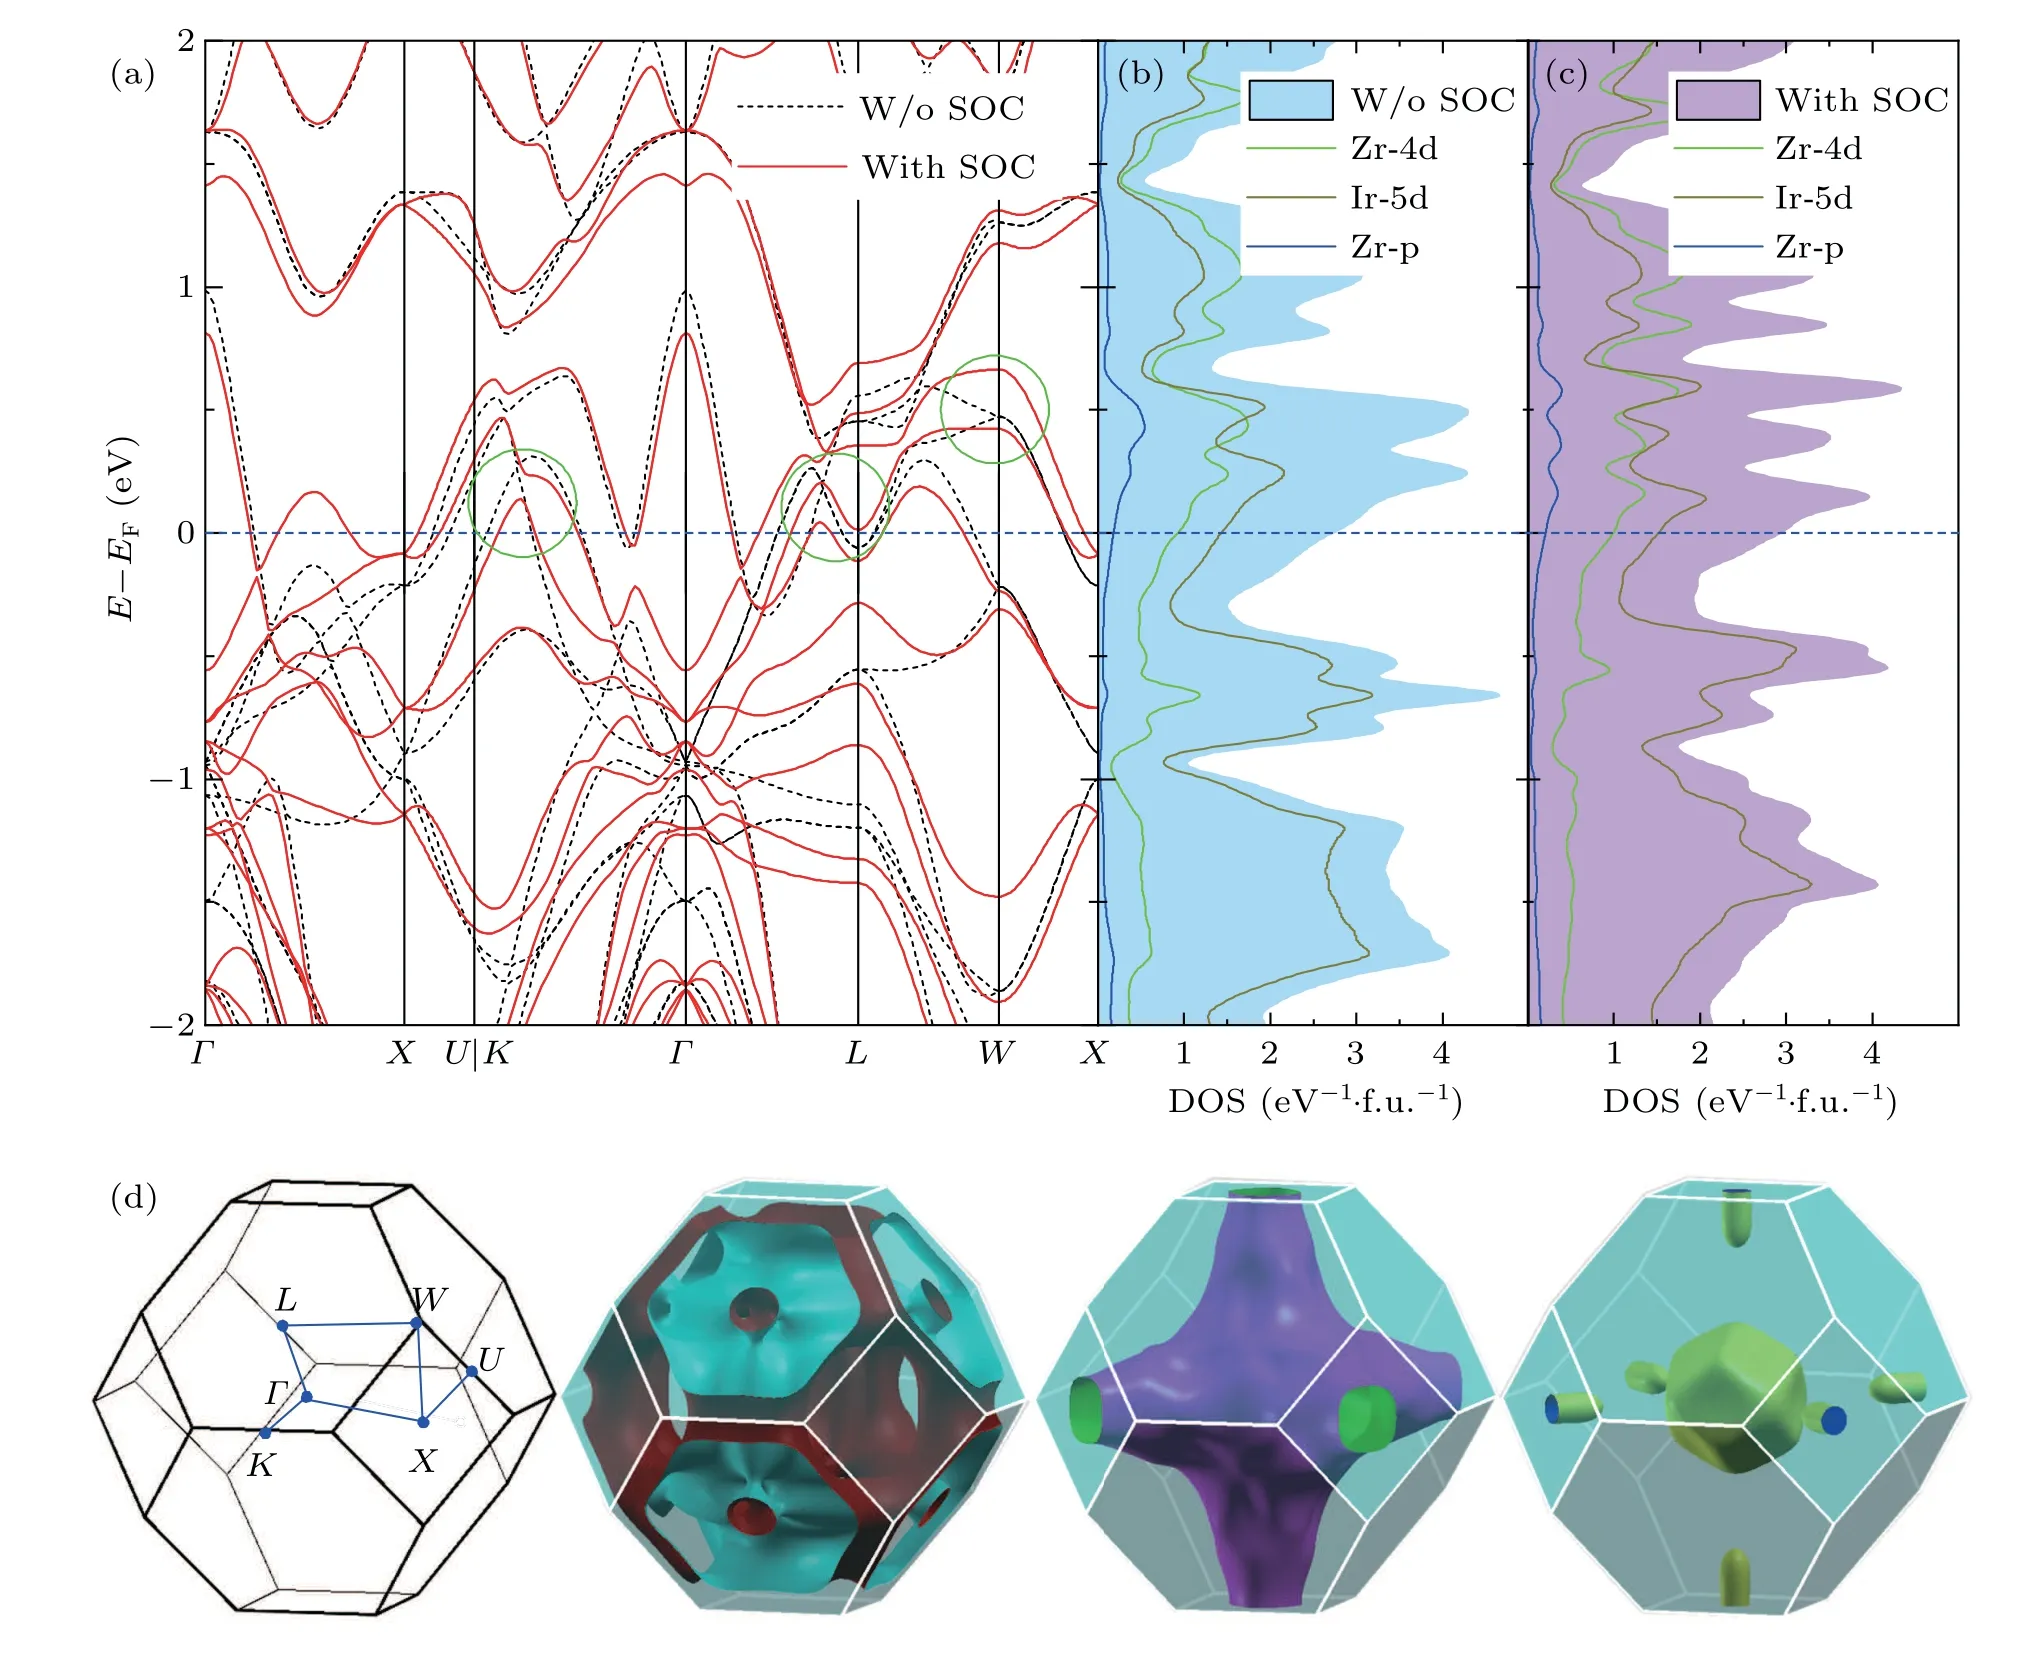
Fig.5. (a)Calculated electronic band structure of ZrIr2 without and with SOC near the Fermi level. The corresponding DOS plots are shown in(b)and(c),respectively. (d)The high symmetry points in Brillouin zone,and the calculated sheets of Fermi surfaces(with SOC).
4. Discussion
Now we move on to make a comparison between ZrIr2and C15-type superconductorsAIr2(A=Ca, Sr, Ba, Th). As shown in Table 2,N(EF)for ZrIr2is much lower than the other four members(except for CaIr2). However,Tcof ZrIr2is comparable with the others’. It is even higher than that of BaIr2despite the much lowerN(EF) (orγ). Interestingly, we notice thatΘDis positively correlated withTc. AsΘDreflects the phonon dispersion,these results suggest that phonon spectrum, rather thanN(EF), plays an important role in determination of the electron–phonon coupling strength. The modification of phonon spectrum(henceTc)is realized by changing the guest atomAin the kagome lattice ofAIr2. Indeed, the low-frequency vibrations of the Ir network (kagome lattice),modified by the insertion of Sr,have also been suggested to be the reason for strong electron–phonon coupling in SrIr2.[23]In this respect,future studies on phonon dispersion and electron–phonon interactions in ZrIr2are needed. Given that the Fermi surfaces of ZrIr2are quite different(and much simpler)compared withAIr2(A=Sr or Th),[23,24]it will possibly provide new thoughts for understanding the superconductivity in Irbased C15-type superconductors.
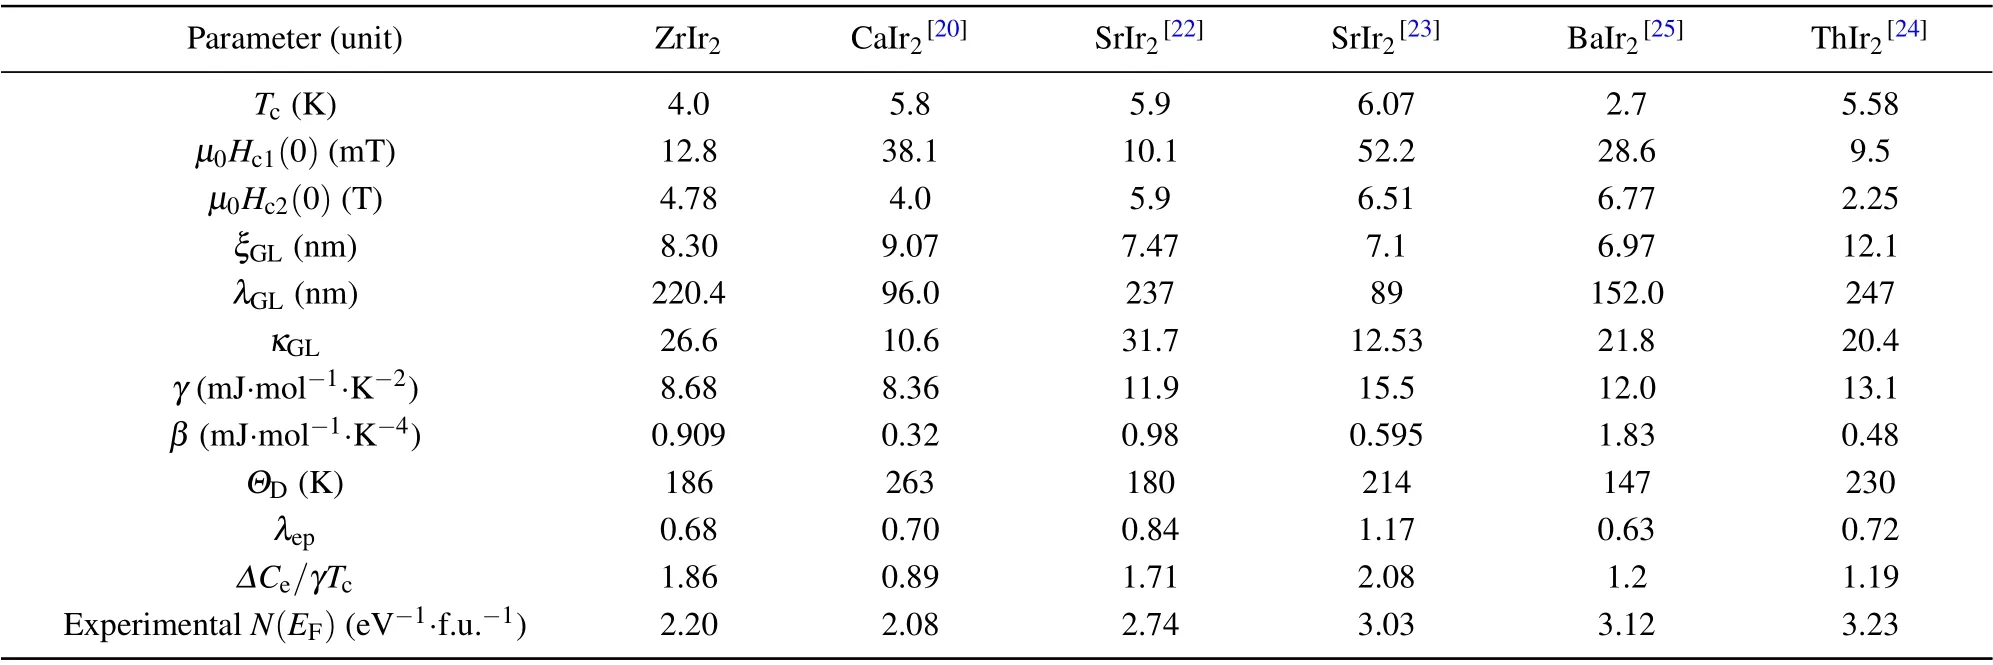
Table 2. Superconducting and thermodynamic parameters of ZrIr2. Reference values for AIr2 (A=Ca,Sr,Ba,Th)are also listed for comparison.
5. Conclusion
In summary, we have systematically investigated superconductivity in the C15-type Laves phase superconductor ZrIr2. Bulk superconductivity withTcof 4.0 K is confirmed.Our measurements indicate that ZrIr2is a type-II s-wave superconductor with upper and lower critical fields of 4.78 T and 12.8 mT, respectively. In addition, strong electron–phonon coupling is revealed by the large values ofΔCe/γTc(1.86)andΔ0/kBTc(1.92). First-principles calculations indicate that the SOC effects are prominent,while the Fermi surface topologies are simple. ZrIr2is a stable compound under ambient conditions, with health and environmental friendly Zr. Therefore,it serves as a suitable platform,both experimentally and theoretically,to study the interplay between superconductivity and strong SOC in Ir-based C15-type superconductors.
Acknowledgments
Project supported by the National Key Research and Development of China (Grant Nos. 2018YFA0704200 and 2021YFA1401800), the National Natural Science Foundation of China (Grant Nos. 12074414 and 11774402), and the Strategic Priority Research Program of Chinese Academy of Sciences(Grant No.XDB25000000).
猜你喜欢
杂志排行
Chinese Physics B的其它文章
- The coupled deep neural networks for coupling of the Stokes and Darcy–Forchheimer problems
- Anomalous diffusion in branched elliptical structure
- Inhibitory effect induced by fractional Gaussian noise in neuronal system
- Enhancement of electron–positron pairs in combined potential wells with linear chirp frequency
- Enhancement of charging performance of quantum battery via quantum coherence of bath
- Improving the teleportation of quantum Fisher information under non-Markovian environment
