Will the Historic Southeasterly Wind over the Equatorial Pacific in March 2022 Trigger a Third-year La Niña Event?
2023-02-08XianghuiFANGFeiZHENGKexinLIZengZhenHUHongliRENJieWUXingrongCHENWeirenLANYuanYUANLichengFENGQifaCAIandJiangZHU
Xianghui FANG, Fei ZHENG, Kexin LI, Zeng-Zhen HU, Hongli REN, Jie WU, Xingrong CHEN,Weiren LAN, Yuan YUAN, Licheng FENG, Qifa CAI, and Jiang ZHU
1Department of Atmospheric and Oceanic Sciences & Institute of Atmospheric Sciences,Fudan University, Shanghai 200438, China
2International Center for Climate and Environment Science (ICCES), Institute of Atmospheric Physics,Chinese Academy of Sciences, Beijing 100029, China
3Collaborative Innovation Center on Forecast and Evaluation of Meteorological Disasters,Nanjing University of Information Science & Technology, Nanjing 210044, China
4Climate Prediction Center, NCEP/NWS/NOAA, College Park, MD 20740, USA
5State Key Laboratory of Severe Weather, Chinese Academy of Meteorological Sciences, Beijing 100081, China
6National Climate Center, Beijing 100081, China
7National Marine Environmental Forecasting Center, Beijing 100081, China
8Mailbox 5111, Beijing 100094, China
ABSTRACT Based on the updates of the Climate Prediction Center and International Research Institute for Climate and Society(CPC/IRI) and the China Multi-Model Ensemble (CMME) El Niño-Southern Oscillation (ENSO) Outlook issued in April 2022, La Niña is favored to continue through the boreal summer and fall, indicating a high possibility of a three-year La Niña (2020-23).It would be the first three-year La Niña since the 1998-2001 event, which is the only observed three-year La Niña event since 1980.By examining the status of air-sea fields over the tropical Pacific in March 2022, it can be seen that while the thermocline depths were near average, the southeasterly wind stress was at its strongest since 1980.Here,based on a quaternary linear regression model that includes various relevant air-sea variables over the equatorial Pacific in March, we argue that the historic southeasterly winds over the equatorial Pacific are favorable for the emergence of the third-year La Niña, and both the anomalous easterly and southerly wind stress components are important and contribute~50% of the third-year La Niña growth, respectively.Additionally, the possible global climate impacts of this event are discussed.
Key words: El Niño-Southern Oscillation, three-year La Niña, strongest southeasterly wind, air-sea interaction
El Niño-Southern Oscillation (ENSO) is the largest interannual climate variability in the tropics.Although its evolution takes place in the tropical Pacific region, it has far-reaching impacts on climate and society around the world (McPhaden et al., 2006).Meanwhile, ENSO signals also provide very important information for other short-term climate predictions.Therefore, a successful ENSO forecast is of great importance.In fact, both statistical and physical forecast models could successfully predict ENSO evolution with lead times of 6 to 12 months by the late 20th century (Latif et al., 1994).Despite this progress,the complexity of ENSO has always been an important obstacle restricting ENSO forecasting (Zheng et al., 2016; Timmermann et al., 2018; Fang and Xie, 2020; Chen et al., 2022).ENSO exhibits a high degree of complexity both spatially and temporally.For example, there are central Pacific (CP) and eastern Pacific (EP) types of El Niño (Ashok et al., 2007; Kao and Yu,2009), there are differences in amplitude and spatial asymmetry between El Niño and La Niña (An and Jin, 2004), and La Niña events can span two or three consecutive years (Hu et al., 2014; Zheng et al., 2015; DiNezio et al., 2017; Wu et al.,2021).These complexities undoubtedly bring significant challenges to simulating and predicting ENSO (DiNezio et al.,2017; Wu et al., 2021).
By analyzing historical data, it has been noted that, compared with El Niño, the complexity of La Niña is more reflected in time than space.For example, of the 16 La Niñas that have occurred from 1980 to the present, 13 have lasted for at least two years, and 1998-2001 was a three-year La Niña event.Recently, 2021-22 has been officially identified as a La Niña year, which makes 2020-22 a two-year La Niña event (Li et al., 2022).Furthermore, this La Niña did not quickly decay after its peak.Instead, it persisted as a moderate La Niña and even recently rebounded.According to the latest Climate Prediction Center and International Research Institute for Climate and Society (CPC/IRI) ENSO Outlook issued in April 2022 (Fig.1a; http://iri.columbia.edu/climate/ENSO/currentinfo/update.html), La Niña is favored to continue through boreal summer (59% chance during June-August 2022), with a 50%-55% chance of continuing through fall.
A similar advisory can also be found in the China Multi-Model Ensemble (CMME; https://cmdp.ncc-cma.net/pred/cn_cmme.php?FromYear=2022&FromMonth=4&Search=%BF%AA%CA%BC%BC%EC%CB%F7&Elem=CMMEENSO&source_from=), i.e., a platform organized by the National Climate Center of China Meteorological Administration to release monthly forecasts from various ENSO forecast models in China since March 2020.The corresponding predictions for the same period are also shown in Fig.1b.It can be seen that there are large differences among the models in CMME, in which both the intermediate coupled models (ICMs) and statistical models (SAMs) call for a La Niña advisory, the coupled general circulation models (CGCMs) indicate a neutral state, and the hybrid dynamic and statistical models (HDSMs) predict an El Niño state.To sum up the predictions of the two platforms, it seems another three-year La Niña (2020-23) will emerge, being the first since 1998-2001.Based on an ENSO statistical forecast model, the possible reasons for this potential La Niña occurrence will be investigated.
Another obstacle of ENSO prediction is the so-called spring predictability barrier (SPB), i.e., the prediction skill will drop significantly when it strides over the spring regardless of when a prediction is made (Webster and Yang, 1992; Mu et al., 2007; Zheng and Zhu, 2010; Fang et al., 2019; Hu et al., 2019).In addition, another important feature associated with ENSO seasonal variation is seasonal phase locking, i.e., ENSO events normally mature in winter and decay quickly in the following spring.Using the empirical orthogonal function analysis method to quantitatively analyze this characteristic from 1980 to 2018, Fang and Zheng (2021) pointed out that a typical ENSO evolution can explain 90% of the total variance.The corresponding principal component is nearly identical to the October-December (OND) mean Niño-3.4 (5°S-5°N, 170°-120°W) sea surface temperature (SST) index.Thus, an accurate prediction of ENSO evolution can potentially be provided if the OND mean Niño-3.4 index is well predicted (Fang and Mu, 2018; Fang and Zheng, 2021).Based on this hypothesis,Fang and Zheng (2021) explored the possibility of using March data to predict the subsequent ENSO evolution using a statistical model, which can also quantitatively reflect the relative contributions of the predictors.In the present study, their model will be utilized to explore the important contribution of the historic southeasterly winds over the equatorial Pacific in March 2022 to the possible third-year La Niña event.
For this purpose, four physically oriented variables are used to establish the connection between the March air-sea fields and the subsequent ENSO evolution.They are the equatorial mean thermocline depth (TCD) anomalies (TCDa_M),the zonal wind stress anomaly in the western Pacific (Tauxa_W), the zonal gradient of the TCD anomalies in the equatorial Pacific (TCDa_G), and the mean meridional wind stress anomalies over the eastern equatorial Pacific (Tauya_E).The first two variables are associated with the recharge oscillator theory (Jin, 1997).TCDa_G reflects the see-saw oscillation of the thermocline between the western and eastern Pacific (e.g., Kumar and Hu, 2014) or the eastward propagation of Kelvin wave-like signals (Tseng et al., 2017).Tauya_E is linked to the meridional processes that have been emphasized in studying ENSO complexity (Hu and Fedorov, 2018; Xie et al., 2018).Specifically, the meridional processes in the eastern Pacific region, which were less often considered in classical ENSO theories, were verified to be important in depicting the following ENSO evolution from March (Hu and Fedorov, 2018; Xie et al., 2018).
Based on the above physical parameter selection, a quaternary linear regression equation is used to study the relationship between the March air-sea fields and the OND mean ENSO property as follows:

Figures 1c-d show the anomalous surface wind stress, SST, and TCD in March 2022.The equatorial central to eastern Pacific still maintains cold conditions, with a large area colder than -1°C.Correspondingly, the thermocline depth shows generally shallow anomalies in the east and deep anomalies in the west, a so-called tilt or dipole mode that is in phase with theENSO cycle (Kumar and Hu, 2014).Meanwhile, the southeasterly wind over the equatorial Pacific is appreciable.Such wind field distributions favor the induction of La Niña-like evolution through zonal Bjerknes feedback and meridional physical processes, such as the incursion of off-equatorial subsurface cold water (Zheng et al., 2015; Zhu et al., 2016).
To quantify the contributions to the possible third-year La Niña, Figs.2a-d show the time series of TCDa_M, TCDa_G,Tauxa_W, and Tauya_E in March during 1980-2022, which are normalized by their standard deviations.For comparison,March 2000 (i.e., the last year of the latest three-year La Niña) is marked by blue dots, while March 2022 is marked by reddots.As seen, neither of the thermocline variables (TCDa_M and TCDa_G) are significantly abnormal this year, indicating a challenge in predicting the subsequent ENSO evolution from the ENSO recharge-discharge theory and other classical ENSO theories that emphasize the variations in thermocline depth, i.e., zonal oceanic dynamics.In contrast, the atmospheric variables exhibit appreciable anomalies, with the easterly wind stress being comparable to that of 2000 and the southerly wind stress reaching its largest amplitude since 1980.Except for the strong easterly wind, the air-sea fields from 2000 are quite different from those in 2022.Namely, the former exhibits a large negative TCDa_G (i.e., the TCD was deeper in the west and shallower in the east) and anomalous northerly wind stress.

Fig.2.Normalized indices for (a) TCDa_M, (b) TCDa_G, (c) Tauxa_W, and (d) Tauya_E in March.In each panel, the blue and red dots represent 2000 and 2022, respectively.(e) The relationships between the reconstructed and observed OND mean Niño-3.4 index during 1980-2021.Their correlation coefficient (R)is 0.86.The reconstructed indices are obtained by Eq.(1) utilizing the TCDa_M, TCDa_G, Tauxa_W, and Tauya_E indices in March.The red, blue, and black dots represent El Niño, La Niña, and neutral years,respectively.(f) The coefficients (bars) and their 10% significance intervals by Student’s t test (error bars) of the four variables.They are calculated by the product of the regression coefficients and the corresponding standard deviations.
To quantify the contributions of each variable to ENSO, Fig.2e presents the reconstructed OND mean Niño-3.4 index by utilizing the quaternary regression and the four variables from March in 1980-2021.The correlation coefficient between the reconstructed and observed indices is 0.86.Additionally, all La Niña events can be accurately captured (i.e., the blue dots are in the third quadrant).Moreover, the coefficients (Fig.2f) of the regression suggest that the TCDa_M and Tauxa_W indices play dominant roles in ENSO development.The negative coefficients of the other two variables (i.e.,TCDa_G and Tauya_E) indicate that the positive (negative) zonal gradient of the TCD or the northerly (southerly) wind stress in the eastern Pacific favors the warming (cooling) of the eastern equatorial Pacific, illustrating the phase transition and the importance of the meridional processes in the eastern Pacific region, respectively.The latter factor (Tauya_E) has received less attention than the zonal Bjerknes feedback in understanding its influence on ENSO evolution from March(Xie et al., 2018; Fang and Xie, 2020; Fang and Zheng, 2021).
Based on this model, the relative contribution of each variable in March (i.e., TCDa_M, TCDa_G, Tauxa_W, and Tauya_E) to the OND mean Niño-3.4 index can be quantitatively estimated (Fig.3).It can be seen that for 2000, it is the strong easterly wind stress that overcame the opposite effects from all the other three variables.It suggests that although the oceanic dynamics (characterized by the thermocline depth distribution) does not support more cooling based on the recharge oscillator and other classical ENSO theories, the abnormally strong easterly wind in the western Pacific can lead to cooling through exciting the upwelling oceanic Kelvin waves and driving the anomalous westward surface currents.However, the situation is quite different in 2022.The anomalous easterly and southerly wind stresses are both important, and each may contribute ~50% toward the pending La Niña evolution, while the variables related to the TCD have little effect.The southerly wind is argued to be able to intensify the ocean upwelling south of the equator (Xie et al., 2018) and enhance the incursion of the subsurface cold water on the off-equator into the equatorial area (Zheng et al., 2015), thus acting as an extra cooling effect on the SST variations.Also, as suggested in Fang and Zheng (2021), the role played by the meridional wind on the equatorial eastern Pacific is more important on the following ENSO evolution after 2000 than during 1980-99,which further explains the large difference between these two events.
The differences between March and April 2022 (Fig.4) clearly indicate the persistence of the current La Niña condition.More specifically, the TCD is getting shallower in the central to eastern Pacific, the southeasterly wind over the equatorialPacific is still strong and even enhanced over the central tropical Pacific, and the SST is getting colder in the entire basin.Therefore, based on the current air-sea status and the quaternary linear regression model, our perspective is that the historic southeasterly winds over the equatorial Pacific are propitious to the emergence of a third-year La Niña event in 2022/23.

Fig.3.Contribution of each variable in March to the following OND mean Niño-3.4 index in 2000 (left) and 2022 (right).The blue, red, yellow, and purple bars represent the contribution percentages from TCDa_M, TCDa_G,Tauxa_W, and Tauya_E, respectively.The black bar is for the total (100%), i.e.,the combination of the four components.
To investigate the potential impacts of the pending three-year La Niña on the climate in 2022, the summer(June-July-August, JJA) mean precipitation and winter (December-January-February, DJF) mean temperature anomalies in 1975 and 2000 are shown in Fig.5 because since 1950, three-year La Niña events only existed in 1973-76 and 1998-2001.In the summers of 1975 and 2000, obvious precipitation anomalies were exhibited in the tropical regions related to the westward extension of the cold tongue with similarities and differences.There was less rainfall in southern North America but more rainfall in the southern Maritime Continent regions.However, in the warm pool of the western Pacific, the precipitation is less than usual in JJA 1975 but more than usual in JJA 2000.In China, the summer rainfall was concentrated over Huanghe-Huaihe Plain, China in 2000 but in northern China in 1975, while reduced summer rainfall occurred in southern China in both years.In the winter, a wide range of cold anomalies emerged in Eurasia and North America.More frequent and powerful cold air activities may impact the mid-high latitudes of the Northern Hemisphere, and extreme cold may grip much of the Eurasian or North American continents.In China, cold anomalies and warm anomalies were located in the central-to-eastern and northeast parts, respectively, in 1975, while 2000 had contrary circumstances.The inconsistencies between 1975 and 2000 create much uncertainty in the climate prediction of 2022 in China, and we should pay attention to the abovementioned areas with obvious precipitation anomalies and temperature anomalies in both 1975 and 2000.For example, more potential floods are related to more precipitation in the northern part of China and more possibleheat waves and droughts in southern China in the summer.Meanwhile, in this winter, we need to be aware of the risks of intense cold surges in Eurasia, which could also produce more cold extremes either in eastern or northeastern China.
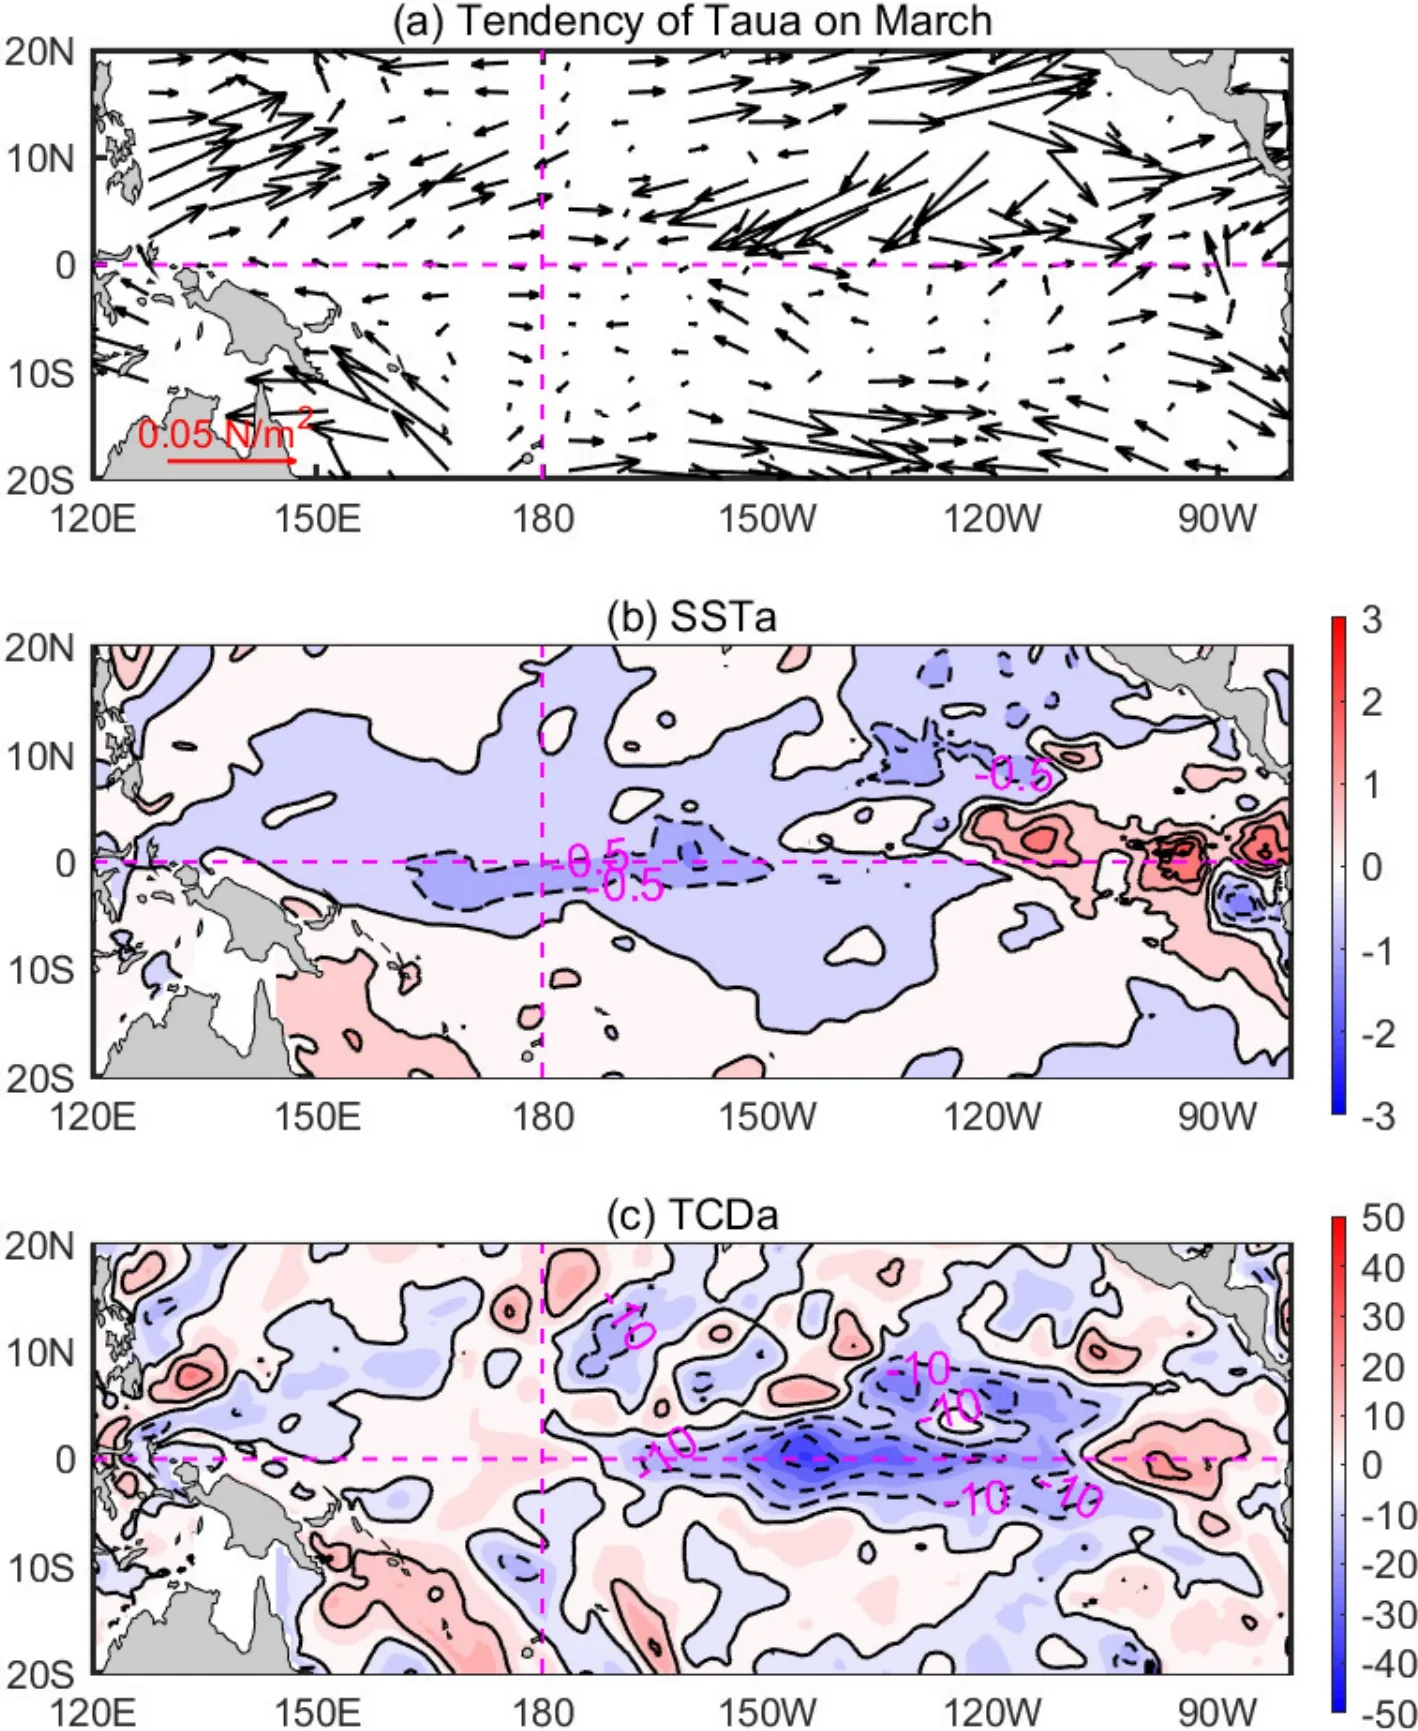
Fig.4.Tendency of (a) surface wind stress, (b) SST (contour interval is 0.5°C), and (c) TCD(contour interval is 10 m) between April and March in 2022.
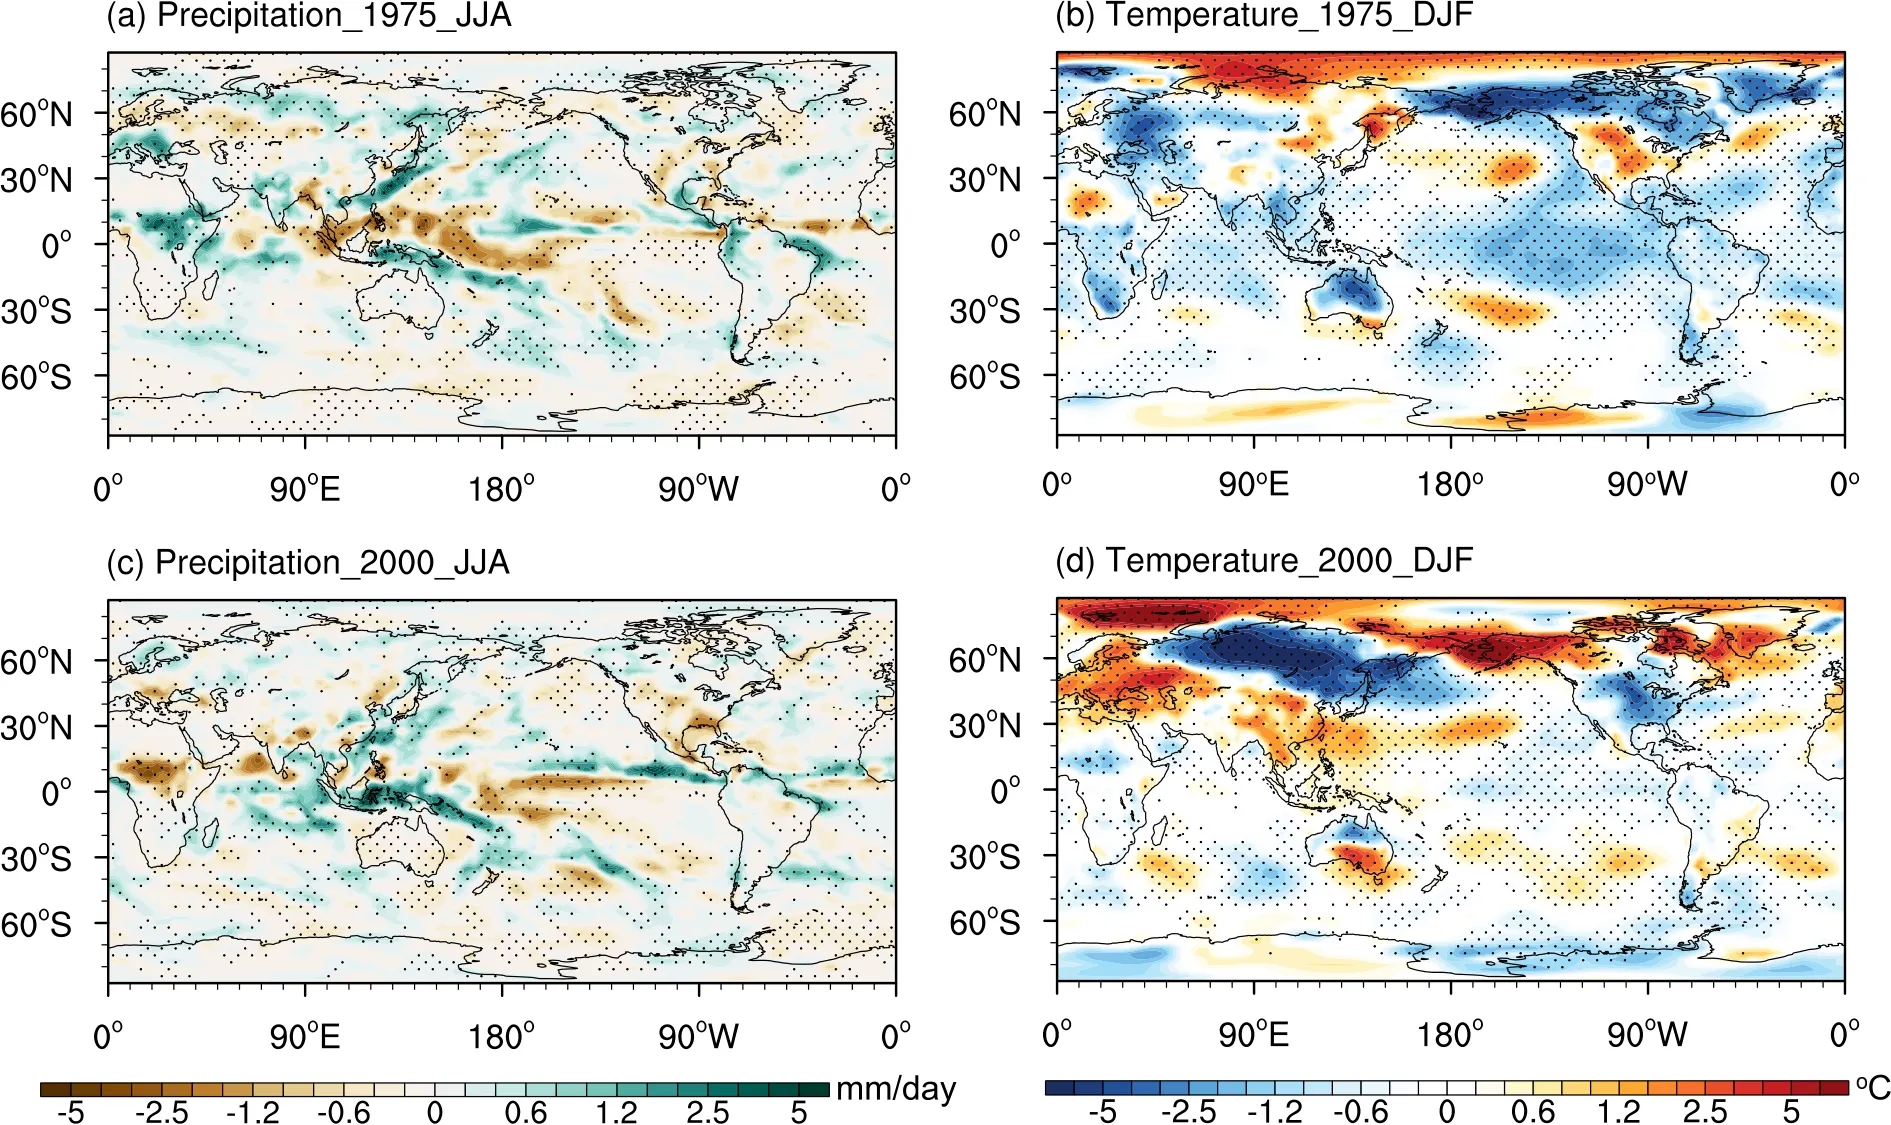
Fig.5.Precipitation of (a) JJA 1975 and (c) JJA 2000 and surface temperature of (b) DJF 1975 and (d) DJF 2000.Color shadings show the anomaly relative to 1980-2001.Dots are shown where the anomalies are all positive or negative in the three datasets used (i.e., JRA-55, ERA 40, and NCEP/NCAR Reanalyses).
Acknowledgements.This work is supported by the Key Research Program of Frontier Sciences of the Chinese Academy of Sciences(CAS; Grant No.ZDBS-LY-DQC010), the National Natural Science Foundation of China (Grant Nos.41876012; 42175045), the Strategic Priority Research Program of CAS (Grant No.XDB42000000), and Guangdong Major Project of Basic and Applied Basic Research(Grant No.2020B0301030004).The reanalysis data were downloaded from the NOAA Physical Sciences Laboratory (https://www.esrl.noaa.gov/psd/data/gridded/data.godas.html).
杂志排行

Advances in Atmospheric Sciences的其它文章
- Detection of Anthropogenic CO2 Emission Signatures with TanSat CO2 and with Copernicus Sentinel-5 Precursor (S5P) NO2 Measurements: First Results
- Unprecedented Heatwave in Western North America during Late June of 2021: Roles of Atmospheric Circulation and Global Warming
- Evolution of Meteorological Conditions during a Heavy Air Pollution Event under the Influence of Shallow Foehn in Urumqi, China
- Assimilation of Ocean Surface Wind Data by the HY-2B Satellite in GRAPES: Impacts on Analyses and Forecasts
- The Coordinated Influence of Indian Ocean Sea Surface Temperature and Arctic Sea Ice on Anomalous Northeast China Cold Vortex Activities with Different Paths during Late Summer
- Kinetic Energy Budgets during the Rapid Intensification of Typhoon Rammasun (2014)