Assessment of immune responses and intestinal f lora in BALB/c mice model of wheat food allergy via different sensitization methods
2023-01-23ChenglongLiuChenChenXingyuYanShiminGuXinJiaWenhuiFuXiaoMengWentongXue
Chenglong Liu, Chen Chen, Xingyu Yan, Shimin Gu, Xin Jia, Wenhui Fu, Xiao Meng, Wentong Xue*
College of Food Science and Nutritional Engineering, China Agricultural University, Beijing 100083, China
Keywords:Allergy Wheat gluten BALB/c mice Sensitization methods Intestinal f lora
A B S T R A C T Increasing incidences showed that food allergies have attracted more and more attention from researchers.BALB/c mice were sensitized with wheat gluten combined with aluminum hydroxide adjuvant via intraperitoneal injection, transdermal sensitization, and oral gavage sensitization route. Results showed that all the three sensitization methods could induce allergic symptoms; increase the serum antibody (total immunoglobulin E (IgE),specif ic IgE, IgG, IgA) and histamine content; promote the secretion of Th2 cytokines (interleukin (IL)-4, IL-5,IL-13) and inf lammatory factors (IL-6, IL-17A, IL-10); and inhibit the production of Th1 cytokines (IFN-γ, IL-2).However, the allergic symptoms of mice sensitized by intraperitoneal injection were the most obvious among the three models. The level of serum antibodies in intraperitoneal injection group was signif icantly higher than control. Subsequently, 16S rRNA sequencing technology was used to analyze the intestinal f lora of mice. The results showed that the abundance of Firmicutes in the wheat protein sensitized group was lower than that in the normal group, while the abundance of Bacteroidetes was higher, and Lactobacillus was the difference marker in normal group. Bacterial species diversity analysis showed that the species richness and diversity of intestinal f lora in mice were decreased, the difference between mice induced by intraperitoneal injection and normal control group mice was the most signif icant. Taken together, these results show that among three sensitization methods used to build a mouse model with aluminum hydroxide as adjuvant, intraperitoneal injection is the comparably best way to build a mouse sensitization mode.
1. Intoduction
As one of the ‘Big Three’ cereal crops, wheat is widely grown around the world and is the major component of the diet in the world. But it is also one of the ‘Big Eight’ categories of food allergens reported by the Food and Agriculture Organization (FAO)of the United Nations [1]. Currently, there is a lack of large-scale epidemiological data on wheat allergy [2]. Studies by some scholars showed that about 0.2%-1.0% of children in the United States were allergic to wheat [3], and about 0.2%-0.5% of children under 14 in Europe were allergic to wheat [2]. The main allergen that causes wheat allergy is the protein contained in wheat. At present, 18 foodborne wheat allergens have been collected by the World Health Organization and the International Federation of Immunological Societies Allergen Naming Group [4]. Gluten consisting of gliadin and glutenin is the major allergen in wheat and accounts for about 80% of the total wheat protein [5]. Allergic diseases such as wheatdependent exercise-induced anaphylaxis, baker’s asthma and atopic dermatitis are caused by wheat allergens, often accompanied by clinical symptoms such as urticaria, angioedema, bronchial obstruction, nausea, abdominal pain or systemic allergic reactions [2].There are many factors that can affect wheat allergy, such as genetic factors [6], environmental factors [7], age [8], and intestinal f lora [9].
In recent years, the influence of changes in the composition of the intestinal flora on food allergies has become a research focus. There are more and more studies on the effects of intestinal flora on food allergy. The “old friends” or the “biodiversity” hypotheses of allergy had been proposed to explain the relationship between microbiome and allergy [10]. Gut flora influences food allergy by regulating antigen presentation, immune cell differentiation and mucosal barrier [11].Epithelial cell Toll-like receptors (TLRs) stimulated by gut flora promote the proliferation of dendritic cells (DCs) through the adaptor molecule MyD88 signaling [12]. Maturation of a stable gut microbiota allows for a shift in the balance of Th2/Th1, favoring a response from Th1 cells that contribute to preventing food allergy, but dysbiosis alters host gut flora composition, favoring a change in the balance of Th1/Th2 towards a Th2-skewing leading to food allergy [13].
At present, murine are mainly used to study the mechanism of wheat allergy. Methods such as intraperitoneal injection, gavage sensitization and transdermal sensitization are often used in the construction of sensitization models. Ballegaard et al. [14] sensitized Norwegian brown rats by transdermal sensitization and found that the sensitizer could be sensitized by mildly damaging the skin. Akiyama et al. [15] sensitized mice by intragastric administration of ovalbumin(OVA) solution and drinking OVA water, and found that the levels of specific OVA antibodies and histamine in mice in the oral intragastric administration group were higher than those in the drinking OVA water group. Many researchers had used intraperitoneal injection to prepare sensitization models and studied the mechanism of food allergy. Jin et al. [16] built the sensitization model of wheat saltsoluble protein mice by intraperitoneal injection, and the results showed that salt-soluble wheat protein induced allergic reaction in mice, and the specific IgE, MMCP-1, Th2/Th17/Th1 cytokines,chemokines and E-selectin adhesion molecules were significantly increased, resulting in facial dermatitis in sensitized mice. However,previous studies mainly focused on the effects of different sensitization modes on allergic symptoms in animal models, and were not associated with changes in the composition of intestinal flora. In this study, BALB/c mice were used as the research object, and gluten was used as the sensitization protein to construct the sensitization model through three different ways to build the gluten sensitization model, to find the best way to construct the gluten sensitization model. Then, 16S rRNA high-throughput sequencing technology was used to analyze the composition and abundance of the intestinal flora of mice, and to evaluate the effects of different sensitization methods on the intestinal flora of the model, in order to provide a reference for the subsequent study of the relationship between allergy and intestinal flora through the gluten-sensitized mouse model.
2. Materials and methods
2.1 Materials
Wheat gluten (CAS#8002-80-0) was procured from Shanghai Yuanye Biotechnology Co., Ltd. BALB/c mice (3 weeks old,Female) were provided by Weitong Lihua Inc (Beijing, China). AIN-93M was purchased from Beijing Keao Xieli Feed Co., Ltd. The Bradford protein assay kit and bacterial genomic DNA extraction kit were purchased from Beijing Solarbio Science & Technology Co.,Ltd.. The IgA ELISA kit, IgE ELISA kit, and IgG ELISA kit were purchased from Cloud Clone Crop.
2.2 Preparation of soluble fractions of wheat gluten for mice sensitization
Wheat gluten was dissolved by adding 1 mg/mL gluten to sterile phosphate-buffered saline (pH 7.4). The mixture was vortexed for 30 min at room temperature (RT) followed by ultrasonication for 30 min.The procedure was done in triplicate to achieve maximum gluten dissolution. Then, the mixture was subjected to centrifugation using a bench-top centrifuge (Tomos 2-16R, Shanghai, China) centrifugation at 2 500 ×gfor 20 min at 4 °C, supernatant was collected and stored at 4 °C for future analysis. Protein concentration was (2.5 ± 0.1) mg/mL determined by the Bradford protein assay kit according to the instructions.
2.3 Sodium dodecyl sulfate polyacrylamide gel electropheresis (SDS-PAGE)
Protein samples were diluted in sample buffer (5× loading buffer, Solarbio Science & Technology Co., Ltd., China) and heated at 100 °C for 5 min. Then, 50 μg proteins were loaded into 5%stacking gel and separated on 10% polyacrylamide gels. The gel was resolved under 90 V for 30 min, 180 V for 50 min and then stained with coomassie brilliant blue R-250 for 40 min. Then, the gel was destained in a washing buffer (50%V/Vmethanol, 10%V/Vacetic acid) every 2 h for three times. The proteins images were taken using gel documentation system GenoSens 1880.
2.4 Animals
Thirty female specific pathogen free (SPF) BALB/c mice weanlings (8-12 g) at 3 weeks of age were obtained from Weitong Lihua Inc (Beijing, China) and maintained on a plant protein-free diet(AIN-93M) throughout the study. These mice were acclimatized for three weeks, provided with fresh water and diet and maintained in pathogen-free conditions of temperature (23 ± 2) °C/relative humidity(40%-70%) with a light/dark cycle of 12 h. All experimental studies were conducted under a protocol approved by the Animal Ethics Committee of China Agricultural University.
2.5 Mice sensitization protocol
Mice were grouped into the transdermal sensitization group,intraperitoneal injection sensitization group, intragastric sensitization group and control group (n= 12) randomly. At the beginning of the experiment, mice in the transdermal sensitization group were sensitized according to Ballegaard et al. [14] with minor modifications. The sensitization process on 21st, 28th, 35thand 42nddays are described as below: firstly, the abdomen of mice was scraped clean with an electric razor, and the abdomen of mice was scraped with 400 mesh sandpaper. Then 500 μL gluten solution was applied evenly to the abdomen of mice, the abdomen was wrapped with elastic gauze. After that, mice were put in the cage for 1 h, and then sterile water was used to rinse the administration area.
Intraperitoneal injection sensitization method reported by Vijaykrishnaraj et al. [17] was moderately modified in this research.Briefly, each mouse was intraperitoneally injected with 0.2 μL gluten solution (containing 2.5 mg/mL aluminum hydroxide) on the 21st,28th, 35thand 42nddays.
The method of intragastric sensitization was based on Fu et al. [18]with modifications. Each mouse was intragastric with 5 mg gluten and 0.5 mg aluminum hydroxide on the 21st, 28th, 35thand 42nddays.
The control group was not treated with any allergen. All sensitized mice were orally administered with 10 mg of gluten on day 56. Blood,colon contents, and tissues were harvested from mice on day 57. The animal experiments protocol is shown in Fig. 1. Rectal temperature was recorded before and 30 min after the oral challenge. The ΔTstands for temperature differences before and after the oral challenge.
2.6 Clinical symptoms evaluation
The mice symptoms associated with allergy were assessed. The degree of allergy was classified in relation to mice clinical symptoms in six steps: 0 = ‘no symptoms’; 1 = ‘scratch nose and head’; 2 =‘reduced movement or increased breathing rate’; 3 = ‘wheezing,difficulty breathing, redness around the eyes and/or mouth, and hair loss’; 4 = ‘convulsion or immobility after oral challenge; 5 = ‘death’.Clinical scores 4 and 5 were assigned as severe allergic symptoms,2 and 3 as moderate allergic symptoms, and 1 as mild allergic symptoms [19]. The clinical symptoms in mice were recorded 0.5 h after oral gavage stimulation.
2.7 Measurement of IgG, IgA, total IgE and specific IgE antibody levels
Blood was collected from the eyeball on day 57. After coagulation at room temperature for 2 h, serum was collected by centrifugation at 3 000 ×gfor 10 minutes at 4 °C. The serum was stored at -80 °C before being analyzed for antigen-specific IgE, IgA, and IgG using enzyme-linked immunosorbent assay (ELISA) kits.
2.8 Sample collection and DNA extraction
Intestinal contents (0.1 g) were weighed into 1.5 mL centrifuge tubes and 1 mL sterile PBS was added with vortex mixing until the mixture was evenly dispersed. The tube was centrifuged for 10 min at 2 000 ×gand supernatant was collected. DNA was extracted from the supernatant using the Bactrial Genomic DNA Extaction Kit per the manufacturer’s instructions. Extracted DNA was stored at -80 °C.The genomic DNA purity and quality were determined via 1.0%agarose gel electrophoresis.
2.9 16S rRNA gene sequencing
The V3-V4 regions of the 16S rRNA gene were amplified with the forward primer 341F (5’-CCTAYGGRBGCASCAG-3’) and reverse primer 806R (5’-GGACTACNNGGGTATCTAAT-3’). The V3-V4 region of the 16S rRNA gene was sequenced at the Novogene Bioinformatics Technology Co., Ltd. to evaluate the bacterial diversity by Illumina NovaSeq 6000. The cycling parameters were 94 °C for 3 min, followed by 35 cycles of denaturation at 94 °C for 45 s, annealing at 50 °C for 60 s, and elongation at 72 °C for 90 s with a final extension at 72 °C for 10 min. PCR reactions were completed in triplicate, and products were pooled. Each pool was then quantified by 2% agarose gel electrophoresis, pooled with equal amounts of DNA per sample. PCR products were purified by using the QIAquick Gel Extraction Kit (QIAGEN, Dusseldorf, Germany). The libraries were constructed using TruSeq®DNA PCR-Free Sample Preparation Kit, quantified by Qubit and Q-PCR, and sequenced by Illumina NovaSeq 6000.
2.10 Sequencing data analysis
Raw sequence data were analyzed using the QIIME (v1.9.1)software. The overlapping paired-end reads were merged into a sequence using FLASH, with a minimum 10 bp overlap length. Data were decontaminated by removing sequences shorter than 50 bp, those with a low-quality level (< 19), and those that did not exactly match the primer sequences or barcode tags. All high-quality reads were clustered into operational taxonomic units (OTUs) at 97% sequence similarity via Uparse (v7.0.1001). For each representative sequence,the Silva Database was used based on Mothur algorithm to annotate taxonomic information [20]. Alpha and beta diversity analyses were performed using QIIME v1.9.1. Differences in relative abundances of the phylotypes were determined via linear discriminant analysis (LDA)effect size (LEfSe).
2.11 Statistical analysis
Curve analysis and statistical analyses of antibody and cytokine levels between groups were performed using a one-way ANOVA with the Bonferroni correction for multiple comparisons using GraphPad Prism v8 (San Diego, CA, USA).
3. Results
3.1 SDS-PAGE analysis of allergens and effects of three sensitization methods on the characteristics of the allergic response
Firstly, the components of wheat protein were analyzed by SDSPAGE. As can be seen from Fig. 1A, protein bands were widely distributed in the range of 25-100 kDa, indicating that the main components of wheat proteins used for the sensitization model were glutenin (30-120 kDa) and gliadin (30-50 kDa) [21]. The content of glutenin was higher than that of gliadin, and the content of the high molecular weight component of glutenin was higher than that of the low molecular weight component. Then, to investigate whether the development of allergic sensitization to different sensitization protocols is different, mice were sensitized with transdermal sensitization, intraperitoneal injection, and oral gavage (Fig. 1B).As shown in Fig. 1C, most of the mice were sensitized with three sensitization methods, which caused different types of clinical symptoms. Of the three sensitization methods, only the intraperitoneal injection group showed severe allergic symptoms (clinical score is 4 or 5). The transdermal sensitization and oral gavage sensitization groups showed moderate or mild allergic symptoms (clinical score:2 or 3), and the oral sensitization group had the largest proportion of mild symptoms. The anal temperature of mice before and after oral stimulation was measured. Results showed that the anal temperature of mice in sensitized group increased after stimulation, which was significantly different from that of the control group. Among all the sensitized groups, the group sensitized by intraperitoneal injection increased the most (Fig. 1D).
3.2 Comparison of antibody and histamine contents in mice serum
The secretion level of antibody and histamine is positively correlated with the development of allergy in the body and has been widely used as an index to evaluate the antigenicity of allergens [18].After 24 h of oral stimulation, serum were collected from the different mice sensitization samples. The concentration of IgA, IgG, total IgE, wheat protein-specific IgE, and histamine were determined to compare the development of the sensitization among different groups.
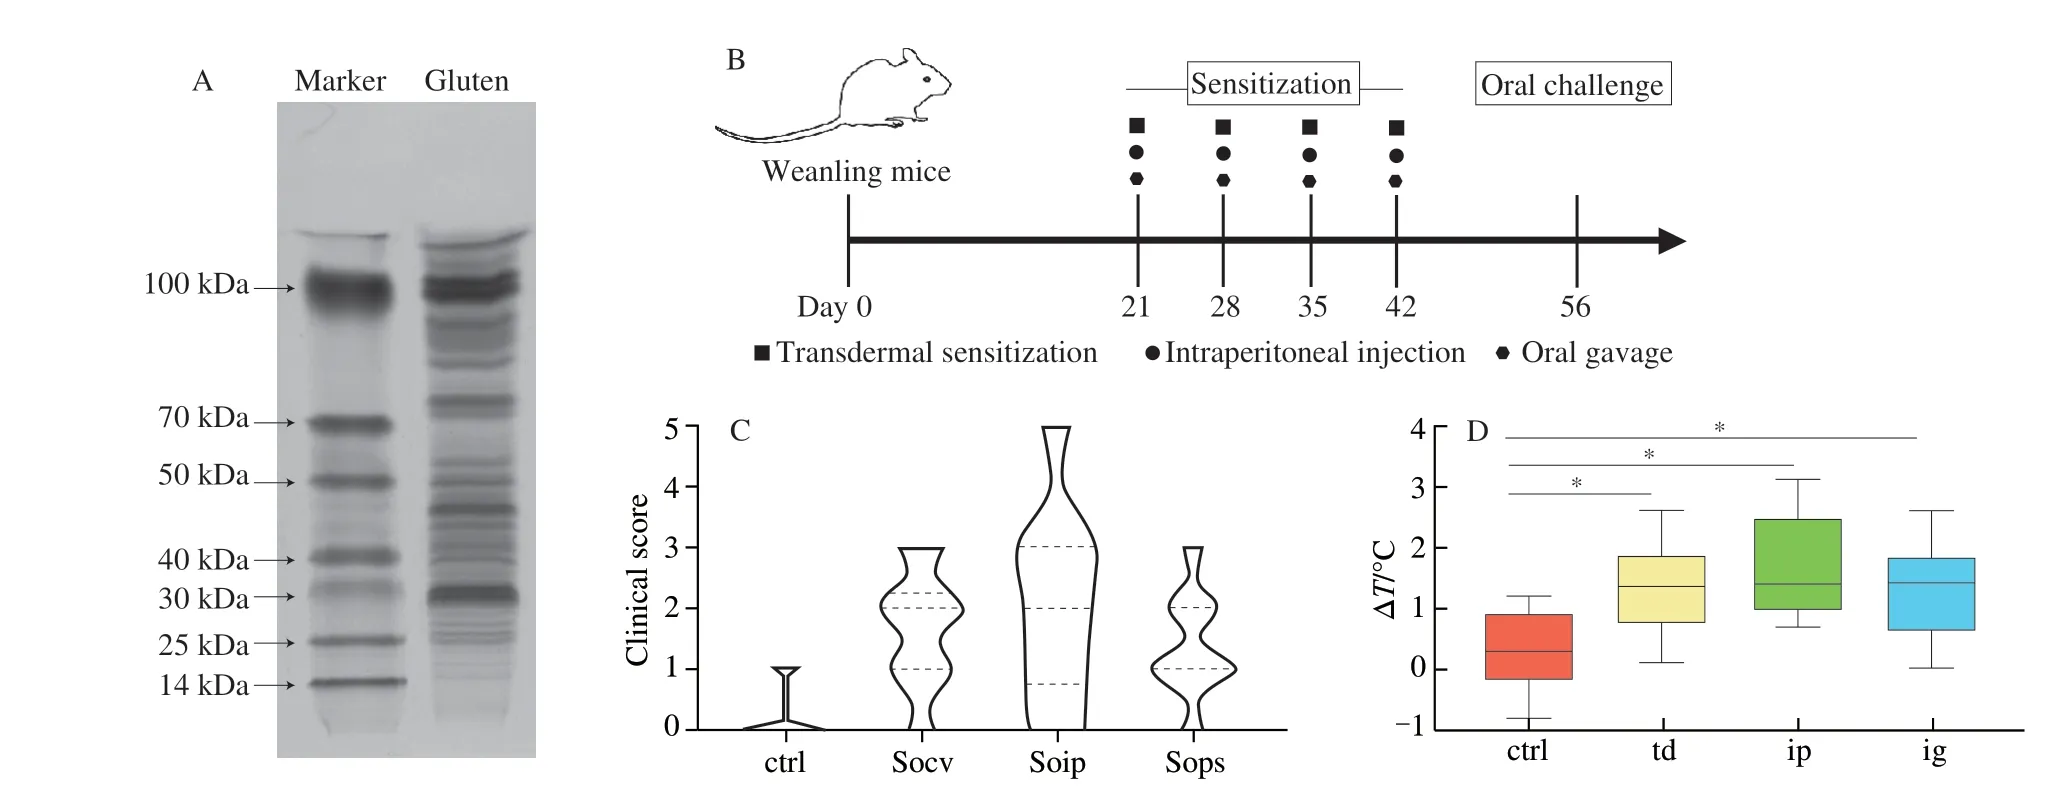
Fig. 1 Experimental study design and allergic symptoms iduced by three sensitization methods. (A) SDS-PAGE analysis of gluten concentration;(B) experimental study design; (C) clinical score; (D) the change of anal temperature in different groups of mice (ctrl, control; td, transdermal sensitization; ip,intraperitoneal injection; ig, oral gavage).
As seen in Fig. 2A-D, the contents of IgA, IgG, total IgE, and wheat-specific IgE in serum of the three sensitized groups were significantly higher than those in the control group. Serum IgA levels of the intraperitoneal injection, transdermal sensitization and oral gavage sensitization groups were 12.92, 12.65 and 12.13 μg/mL, respectively, with no significant difference (Fig. 2A).However, the IgG, total IgE, and wheat-specific IgE levels in the intraperitoneally sensitized mice were significantly higher than those in transdermal sensitization and oral gavage sensitization groups (Fig. 2B-D). The serum histamine content in different groups,and the histamine level in sensitized groups (73.40, 93.00,95.75 μg/mL, respectively) was significantly higher than the control group (12.15 μg/mL). The serum histamine content in the peritoneal sensitized group was higher than that in the other two sensitized groups.

Fig. 2 The content of antibody and histamine in serum of mice sensitized by different methods. Concentration of (A) IgA, (B) IgG, (C) total IgE, (D) wheat specific IgE, and (E) histamine in serum collected 24 h after challenge (ctrl, control; td, transdermal sensitization; ip, intraperitoneal injection; ig, oral gavage).Datas with the diffetent letter are significantly different (P < 0.05).
3.3 Comparison of cytokine contents in serum of mice sensitized by different sensitization methods
To explore the effect of different sensitization methods on the differentiation of Th0 cells, luminex liquid suspension chip detection was adopted to measure the concentration of Th1-biased and Th2-biased cytokines in mice serum collected 24 h after oral challenge.Interleukins level were significantly increased in serum of sensitized mice. Compared with the control group, the expression levels of Th1-biasd cytokine (IFN-γ, IL-2) were increased significantly in sensitization groups (Fig. 3A-B).
However, the expression level of Th2 cytokines (IL-4, IL-5 and IL-13) in intraperitoneally sensitized mice was higher than that in percutaneous sensitization group and oral sensitization group(Fig. 3C-E). In addition, there was no significant difference in IL-6 expression between the sensitized group and the control group. The expression level of Th17 cytokine IL-17A in the intraperitoneal injection group was significantly different from that in the control group, while there was no significant difference in the other two sensitized groups. The serum levels of Treg cytokine IL-10 were significantly different between sensitized group and control group.Similar to Th2 cytokines, the expressions of IL-6, IL-17A and IL-10 in intraperitoneal injection group were higher than those in oral sensitization group and percutaneous sensitization group.
3.4 Intestinal microbiota compositions in allergic mice and controls

Fig. 3 The content of cytokine in serum of mice measured by luminex liquid suspension chip. Concentration of (A) IFN-γ, (B) IL-2, (C) IL-4, (D) IL-5, (E) IL-13,(F) IL-6, (G) IL-17A, and (H) IL-10 (ctrl, control; td, transdermal sensitization; ip, intraperitoneal injection; ig, oral gavage). Datas with the diffetent letter are significantly different (P < 0.05).
An average of 95 012 sequence tags were measured per sample,and an average of 93 137 valid data were obtained through quality control. The average quantity of effective data in quality control was 58 535, and the high quality sequences accounted for 61.63%of the whole sequence collected. There was no significant difference in effective sequences between groups. The operational taxonomic units (OTUs) were clustered according to 97% identity, and a total of 2 517 OTUs were obtained. Then the OTUs were annotated with the SILVA138 database for species. The results showed that 81.13% of OTUs could be annotated to the gate level, and 36.74%to the genus level. A total of 37 phyla and 400 genera were found in all samples. Fig. 4 shows the taxonomic distribution of total microorganisms for each sample at the phylum and genus levels.Although there is considerable variation among individuals in taxonomic composition, there are some dominant species at both phylum and genus levels.
It can be found that Firmicutes, Bacteroidetes, Proteobacteria and Desulfobacterota occupy the dominant position at the phylum level (Fig. 4A). It accounted for more than 70% of the total phylum in both the control group and the sensitized group (Fig. 4C). The dominant genera of intestinal flora wereAlistipes, Lachnospiraceae_NK4A136_group andBlautia.Colidextribacter,BacteroidesandAlloprevotellawere the next three genera (Fig. 4D). The genusAlistipes,AlloprevotellaandBacteroidesbelong to Bacteroidetes.Lachnospiraceae_NK4A136_group,BlautiaandColidextribacterare Firmicutes. The dominant bacteria identified in the control group wereLachnospiraceae_NK4A136_group (11.35%),Colidextribacter(7.09%),Alistipes(6.70%),Blautia(5.80%) andBacteroides ES(2.95%),Alloprevotella(2.29%),Streptococcus(1.31%),Lactobacillus(1.16%),Alistipesand Lachnospiraceae_NK4A136_group were the dominant strains identified in the sensitized group.
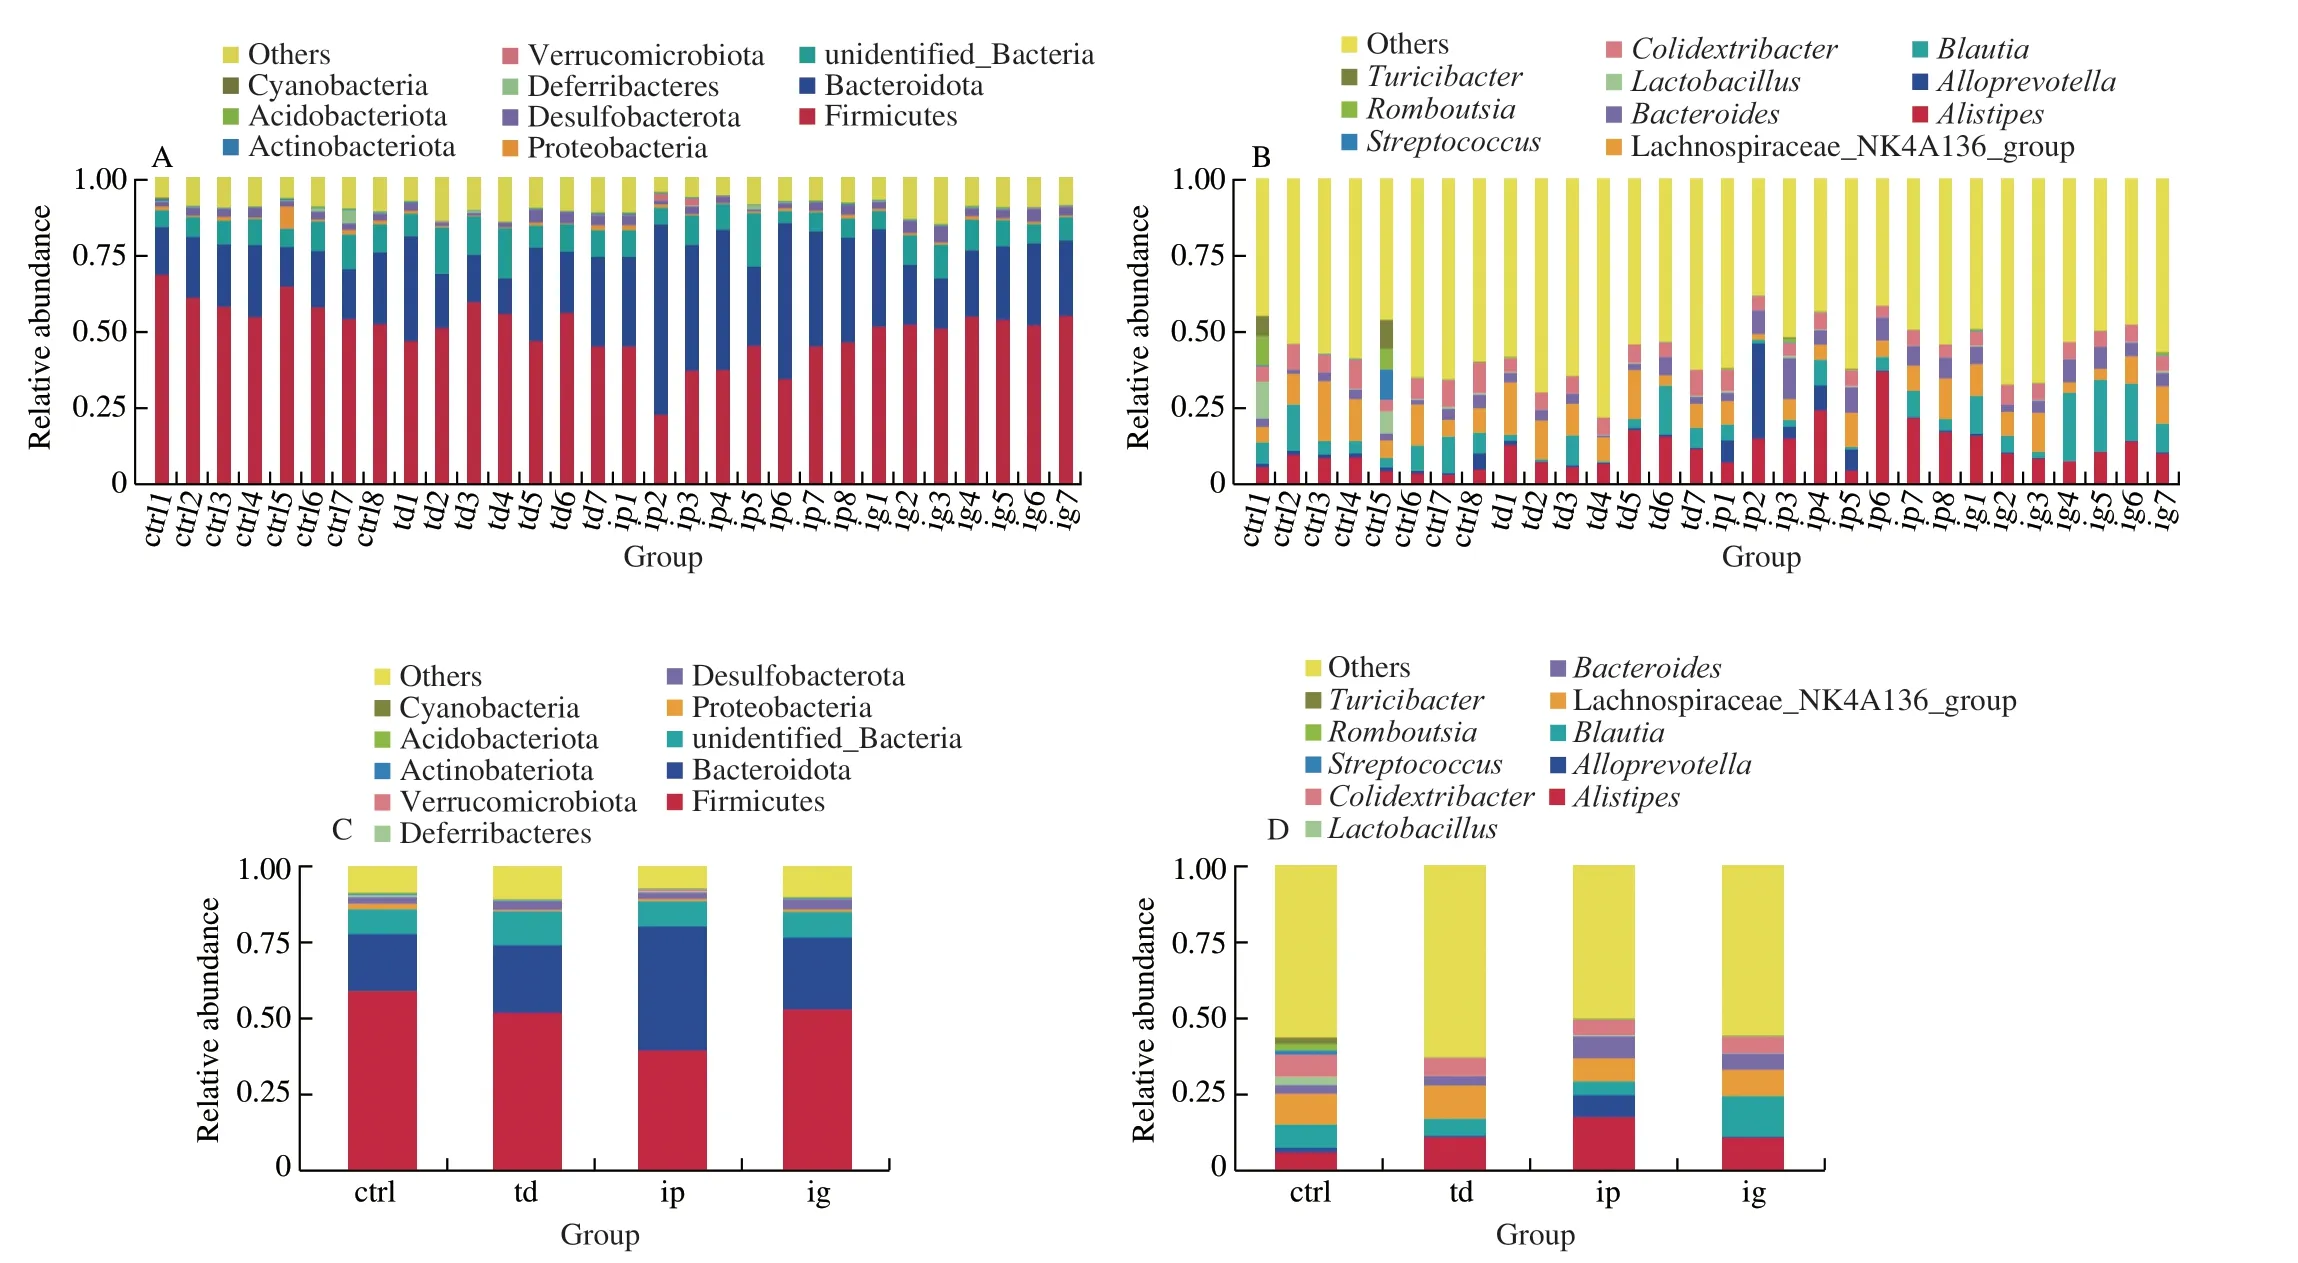
Fig. 4 Community bar-plot analysis shows relative abundance of intestinal flora in each sample at the phylum and genus levels. Comparison of relative taxa abundance at (A, C) phylum, (B, D) genus level (ctrl, control; td, transdermal sensitization; ip, intraperitoneal injection; ig, oral gavage).
3.5 Intestinal microbial diversity analysis of allergic mice and control group
As seen in Table 1, the effective number of high-throughput sequencing sequences of intestinal contents of mice in each group were 55 515 ± 4 262, 61 827 ± 4 123, 57 352 ± 4 489 and 60 268 ± 3 105,respectively, indicating a relatively sufficient amount of sequencing data. According to 97% consistent OTU-clustering results, the number of OUT in each group was 849.0 ± 79.69, 628.6 ± 96.01, 721.6 ± 84.11 and 778.6 ± 126.4, respectively, and the number of OUT in the control group was significantly different from that in the sensitized group.
The diversity of intestinal flora in each group was characterized by Shannon index, Simpson index, ACE index and Chao1 index.The results are shown in Table 1 and Fig. 5. As shown in Table 1,theα-diversity index of intestinal contents of mice in the sensitized group was decreased. The Shannon index, Chao1 and ACE index of the control group were significantly higher than those of the threesensitized groups, and the Chao1 and ACE indexes of the control group were also significantly higher than those of the percutaneous sensitization group and the intraperitoneal injection sensitization group, but there was no significant difference between the control group and the gastric sensitization group. Results indicated that the diversity and richness of intestinal flora of the control group were better than those of the three sensitized groups, but the intestinal flora of the intragastric sensitized mice was closer to that of the control group than that of the intraperitoneal sensitized and percutaneous sensitized mice.

Table 1 Intestinal flora diversity index table of mice in each group.

Fig. 5 Shannon index and Simpson index. (ctrl, control; td, transdermal sensitization; ip, intraperitoneal injection; ig, oral gavage.)
3.6 OTUs dilution curve of intestinal microorganism in allergic mice and control group
According to the effective sequence obtained and filtered by the system and the amount of OTU consistent with 97%, the corresponding dilution curve was established. As shown in Fig. 6,within the detected effective sequence, the dilution curve showed a flat trend at last, indicating that our sequencing method detected the vast majority of microorganisms in the sample. And the test results were able to cover almost all species in the sample, which reflect the basic condition of microorganism in each sensitized group and control group.

Fig. 6 OTU dilution curve of intestinal flora of mice in different groups.ctrl, control; td, transdermal sensitization; ip, intraperitoneal injection;ig, oral gavage.
3.7 Analysis of intestinal microbial composition in allergic mice and the control group
In order to study the similarity between different samples,the clustering tree of samples was established through the cluster analysis of samples, and the evolution tree represented the evolutionary relationship of sequences among samples. The length of the branches in the figure represents the distance between the samples. If the community composition of the samples is similar,they will cluster together in the cluster tree. As can be seen from Fig. 7, the species composition of intestinal flora of mice in the intraperitoneal injection group was the most similar to that of mice in the transdermal sensitization group, followed by that of mice in the oral gavage sensitization group. Compared with the control group, the composition of intestinal flora in the sensitized group was significantly different.

Fig. 7 Tree diagram of intestinal flora of mice in each group at phylum level. (ctrl, control; td, transdermal sensitization; ip, intraperitoneal injection; ig, oral gavage.)
LEfSe was used to determine the different bacterial taxonomic biomarkers between the control group and the three sensitized group,so as to find species with significantly different abundancy between the four groups. Circles from the inside to the outside represent the structure of all microflora from the phylum to the genus (species)level in the taxonomic cladogram (Fig. 8A). Bacteria with LDA score greater than 4 were identified as groups with statistically significant differences (Fig. 8B). At the phylum level, the differences in intestinal flora of the control group wereFirmicutes and Bacteroidetes, while those in the intraperitoneal sensitization group were desulfurization bacteria, those in the percutaneous sensitization group were Promutobacteria and Firmicutes, and those in the oral sensitization group were Bacteroidetes. There were statistically significant differences between the intraperitoneal injection sensitization group and the transdermal sensitization group at the phylum level, while the differences between the oral gage sensitization group and the control group could not be classified until the family level. Results showed that the significant difference bacteria in the intestinal flora of control mice wereLactobacillusand Rotamobacteriaceae,the bacteria with significant difference in the intestinal flora of the transdermal sensitized mice and the contol mice belonged to different phylum, and the bacteria with significant difference in the intestinal flora of oral sensitized mice and control mice were different at the level of family.
4. Discussion
More and more studies have shown that intestinal flora imbalance plays important role in the occurrence and development of food allergy. Therefore, restoring intestinal flora has become a new strategy for the prevention and treatment of allergies. Most studies explored sensitization mechanism of food proteins by using mouse models,and the differences among different models are mainly due to the varied sensitization methods. In this study, the effects of oral gavage,intraperitoneal injection and percutaneous sensitization of wheat allergens on the sensitization effect of BALB/c mice were compared.By analyzing the effects of different sensitization methods on the allergy of mice, the best sensitization methods were found to establish an effective animal model, which provided certain theoretical basis for the construction of animal models and also provided an important model basis for the study of intestinal flora of food allergy.

Fig. 8 Identification of different strains of intestinal flora between different sensitized groups and control groups. (A): The taxonomic cladogram displayed the enriched taxa in three sensitization groups and control fecal microbiota. Each node represents a specific taxonomic type. The diameter of each circle is proportional to the relative abundance of the taxon; (B): Histogram of the LDA scores between three sensitization groups and control groups (LDA score > 4) (ctrl, control; td, transdermal sensitization; ip, intraperitoneal injection; ig, oral gavage).
Allergy can cause different symptom reactions in many parts of the body, such as skin itching, redness, asthma, diarrhea, etc. [22].Clinical allergy symptom score is an important index to evaluate the occurrence and severity of food allergy. As shown in Fig. 1B, the proportion of mice with clinical allergic symptoms were most obvious in mice sensitized by intraperitoneal injection, and the proportion of mice with severe symptoms was also the largest. In addition,the changes in anal temperature before and after sensitization of the sensitized mice were all positive (Fig. 1C), indicating that the sensitized mouse model was successfully constructed. All three sensitization methods could cause allergic symptoms in mice. And the mice model induced by intraperitoneal injection has more obvious allergic symptoms, so it is the most suitable for the construction of sensitization model.
Serum IgE content is also an important indicator to evaluate food allergy, and a large number of studies have shown that the severity of food allergy is closely related to the level of heterotopic antibodies in the body [23-25]. Some IgE in the serum binds directly to antigens and precipitates them, while others enters the circulation through the lymphatic system and binds to basophil cells in the blood and mast cells in distant tissues to sensitize the body. When the sensitized organism takes up the allergen again, the antigen will quickly bind to the IgE on the surface of the sensitized mast cells or basophil, and the mast cells will be degranulated, releasing histamine, leukotriene,5-hydroxytryptamine, chemokines, etc., thus producing tissue-specific symptoms of allergic reaction. When the allergen enters the normal body, it triggers an immune response by secreting IgG and IgA in response to the invasion of the allergen, while IgG and IgA do not cause an allergic reaction and inhibit the secretion of IgE. A number of studies have shown that anti-allergic substances can induce the differentiation of initial T lymphocytes into Th1 in mice, thereby regulating the balance of Th1/Th2 and inhibiting the occurrence of allergic reactions. As shown in Fig. 2A-D, the serum IgE and IgG content of the intraperitoneal injection sensitized mice were significantly higher compared to the other two sensitized groups or the control group. Otherwise, there was no significant difference in IgA content in the serum of three sensitized mice.
When the body produces an allergic reaction, the histamine released by mast cells and basophil cells will bind to the specific receptors of vascular smooth muscle cells, resulting in increased vasodilation and permeability, inducing the secretion of bronchiole mucus, leading to asthma. In addition, histamine can also act on sensory nerve endings and induce symptoms such as pruritus in the area of eczema [26]. Therefore, histamine content is an important indicator to evaluate the severity of food allergy. As shown in Fig. 2E, the serum of mice sensitized by intraperitoneal injection was the highest. Therefore, combining the results of allergy symptom score, serum antibody analysis and serum histamine content, we can draw the following conclusion: all three sensitization methods can be used for the establishment of the mouse allergy model, but the intraperitoneal injection method has the most significant effect in the establishment of mouse allergy model.
Current studies have shown that the disruption of Th1 and Th2 balance is a key link in food allergies [18]. In allergic mice, Th0 cells differentiated into more Th2 cells. IL-4, IL-5, and IL-13 are typical cytokines of Th2. IL-4 can induce the antibody class transformation of B cells and increase the secretion of IgE antibodies. IL-4 also promoted the differentiation of Th0 into Th2. IL-5 mainly stimulates the growth and differentiation of eosinophils. At the same time, it can cooperate with IL-4 to promote Th2 cell-mediated allergic reaction,and then stimulate the growth and differentiation of B cells. IL-13 has a similar biological function to IL-4 and can induce B cells to synthesize IgE. These cytokines trigger or promote the occurrence and development of anaphylaxis jointly. IFN-γ and IL-2 are Th1 type cytokines. IFN-γ promotes Th0 to Th1 differentiation, stimulates CD8 CTL cell maturation, induces B-cell IgG2a and IgG3 class conversion and suppresses IgE class conversion. IL-2 can stimulate the growth of T cells, B cells, and NK cells, but does not cause the antibody class switch of B cells. Th1 cytokines inhibit allergic reactions. IL-10 inhibits the Th1 cell response and cytokine secretion, and promotes the proliferation and differentiation of B cells and the production of antibodies. Multiple studies have shown that when food allergy occurs, Th17 cells in the body are stimulated to secret IL-17, IL-6 and other inflammatory cytokines, thus increasing the content of Th17 in the body, which shows the correlation between Th17 and food allergy [27-29]. As can be seen from Fig. 3A-H, the contents of various types of cytokines in the serum of the sensitized group were higher than those of the control group, and the contents of Th1-type cytokines (IFN-γ, IL-2) in the intraperitoneal injection group were lower than those of the other two sensitized groups. The contents of Th2 cytokines (IL-4, IL-5, IL-13) and pro-inflammatory cytokines (IL-6, IL-17A, IL-10) were higher than those of the other two sensitized groups. These results indicated that Th0 tended to differentiate into Th2 in the sensitized group, breaking the balance of Th1/Th2, and this trend was more obvious in the group sensitized by intraperitoneal injection.
In summary, from the analysis of clinical symptoms, antibodies,histamines and cytokines in serum, it can be found that the mice sensitized by intraperitoneal injection have the best sensitization effect and the model constructed is the most successful. This indicated that intraperitoneal injection sensitized mice had the most severe allergic symptoms, which was consistent with the influence of different antigens entering the body on immune tolerance, that is, oral intake of antigens was more conducive to inducing immune tolerance,followed by percutaneous sensitization, and intraperitoneal injection was more difficult to induce immune tolerance than oral intake and percutaneous intake. There are differences in the body’s antigen absorption sites under different sensitization routes. Antigens are absorbed into the body through the skin and wound in the transdermal sensitization model, while in the intraperitoneal injection model, the antigen is absorbed directly through the intestinal mucosa, while in the intragastric sensitization model, the allergens are digested by the stomach and then absorbed into the intestine. The stimulation of different immune parts can cause the proliferation and differentiation of different immune cells [30], which leads to the above results.
More and more studies have shown that there is an interaction between intestinal flora and food allergy, which has led to the “hygiene hypothesis” and the “old friend hypothesis”, and the important role of intestinal flora in reducing food allergy sensitivity [10]. A recent study based on 16S rRNA sequencing showed that the abundance of Lachnospiraceae, Leuconostocaceae, and Streptococcaceae families in the intestinal microbiota of children with egg allergy was significantly disrupted. Compared with non-allergic people, the microbial richness in the intestinal microbiota of peanut or tree nut allergy patients decreased, while the abundance ofBacteroidesspecies increased [31].It has also been reported that the intestinal microbial community structure of infants with milk allergy is dominated by Trichelicaceae and Ruminococcaceae [32]. In addition, a significant increase in Proteobacteria is considered a potential marker of intestinal microbiota imbalance, as observed in various inflammatory diseases [33].In the current results, increased Bacteroidetes/Proteobacteria and decreased Firmicutes were found in OVA allergic mice. At the family level, the abundance of probiotics of Lactobacillaceae,Bifidobacteriaceae and Prevotaceae decreased significantly,while the abundance of pathogenic families (Helicobacteraceae,Desulfovibrionaceae and Ruminococcaceae) increased [34].Therefore, these intestinal probiotics and pathogenic bacteria can be regarded as the characteristic intestinal microorganisms associated with food allergy. However, at present, most studies have focused on milk, egg and peanut protein, and there are few studies on the effects of sensitization methods on the intestinal microbiome, especially in animal models of wheat allergy [35]. In this study, the intestinal flora of wheat sensitized animal models was studied, which could provide a useful reference for the study of intestinal flora of wheat allergy.
The results showed that at the phylum level (Fig. 4C-D),the abundance of Firmicutes decreased and the abundance of Bacteroidetesincreased in the allergic mice. At the family level, the abundance ofLachnospiraceae and Oscillospiraceae in the intestinal flora of mice in the sensitized group was higher, while the abundance of Lactobacillaceae was lower. At the genus level, the sensitized mice had higher representation ofAlistipesandBacteroides, and reduced proportions of Lachnospiraceae_NK4A136_group,Colidextribacter,Streptococcus,Romboutsia,Turicibacter, andLactobacillus, in comparison to the normal group. Theα-diversity of intestinal flora in the control group was better than that in the sensitized group(Table 1, Fig. 4). Among the three sensitized groups, the difference in intestinal flora species composition between the intraperitoneal sensitized group and the control group was the largest, and the difference in intestinal flora species composition between the orally sensitized group and the control group was the least. This is consistent with the severity of sensitization symptoms, indicating that there is a correlation between the severity of sensitization symptoms and the composition of intestinal flora. In addition, we found that Lactobacillaceae andLactobacilliwere enriched in normal mice and were biomarkers of the different intestinal flora of normal mice.Supplementation withLactobacillus rhamnosum GG(LGG) enhanced the favorable immunoregulatory activity of extensively hydrolysed casein formula (EHCF) in response to milk allergy.Lactobacillusregulate immune function by tilting to Th1 response, regulating Th1/Th2 balance, inducing Treg cells and inhibiting allergic reaction [36,37].Lactobacillusalso enhances the tight junction function of human intestinal tract [38]. In contrast, Rivas et al. [39] found rich taxa of Lactobacillaceae in OVA-sensitized I14RAF709 mice compared with wild-type mice. By comparing populations that were genetically similar but had different atopic incidences, a higher number of Lactobacilli in populations with higher atopic incidences. The biological effects of microbiota may occur at the strain level.Therefore, the effects of different strains within the same family are different. In addition, many factors can influence the results of microbiome studies, such as different food allergies, sample collection, and treatment [40].
Based on these results, we propose a hypothesis to explain the relationship between intestinal flora changes and sensitization.Lactobacilluscan protect the development of sensitization by maintaining appropriate host immune tolerance and enhancing barrier function [37,38]. Previous studies have shown that propionic acid supplementation can reduce susceptibility to allergic airway inflammation and impair the efficacy of pulmonary dendritic cells in reactivating the Th2 response [41]. Dialister, therefore, as a propionic acid-producing microorganism, may also play a protective role in the development of sensitization. Several clinical trials have examined the role of probiotics in preventing or treating allergic diseases.The addition of LGG to EHCF has been shown to accelerate milk protein tolerance in infants [42]. Combined prenatal and postnatal supplementation of LGG can protect infants at risk of atopic diseases from secondary allergic reactions. In our study, we found that lactic acid bacteria were more abundant in the control group than in the sensitized group. Given that the association between LGG and the immune system has been established [31,37], we hypothesize that lactic acid bacteria supplementation may be helpful in the prevention and treatment of food sensitization. The biological effects of microbiota of different strains may be different, and the microbiota associated with different food allergy subphenotypes may also be different [40]. Further studies are needed to evaluate the effect of probiotic supplements on wheat sensitization.
5. Conclusions
In addition to typical allergic symptoms, wheat sensitizing protein can increase serum antibody (total IgE, specific IgE, IgG, IgA) and histamine content in mice through three sensitization methods, and promote the secretion of Th2 cytokines and pro-inflammatory factors,which can be found by inhibiting the secretion of Th1 cytokines.Among the three sensitization methods used to build a mouse sensitization model with aluminum adjuvant, intraperitoneal injection sensitized mice had the most obvious allergic symptoms, and the differences in the contents of various factors in serum were also the most significant compared with the normal group, indicating that intraperitoneal injection can be used to efficiently build sensitization model. The results of intestinal flora analysis showed that the abundance ofMycobacteriumposterior decreased andBacteroidetesincreased in the wheat protein sensitized group compared with the normal group, andLactobacilluswas the marker of difference in the normal group. The diversity analysis showed that the richness and diversity of intestinal flora of sensitized mice were decreased.
Declaration of competing interest
The authors declare no conflict of interest.
Acknowledgements
This review is supported by the National Key Research and Development Program of China (2019YFC1605000) and the National Natural Science Foundation (1872904).
杂志排行

食品科学与人类健康(英文)的其它文章
- The role of probiotics in prevention and treatment of food allergy
- Roles of fermented plant-, dairy- and meat-based foods in the modulation of allergic responses
- The role of gut microbiota and its metabolites short-chain fatty acids in food allergy
- Association of nutrients intake during pregnancy with the risk of allergic disease in offspring: a meta-analysis of prospective cohort studies
- Purif ication and immunoglobulin E epitopes identif ication of low molecular weight glutenin: an allergen in Chinese wheat
- Determination of egg and milk allergen in food products by liquid chromatography-tandem mass spectrometry based on signature peptides and isotope-labeled internal standard