Evaluation of allergenic protein prof iles in three Chinese high-oleic acid peanut cultivars using NanoLC-Orbitrap mass spectrometry
2023-01-23XinkeYngHochenBiLijunYinJinWngWentongXueXinJi
Xinke Yng, Hochen Bi, Lijun Yin, Jin Wng, Wentong Xue,*, Xin Ji,*
a College of Food Science and Nutritional Engineering, Beijing Key Laboratory of Functional Food from Plant Resources, China Agricultural University, Beijing 100083, China
b The Key Laboratory of Crop Genetics and Breeding, Institute of Cereal and Oil Crops, Hebei Academy of Agricultural and Forestry Sciences, Shijiazhuang 050035, China
Keywords:Allergy High-oleic acid peanut Peptide-f iltering pipeline NanoLC-Orbitrap mass spectrometry
A B S T R A C T High oleic-acid peanuts are known for their pre-longed shelf-life and health benef it due to high content of oleic fatty acid. However, the allergenicity and allergenic protein prof iles in Chinese high-oleic peanuts have yet to be studied. For this purpose, an Orbitrap Fusion mass spectrometry (MS)-based method that is feasible for identif ication of putative allergenic protein as well as semi-quantitation of f ive major allergen protein in three different Chinese high-oleic peanut cultivars (JH 13, JH 16 and JH 18) have been reported. Results show that three Chinese high-oleic acid peanut cultivars selected all contained highly allergenic proteins Ara h 1,Ara h 2, Ara h 3 and Ara h 6. The allergenic protein prof iles of Chinese high-oleic acid peanut cultivars were very similar to that of conventional peanuts, but the allergenic protein subunits varied greatly among higholeic peanuts. Additionally, a comprehensive peptide-f iltering pipeline had been developed for identif ication of potential peptide markers in peanut allergen proteins. Through the peptide-f iltering pipeline, three novel peptide markers, IVQIEAKPNTLVLPK, SSNPDIYNPQAGSLR and AQSENYEYLAFK surrogate to Ara h 1,Ara h 3 with high abundance, good MS response and highly reliability were identif ied, which can be used as candidate peptide markers for the detection of peanut allergens in different food matrices.
1. Introductions
Peanut (Arachia hypogea) allergy is an immunoglobin E (IgE)-mediated food allergies that has become a major health concern worldwide, especially in developed countries [1]. It has been the majority of severe food-related allergic reaction with the highest rate of induced anaphylactic shock [2]. In China, food allergies make up only 3.4%-5.0% of all allergies, although the exact national data for the prevalence of peanut allergy in China has yet to be reported,there has been a growing tendency of its increasing prevalence [3,4].A recent report revealed peanut allergy subjective symptoms can be triggered at as low as 100 μg, and object signs of allergy were evident at 2 mg [5].
Peanuts high in oleic acid were originally developed at the University of Florida, USA. High oleic-acid peanuts contain 80% and above oleic acid and 2% linoleic acid, as compared to 50% oleic acid and 25% linoleic acid in conventional peanuts [6]. High oleic peanuts were reported to enhance the shelf-life and reduce rancidity, as compared to the conventional peanuts [7-9]. High oleic-acid peanuts have also shown to have health benef its such as lowering cholesterol levels and preventative effect against hyperlipidemia due to the elevated level of polyunsaturated fatty acid (PUFA) [10]. Moreover,previousin vivostudies have indicated that the high ratio of linolenic and linoleic acid suppresses allergic responses and anaphylactic shock in mice [11,12]. Therefore, it is reasonable to believe alteration of ratio of oleic to linoleic acid in high-oleic peanuts may lead to a different allergenic prof ile.
Currently, based on the Allergen Nomenclature Sub-Committee of the International Union of Immunological Societies, 18ara hgenes encoding Ara h proteins, termed as Ara h 1 to Ara h 18, are officially recognized as allergens that can induce the production of specific IgE antibodies upon peanuts ingestion. The major peanut allergens Ara h 1 (~64 kDa), Ara h 2 (~17 kDa), and Ara h 3(~35 or ~37 and ~60 kDa) that usually cause severe symptoms belong to cupin seed storage protein superfamily [13,14]. Within which,Ara h 1 belongs to the 7S trimeric vicilins and Ara h 3 belongs to the 11S hexameric legumins [15,16]. Ara h 2, Ara h 6 (~15 kDa), and Ara h 7 (~15 kDa) are 2S albumin seed storage protein which are members of the prolamin superfamily [17]. Peanut allergen Ara h 5(~15 kDa) is a member of the profilin family that is responsible to control cytoskeletal dynamics and membrane trafficking. Ara h 8(~17 kDa) belongs to the major birch pollen allergen Bet v 1 protein.A previous comparative study on allergenic properties has found that high-oleic peanuts provide decreased allergenic sensitization due to additional allergen at approximately 36 kDa (Ara h 4) present in conventional peanuts and was immunologically sensitive, but did not appear in high-oleic peanuts [6]. Previous research has been limited to content of major peanut allergens Ara h 1, Ara h 2 and Ara h 3 in high oleic-acid peanut in comparison to traditional peanuts, allergen composition and proteomic profiling of other peanuts allergen in high oleic-acid peanuts still remain unknown.
Mass spectrometry has become a powerful analytical technique for identification and quantitation of proteins and peptides in almost all application settings due to its sensitivity, diminished matrix interference and accurate molecular mass determination. When coupled with tandem mass spectrometry (MS/MS) approach, it produces complete sequence information of hydrolyzed peptide fragments. Along with peptide database searching software, allows for unambiguous identification of the original protein. Several different types of MS instruments and their combinations have been utilized to characterize peptide biomarkers for major peanut allergens and allergen proteomic experiments, many of which have employed quadrupole (Q)/time-of-flight (TOF) or linear ion trap(LTQ) technique for peptide identification and triple-quadrupole for quantitation of target protein [18-20]. In contrast, the Orbitrap is a relatively new type of high-resolution bench-top mass spectrometer,in which ions are trapped in an electrostatic field and the massto-charge ratio of ions can be measured from the frequency of ion oscillations. Orbitrap Fusion combines quadrupole, ultrahigh field Orbitrap and linear ion trap mass analyzer, which allows for versatile modes for sample analyses [21]. To the best of our knowledge,utilization of Orbitrap technology in identification and quantitation of target allergens has yet to be established. In this study, we reported a feasible approach for proteome analysis using in-get tryptic digest followed by mass spectrometry analysis on an Orbitrap Fusion mass spectrometer. With the optimized tryptic digest and instrumental method, we have identified all major allergen peanut proteins on a RP C18column in a single 1 h LC-MS run. Allergen profiling of three different high-oleic acid peanut cultivars were evaluated, and three potential peptide markers for identification and quantitation of peanut allergen in high-oleic peanuts were reported. Our study has provided a versatile method for allergen proteomic analysis and semiquantitation of allergens in high-oleic acid peanut cultivar, which lays the groundwork for studying peanut sensitization in China.
2. Materials and methods
2.1 Chemical and Reagents
Representative high oleic-acid peanut cultivars: Jihua 13 (JH 13),Jihua 16 (JH 16) and Jihua 18 (JH 18) used in this study were obtained from Hebei Academy of Agricultural Science (China).Acetone was purchased from Taicang Hushi Reagent Co., Ltd.(Taicang, China). NaOH and NaCl were purchased from Macklin Biochemical Technology Co., Ltd. (Shanghai, China) and Modern Oriental Technology Development Co., Ltd. (Beijing, China),respectively. Tris-HCl powder, SDS-PAGE loading buffer(2 ×, with dithiothreitol (DTT)), protein staining buffer, precastgel running buffer for SDS-PAGE, 8%-20% precast gel(81 mm × 74 mm × 1.5 mm width) and BCA protein assay kit were obtained from Solabio Science & Technology Co., Ltd. (Beijing,China). Methanol and acetic acid were purchased from Macklin Biochemical Technology Co., Ltd. (Shanghai, China). Precision plus protein electrophoresis standards was purchased by Bio-Rad Laboratories, Inc. (Shanghai, China).
2.2 Physiochemical properties of peanut
For each high oleic-acid peanut cultivar, peanuts were dulled, skin of peanut kernels were removed and the kernels were crushed using a blender (Zhejiang Ronghao Industry & Trade Co., Ltd., Jinhua,China) at 5 000 r/min for 120 s, until the mixture became a thick paste. Approximately 2 g peanut paste was added to the porcelain crucibles, which had been heated to reach a constant weight. Samples were carbonized at 600 °C for 4 h until they were smokeless in an electric furnace. The constant weights after carbonizing were recorded for analysis.
Crude fat determination was performed by using Soxhlet method for fat extraction procesure. Crushed peanuts (approximately 5 g)was added into a round bottom flask. Dry petroleumether (90 mL)was added into the flask, before assembling the Soxhlet extraction unit over a water bath. Extraction mixture was heated at 60 °C until it boils and the mixture was refluxed for 2 h. Petroleum ether was removed by evaporation. The extraction unit was dissembled and the flask was heated in an oven at 102 °C until a constant weight was reached. Flask and contents were weighted and measurements were recorded, expressed as percent crude fat was calculated using the equation below:

where,m1is the weight of the empty flask (g),m2is the weight of the flask and extracted fat (g),m0is the weight of sample (g).
Protein content in peanut was test using BCA protein assay kit. Accurately weigh 0.05 g sample and dissolve it in 2 mL PBS solution. 20 µL dissolved sample was added into a 96-well plate,then added 200 µL Coomassie Brilliant Blue G250 solution and reacted for 5 min in the dark to develop color. The absorbance of each well was measured at 595 nm on a UV-Vis spectrometer (Tecan(Shanghai) Trading Co., Ltd., Shanghai, China). Standard curve with concentration of 0, 0.05, 0.1, 0.15, 0.2, 0.3, 0.4, 0.5 mg/mL was made by using BSA standard product. Sample concentration was calculated according to the standard curve. Ash, fat and protein content for each peanut cultivar were measured in triplicate.
2.3 Peanut allergen extraction
Raw peanuts were dehulled. Skin of peanut kernels was removed.The kernels were crushed using a blender (Zhejiang Ronghao Industry &Trade Co., Ltd., Jinhua, China) at 5 000 r/min for 120 s, and the resulting paste was degreased with acetone (1:10,m/V) at 4 °C for 4 h. Following, acetone-peanut mixture was subjected to centrifugation at 7 800 ×gfor 30 min at 4 °C. Each sample was degreased twice to remove access fat. 10 g defatted peanut extract was solubilized in 100 mL of buffer (50 mmol/L Tris-HCl, pH 8.0)containing 1 mol/L NaCl. The mixture was homogenized by highspeed shear at 9 000 r/min, and then magnetically stirred at 4 °C for 4 h to extract proteins. The remaining mixture was subjected through vacuum filtration, pH of the filtrate was adjusted to 8.0 before lyophilization to obtain crude peanut protein powder.
2.4 SDS-PAGE analysis
Extracted crude protein extract from each peanut cultivar was analyzed using SDS-PAGE using a DYY-6C PowerStation (Beijing Liuyi Biological Technology Co., Ltd., Beijng, China) on 8%-20%acrylamide precast gels (15 cm × 10 cm). Protein extraction were mixed in a 1:1 (m/V)ratio with 2 × loading buffer (10 µL), and were subsequently denatured at 100 °C for 5 min. The mixture was centrifuged at 10 000 ×gfor 2 min using a benchtop centrifugation(Changsha Pingfan Instrument Co., Ltd., Changsha, China).Samples of 30 µL were loaded on the gel; the gels were stained with Coomassie Brilliant Blue R-250 dissolved in destaining solution.The resulting gels were scanned on a Clinx GenoSensCapture system(Clinx Science Instruments Co., Ltd., Shanghai, China).
2.5 In-gel tryptic digest
SDS-PAGE gel containing protein-of-interest was diced into 1 mm3pieces, the individual gel pieces were placed into 0.65 mL siliconized tubes (PGC Scientific, USA). Following, disulfide bond within proteins were reduced with 25 mmol/L DTT and alkylated with 55 mmol/L iodoacetamide. In-gel digestion was performed using sequencing grade-modified trypsin in 50 mmol/L ammonium bicarbonate at 37 °C overnight. The resulting peptides were extracted twice with 1% trifluoroacetic acid in 50% acetonitrile aqueous solution for 30 min. The peptide extracts were then subjected to a SpeedVac (Hunan Herexi Instrument & Equipment Co., Ltd.,Changsha, China) to reduce the volume.
2.6 Quantification of peanut allergen using mass spectrometry
For LC-MS/MS analysis, digested protein were separated on an analytical reverse phase fused silica capillary column (75 µm ×150 mm; Upchurch, Oak Harbor, WA) packed with C18resin(5 µm; Varian, Lexington, MA) using a Thermo-Dionex Ultimate 3000 HPLC system which was directly interfaced with the Thermo Orbitrap Fusion mass spectrometer. Mobile phase A contained 0.1% formic acid in de-ionized water, and mobile phase B consisted of acetonitrile and 0.1% formic acid. Digested proteins were separated using a 60 min gradient elution program at a flow rate 0.300 µL/min with a Thermo-Dionex Ultimate 3000 HPLC system,which was directly interfaced with the Thermo Orbitrap Fusion mass spectrometer. The Orbitrap Fusion mass spectrometer was operated in the data-dependent acquisition mode using Xcalibur 3.0 software,with a single full-scan mass spectrum in the Orbitrap (m/z350-1 550,120 000 resolution) followed by 3 s data-dependent MS/MS scans in an ion routing multipole at 30% normalized collision energy (higher energy collision induced dissociation, HCD). The MS/MS spectra from each LC-MS/MS run was searched against the selected database using proteome discovery algorithm (version 1.4).
2.7 Statistical analysis
Identification of putative allergenic proteins isolated from high oleic acid peanut cultivars and their potential peptide markers was based on UniProt (http://www.uniprot.org) and Allergen Peptide Browser (APB, www.allergenpeptidebrowser.org), respectively.Crude protein extraction, in-gel tryptic digest for mass spectrometry analysis, as well as peptide filtering and evaluation analyses were performed in triplicates to ensure the accuracy and reproducibility of the data.
3. Results and discussions
3.1 Physicochemical properties of high-oleic acid peanuts
Table 1 shows the main composition of each peanut cultivar.Although varies slightly in different peanut cultivars. Chinese higholeic acid peanuts generally contained about 22% (m/m) protein. JH 13 contained 21.95% (m/m) protein, which was the highest among the selected peanut cultivars, while JH 16 and JH 18 contained 21.75%(m/m) and 20.60% (m/m) protein content, respectively. The fat content in JH 13 and JH 18 was 49.94% (m/m) and 49.95% (m/m),respectively. JH 16 contained slightly more fat than the first two,at 54.75% (m/m). Although fat content within high oleic cultivars was roughly the same as that of conventional cultivars, both at about 50%, their fatty acid composition was very different from conventional peanuts.
Nearby the female eagle there was a dead rabbit, which became the prey3 of the male eagle before the mountain was covered with the snow. Now this prey, which sustained the family of four for ten days, had turned into a skeleton from which all the blood and flesh was taken out. At the end of that short day, which seemed like a long life, the female eagle still couldn t see her husband come back, obviously feeling that one baby eagle, who scrunched4 up under her lukewarm feathers, became increasingly ice-cold.
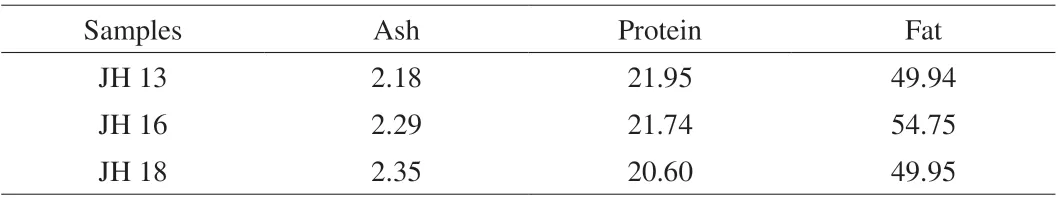
Table 1 Main compositions of 3 high oleic-acid peanut samples (%, m/m).
Table 2 shows the fatty acid composition of three Chinese higholeic acid peanut cultivars selected. Oleic acid (C18:1), palmitic acid (C16:0) and linoleic acid (C18:2) were the major fatty acids present in high oleic peanuts and the remaining fatty acids, stearic(C18:0), arachidic (C20:0), behenic (C22:0), eicosapentaenoic acid(C20:5), eicosenoic (C20:1) also presented in high-oleic acid peanuts.The oleic acid content in high-oleic peanuts was 80.1%-81.2%,yet conventional peanut cultivars typically contained roughly 41.3%-59.1% [6]. The linoleic acid was 3.2%-3.9% in high-oleic peanut, which was around 21.8%-35.2% in conventional peanut cultivars. Oleic/linoleic (O/L) ratios were 24.4:1, 20.5:1, 24.7:1 for higholeic acid JH 13, JH 16 and JH 18, respectively. The oleate trait of selected Chinese high oleic cultivars in this study was in agreement with previous published reports [6,22]. High-oleic peanut is readily distinguished from the conventional peanuts due to the varied oleic and linoleic acids profiles. The content of various fatty acids in the 3 high-oleic peanuts was roughly the same, which varied significantly from the conventional varieties. A high O/L ratio in high-oleic acid cultivars contribute to an increased shelf life,improved flavor and other benefits when compared to conventional peanuts (with O/L ratio ~1.5:1).
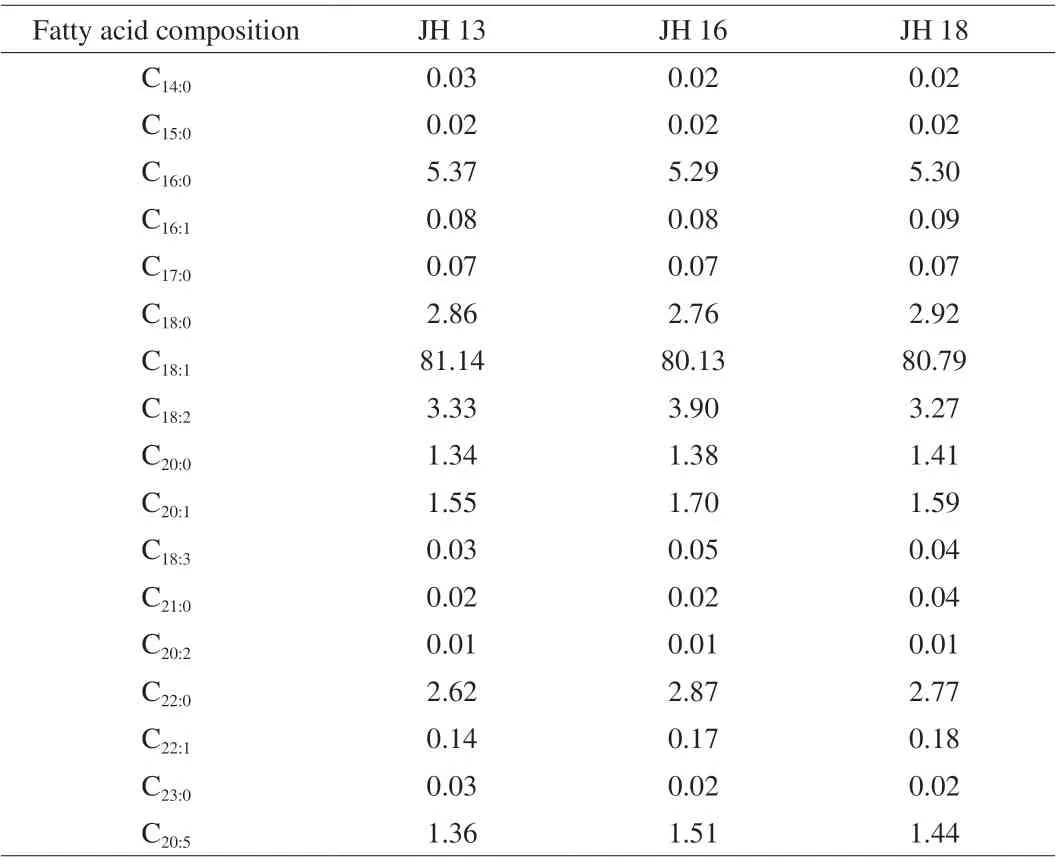
Table 2 Fatty acid composition in 3 high-oleic peanut samples (%).
3.2 SDS-PAGE analysis
To investigate the protein profiles of 3 high oleic-acid peanuts selected, the peanut protein extracts were analyzed by SDS-PAGE.As shown in Fig. 1, up to 13 protein bands of different molecular weight were presented in the crude protein extracts. Distribution of allergen proteins in all 3 high-oleic acid peanut cultivars selected in this study have some similarities, except that protein bands of JH 18 were fainter than those of JH 13 and JH 16; also, allergen proteins,such as Ara h 2 and Ara h 6 were missing from JH 18. All major bands including the monomeric form of Ara h 1 (65 kDa), Ara h 2 subunits (17 and 19 kDa) and Ara h 6 subunit (15 kDa), were visible and appeared to be similar in all samples. For JH 13, the relative concentration of the main allergenic proteins Ara h 1, Ara h 2, Ara h 6 was in a descending order, which was the same as that of JH 16. As for JH 18, Ara h 1 showed the highest content of all allergenic proteins, and the bands of Ara h 2 and Ara h 6 monomer presented at lower concentrations.
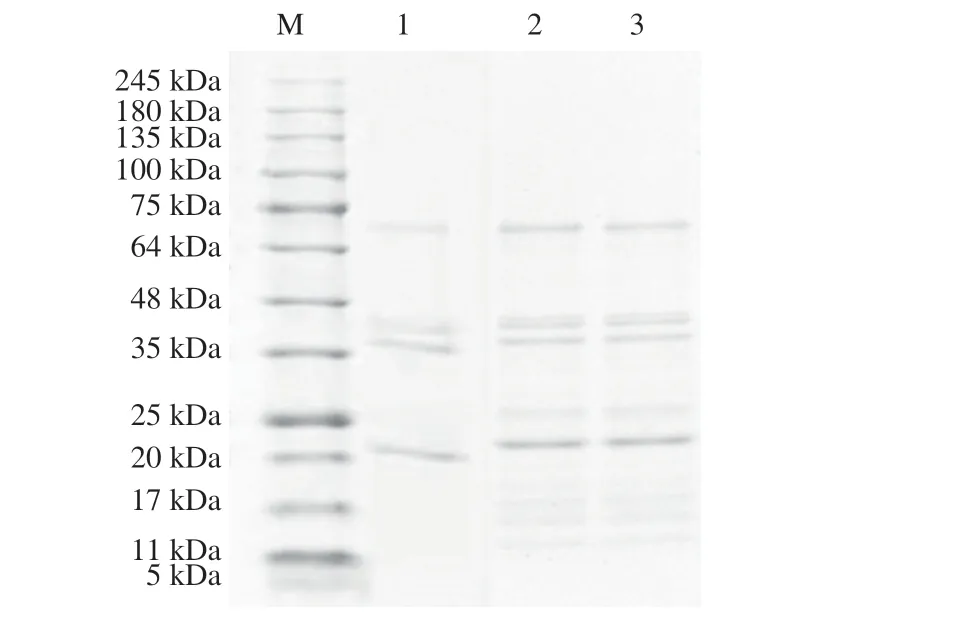
Fig. 1 SDS-PAGE analysis for three high oleic-acid peanut protein extracts.Lane M, marker proteins (indicated at left); lane 1, Tris-HCl (pH 8.0) extract from JH 18; lane 2, Tris-HCl (pH 8.0) extract from JH 13; lane 3, Tris-HCl(pH 8.0) extract from JH 16. Samples analyzed were equal in concentration.
3.3 Development of MS-based proteomics and marker peptide-filtering pipeline
In bottom-up proteomics, peptides serve as surrogates for proteins.Therefore, to develop a robust and versatile MS method for sensitive detection of target peanut allergens in different food matrices, a robust MS method to separate and identify digested peptides, as well as a comprehensive analysis pipeline to identify potential peptide markers are crucial. Previously, a number of researchers made general guideline for MS-based target peptide selection, therefore, based on these guidelines and in combination with peptides isolated from higholeic acid peanut allergen proteins in our study, we have summarized a comprehensive peptide filtering pipeline that we utilized in the identification of potential peptide markers in Fig. 2 [23,24].
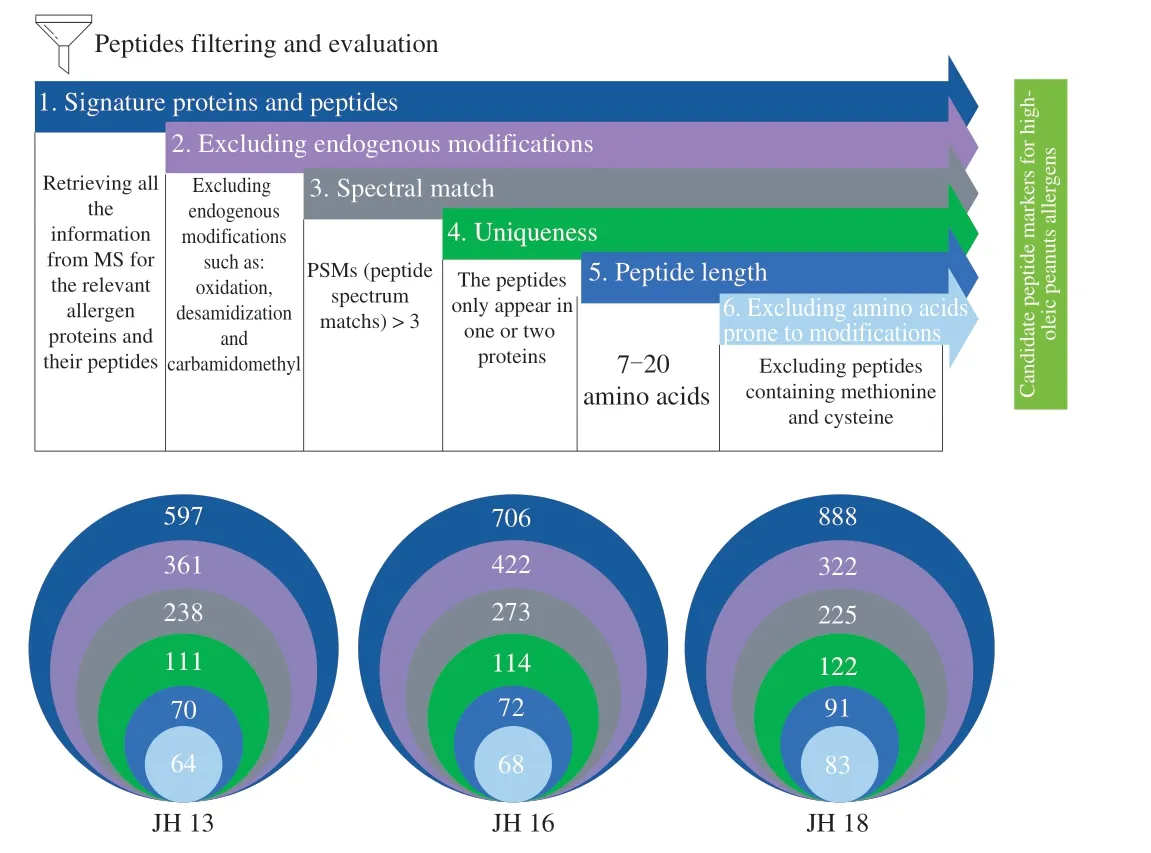
Fig. 2 A comprehensive high-oleic peanut proteomic peptide-filtering pipeline. Analytical workflow describing step-by-step the critical evaluation of the proposed peptide markers to compile a list of highly reliable signature peptides for high-oleic acid peanuts. Each criteria was applied in a sequential order. Number in parentheses indicate the number of peptide left after the given criterion was applied.
MS/MS data was collected using a discovery-based experiment,with an accurate Orbitrap Fusion MS. A discovery analysis of three selected Chinese high-oleic acid peanut cultivars was performed, and each cultivar had three separate extraction replicates and MS analysis replicates to ensure the accuracy and reproducibility of results. As shown in Fig. 2, selection of target peptides was made on the basis of the six following criteria: 1) identification of allergens and its subunits; 2) elimination of endogenously modified peptides; 3) quality of spectral matches; 4) sequence uniqueness; 5) peptide length;6) special amino acids.
3.4 Investigation of the allergen protein profiles in three high oleic-acid peanuts
MS-based proteomics was performed on extracted crude peanut protein to investigate the protein and peptide profiles of three high oleic-acid peanuts. Each ingredient had three extraction replicates and two injection replicates. Overall, a total of 37 009 peptides with different levels of confidence were identified, of which, 31 954 highconfidence (confidence score > 5) peptides were identified in the peanut proteome. Peanut allergens with their isoforms and proteoforms were searched against databases UniProt (www.uniprot.org)to assign peptide identifications to individual protein sequence accession. Among the 31 954 high-confidence peptides, 2 191 peptides were used to identify 59 allergen protein or protein subunits with clear annotation in the peanut proteome (with at least two highconfidence peptides per accession). The remaining 29 763 peptides were either failed to pass the protein inference requirement, or that they were identified from uncharacterized proteins (9 308 peptides from 916 accessions). A total of 11, 8 and 9 allergenic protein groups were identified in three selected high-oleic acid peanut cultivars JH 13, JH 16 and JH 18, respectively. All 3 high-oleic peanuts contain Ara h 1,Ara h 2, Ara h 3, Ara h 6, Ara h 8 and Ara h 10, within which, Ara h 1,Ara h 2, Ara h 3 and Ara h 6 are highly sensitized allergenic proteins.As shown in Table 3, Ara h 1 is a homotrimeric glycoprotein composed of three identical monomers connected under hydrophobic interaction [25]. N1NG13, Q6PSU3, Q6PSU4, Q6PSU6 and P43238 were found within the subunits of Ara h 1. The purified Ara h 1 contained similar subunits in JH 13 and JH 16, other than that JH 16 had one more Q6PUS4 subunit than JH 13. While JH 18 contains subunits P43238, Q6PSU3, Q6PSU6. Ara h 2 is also a glycoprotein,which is one of the most important peanut allergens [26]. It contains two genetic variants: Ara h 2.01 and Ara h 2.02 [27]. A0A445BYI5 and Q6PSU2 exists in Ara h 2 and Q6PUS2 is an important subunit containing different isoforms such as Ara h 2.0101 and Ara h 2.0201.Both A0A445BYI5 and Q6PSU2 existed in all three high-oleic peanuts. Ara h 3 is a hexameric globulin formed by head-to-head combination of two trimers [28]. A1DZF0, A0A445CPR7, Q6T2T4,B5TYU1, Q9FZ11, Q6IWG5, O82580, Q647H3, A0A445CPS9,E5G077 are subunits of Ara h 3. As shown in Table 3, the subunits of Ara h 3 in JH 16 appeared to be the most diverse, which contained most of the reported subunits. Ara h 6 is a lectin, which has 59%homology with Ara h 2 and their properties are very similar [29]. Ara h 6 is a monomer with only one subunit of A5Z1R0. Ara h 4 was not found in JH 13 but in both JH 16 and JH 18. Ara h 7 and Ara h 15 were not found in JH 18 but in other two peanuts. Although JH 18 contained less allergenic proteins as compared with the other two cultivars, the protein concentration presented in JH 13 and JH 16 was higher. In sum, 3 Chinese high-oleic acid peanut cultivars selected all contained highly allergenic proteins Ara h 1, Ara h 2, Ara h 3 and Ara h 6,but the overall allergenic protein profiled varied greatly.
Table 4 shows the distribution of allergenic proteins in three selected high-oleic peanuts. The distribution of allergen protein content in 3 high-oleic varieties was different from that in conventional peanuts. Previous researches showed that in conventional peanut varieties, Ara h 1 accounted for about 12%-22%(m/m) of allergen proteins, while Ara h 2 and Ara h 6 accounted for 5%-9% (m/m). Ara h 3 is the major peanut allergen, which takes up to 82% (m/m) of total allergen, and the remaining allergen protein account for less [30]. In 3 Chinese high-oleic peanuts selected, there was no significant difference in the contents of Ara h 1 and Ara h 3 between selected peanut and conventional peanut. However, Ara h 2 was below 0.4% (m/m), which was a fold less as compared to the conventional cultivars. The reason for the decrease in Ara h 2 content may due to that the MS for response of Ara h 2’s subunits(A0A445BYI5, Q6PSU2) and Ara h 6’s subunit (A5Z1R0) were particularly low and an internal standard maybe required for accurate quantitation of Ara h 2 and Ara h 6.
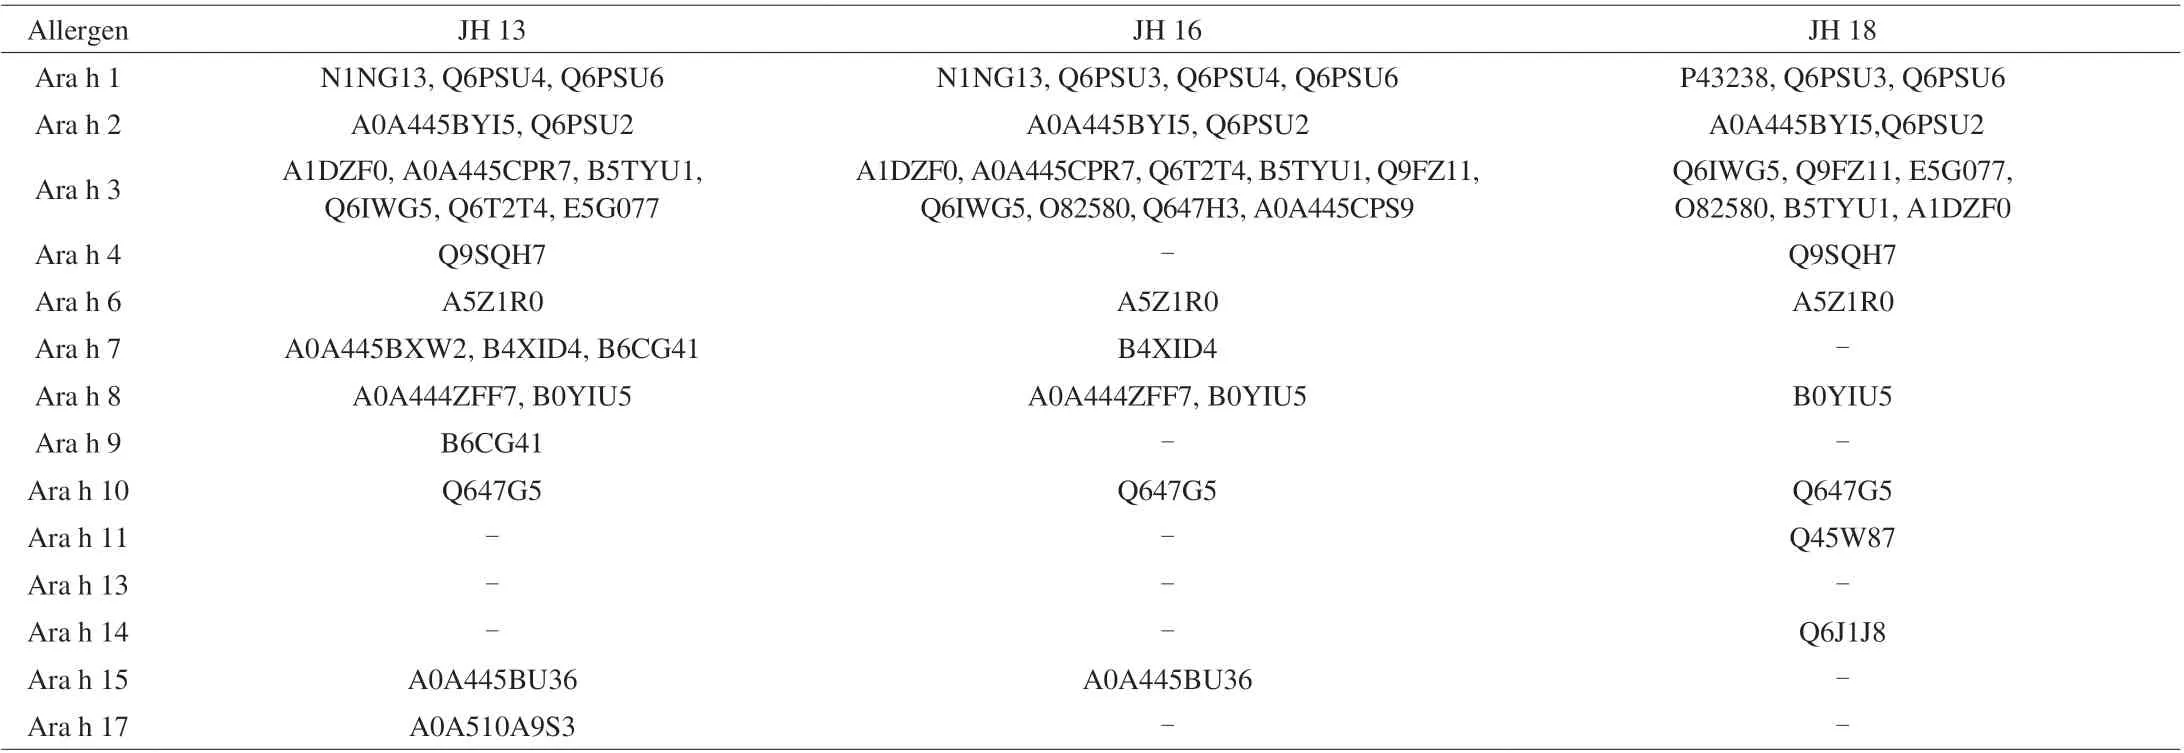
Table 3 Allergen proteins and their subunit’s UniProt accession number isolated in 3 high-oleic peanut samples.
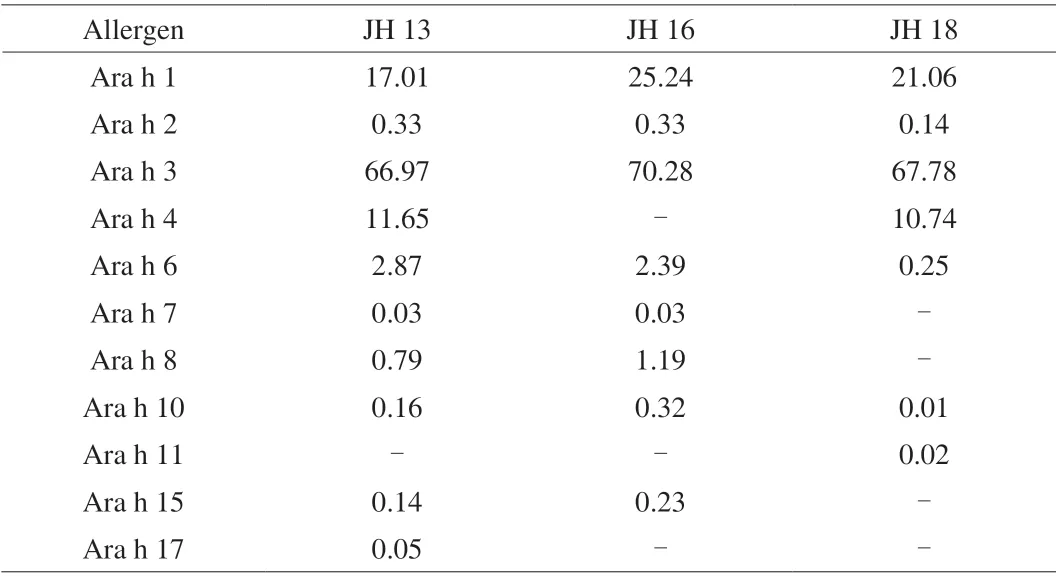
Table 4 Allergen protein content of three high-oleic peanut samples (%).
3.5 Marker peptide selection
To select proteins derived from allergens, we collected all information retrieved from MS and filtered through to select targeted allergen protein based on UniProt (www.uniprot.org) (Step 1 in the peptide-filtering pipeline). However, many amino acids within selected peptides were endogenously modified. For example, aspartic acid and glutamine is often deamidated, and cysteine is prone to acylation. To avoid the effect of endogenous modifications, the second step was to eliminate peptides with endogenous modifications, such as oxidation,desamidization and carbamidomethyl (Step 2 in the peptide-filtering pipeline). Following, the peptides with peptide spectrum matches(PSMs) higher than three were retained to ensure the method sensitivity of selected peptides (Step 3 in the peptide-filtering pipeline). As the forth step of the peptide-filtering pipeline, starting from the refined list of peptide markers, we selected peptides that only appeared in one or two protein(s) to avoid false positive results (Step 4 in the peptide-filtering pipeline). Subsequently, the peptide segment length within 7-20 amino acid, were selected, peptide specificity,ionization yield and reproducibility requirements (Step 5 in the peptide-filtering pipeline). Finally, as the last step of the analytical workflow, peptides containing methionine (M) and cysteine (C)were excluded to yield the final list of potential peptide markers for allergenic proteins (Step 6). To avoid methionine containing peptides as analytical targets ensures robustness of the method, mainly due to such residue are highly prone to oxidation. As for cysteine, most digestion protocols include a reduction/alkylation step (mainly based on dithiothreitol and iodoacetamide), which is designed specifically to break disulfide bonds and block cysteine residues by carbamidomethylation irreversibly. To avoid source of uncertainty,cysteine-containing peptides were excluded preferentially unless the reliability of the peptides was duly assessed experimentally.
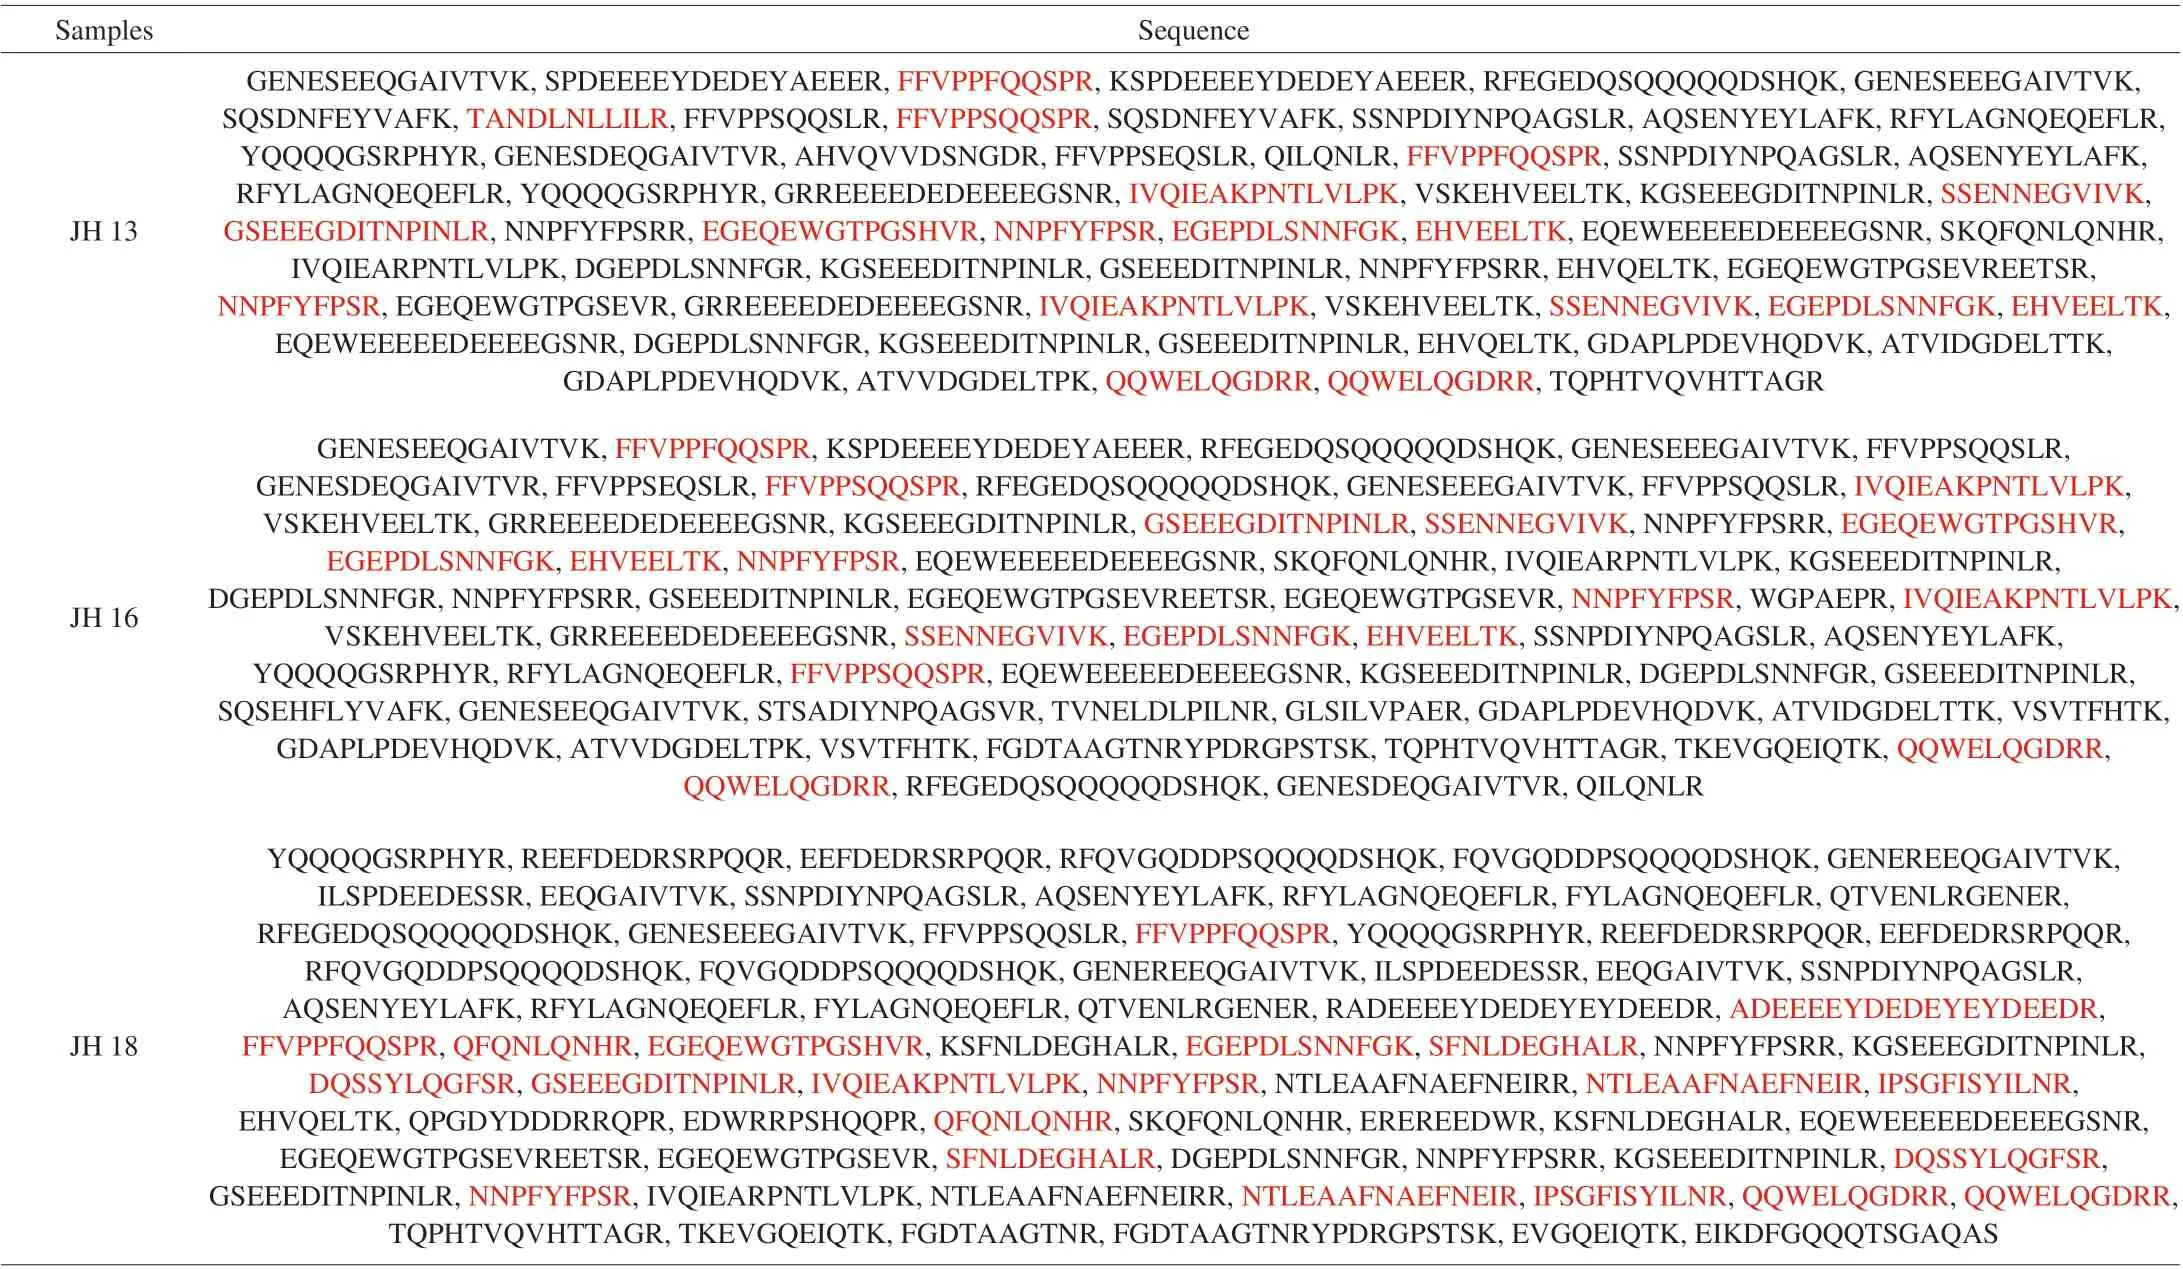
Table 5 Selected peptide markers for the detection allergens in high-oleic peanut samples.
3.6 Selection of potential target peptides for allergenic protein identification
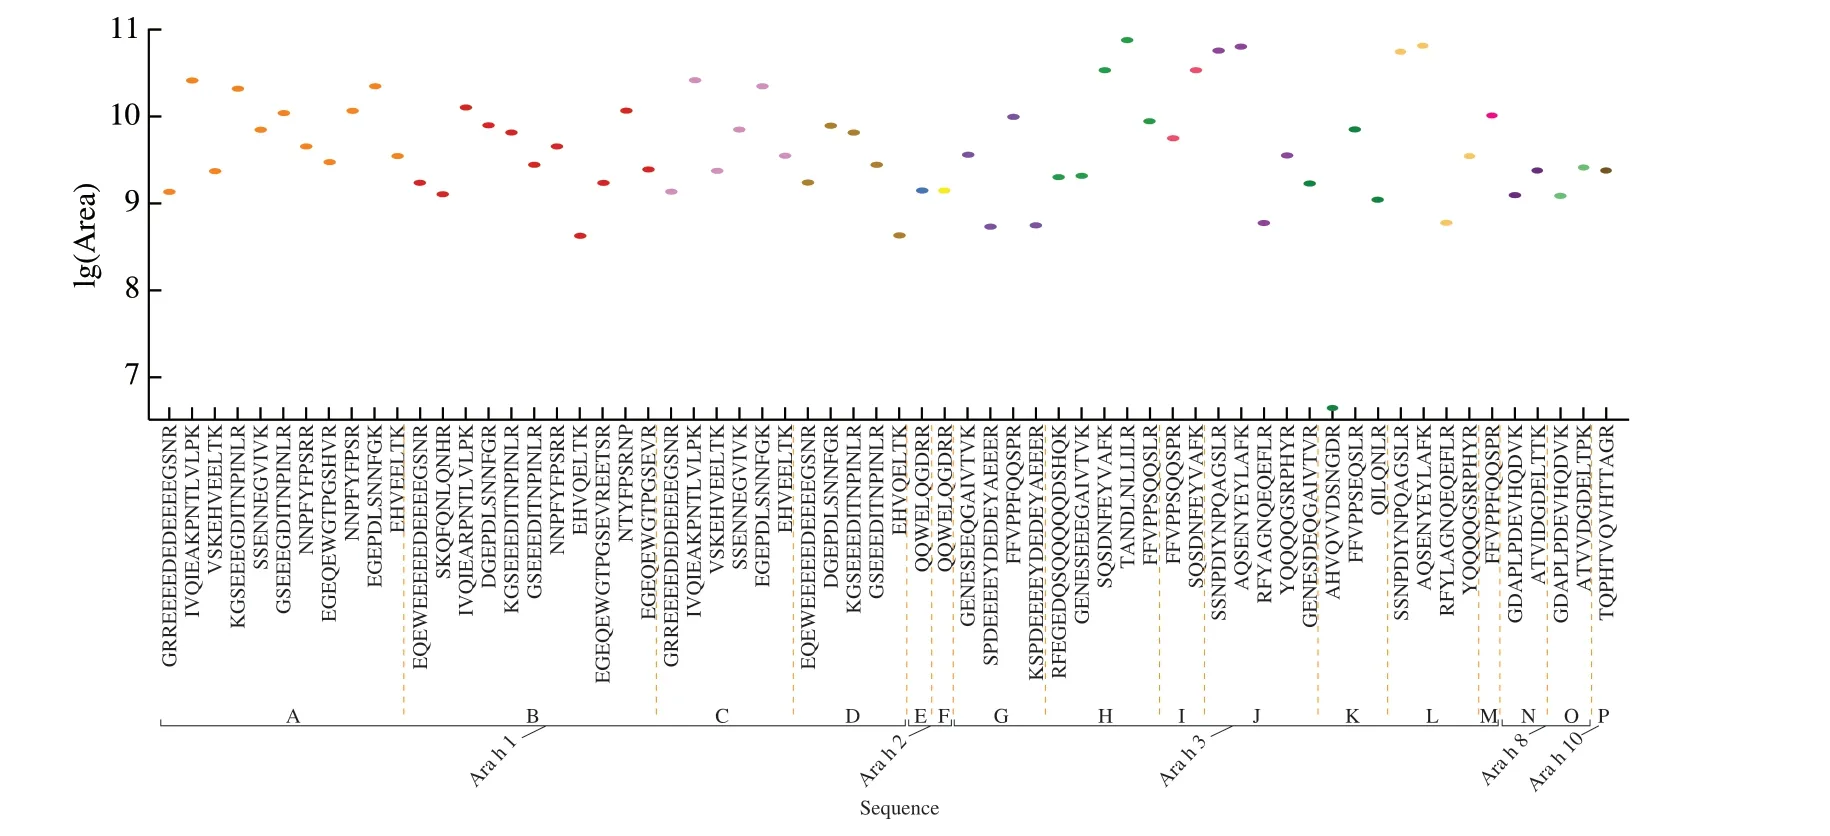
Fig. 3 Relative abundances of selected peptides in JH 13 (extractions analyzed in triplicate by MS). Mean peptide peak area was converted to logarithm values.A-P represent UniProt accession number of different subunits in proteins. A, N1NG13; B, Q6PSU3; C, Q6PSU4; D, Q6PSU6; E, A0A445BYI5; F, Q6PSU2;G, A1DZF0; H, A0A445CPR7; I, B5TYU1; J, Q6IWG5; K, Q6T2T4; L, E5G077; M, Q9SQH7; N, A0A444ZFF7; O, B0YIU5; P, Q647G5 (different colors represents different subunits).
As shown in Fig. 2, through the peptide-filtering pipeline, after filtering through allergenic proteins, there were 64, 68, 83 peptides selected as potential target peptides in JH 13, JH 16 and JH 18,respectively. The selected peptide markers in each peanut cultivar were listed in Table 5, which were searched against peptide markers that had been reported in APB (www.allergenpeptidebrowser.org) [31].APB is an interactive database that allows peptide selection for targeted selected reaction monitoring (SRM)/multiple reaction monitoring (MRM) experiments using an aggregation of mass spectrometry data published in the field of food allergen detection.As seen in Table 5, the selected marker peptides marked red were collected by APB.
Although current sample preparation and MS-based protocol that have identified allergen proteins: Ara h 1 (7S-globulin, vicilintype), Ara h 2 (2S albumin, conglutin), Ara h 3 (11S globulin,glycinin, legumin-type), Ara h 6 (2S-albumin, conglutin), and Ara h 7(2S-albumin, conglutin), Ara h 8, Ara h 10 and Ara h 11 in higholeic acid peanuts, since APB only lists peptide markers identified in Ara h 1, Ara h 2, Ara h 3, Ara h 6 and Ara h 7, identified peptides were searched against peptides reported on APB and peptides that have already been reported were marked red in Table 5. The fact that our method has confirmed previously reported peptide markers proves the reliability and reproducibility of our method. More importantly,Table 5 has also listed novel peptide markers in Ara h 1 and Ara h 3,Ara h 8, Ara h 10 and Ara h 11 within each high-oleic acid cultivar that had not been reported previously and could potentially utilized as peptide markers.
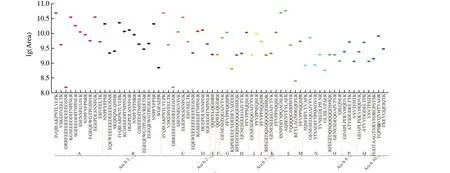
Fig. 4 Relative abundances of selected peptides in JH 16 (extractions analyzed in triplicate by MS). Mean peptide peak area was converted to logarithm values.A-R represent UniProt accession number of different subunits in proteins. A, N1NG13; B, Q6PSU3; C, Q6PSU4; D, Q6PSU6; E, A0A445BYI5; F, Q6PSU2;G, A1DZF0; H, A0A445CPR7; I, Q6T2T4; J, B5TYU1; K, Q9FZ11; L, Q6IWG5; M, O82580; N, A0A445CPS9; O, Q647H3; P, A0A444ZFF7; Q, B0YIU5;R, Q647G5 (different colors represents different subunits).
Fig. 3 showed the abundance of peptide markers in JH 13. There are 64 peptides identified from 16 protein subunits in Ara h 1, Ara h 2,Ara h 3, Ara h 8 and Ara h 10. The abundance of most peptide markers was 9-10.5, and there was only one peptide (AHVQVVDSNGDR) from Ara h 3 (Q6T2T4) with an abundance of 6.63.
Previously, proteins Ara h 4 (Q9SQH7), Ara h 8 (B0YIU5) and Ara h 3 (Q647G5) had been reported in the literature [32]. These subunits were also highly responsive under MS conditions reported in this experiment, with MS scores of 4 258.8 for Q9SQH7, 92.1 for B0YIU5 and 42.0 for Q547G5. In these proteins, peptides such as FFVPPFQQSPR in Q9SQH7 (marked red in Table 5)have been reported. PSMs referred to the number of spectra in the library that match the amino acid sequence. The higher the PSMs,the more reproducible and reliable the identified peptides are.Current analytical method has achieved reproducible, reliable and sensitive results. For example, the peptide FFVPPFQQSPR that had been reported previously was also being identified using our current MS method, it had had PSMs of 206, which showed the MS method reported in this study is in an agreement with previously published method, which further proves the feasibility and reliability of the current method. In addition, we also identified additional peptide markers GRREEEEDEDEEEEGSN, VSKEHVEELTK,KGSEEEGDITNPINLR, NNPFYFPSRR, EHVEELTK in Ara h 1.Novel peptide markers in allergen protein Ara h 8 and Ara h 10 had also been identified (Table 5). These novel peptides identified in this method could be used as peptide markers for the detection of peanut allergens. Fig. 4 showed the abundance of peptide markers in JH 16.In total, 68 peptides from 17 subunits were identified. Unlike JH 13,the abundance of peptide markers in JH 16 mostly concentrated within the range of 9-10.5. Peptides such as FFVPPFQQSPR,IVQIEAKPNTLVLPK, GSEEEGDITNPINLR (marked red in Table 5)had been reported on APB. In addition, novel peptide markers such as GRREEEEDEDEEEEGSNR, VSKEHVEELTK from Ara h 1,Ara h 3, Ara h 8 and Ara h 10 that showed similar abundance and responsiveness on MS as previously reported peptides, indicating the reliability of current MS method, which can also be used as potential peptide marker for JH 16.
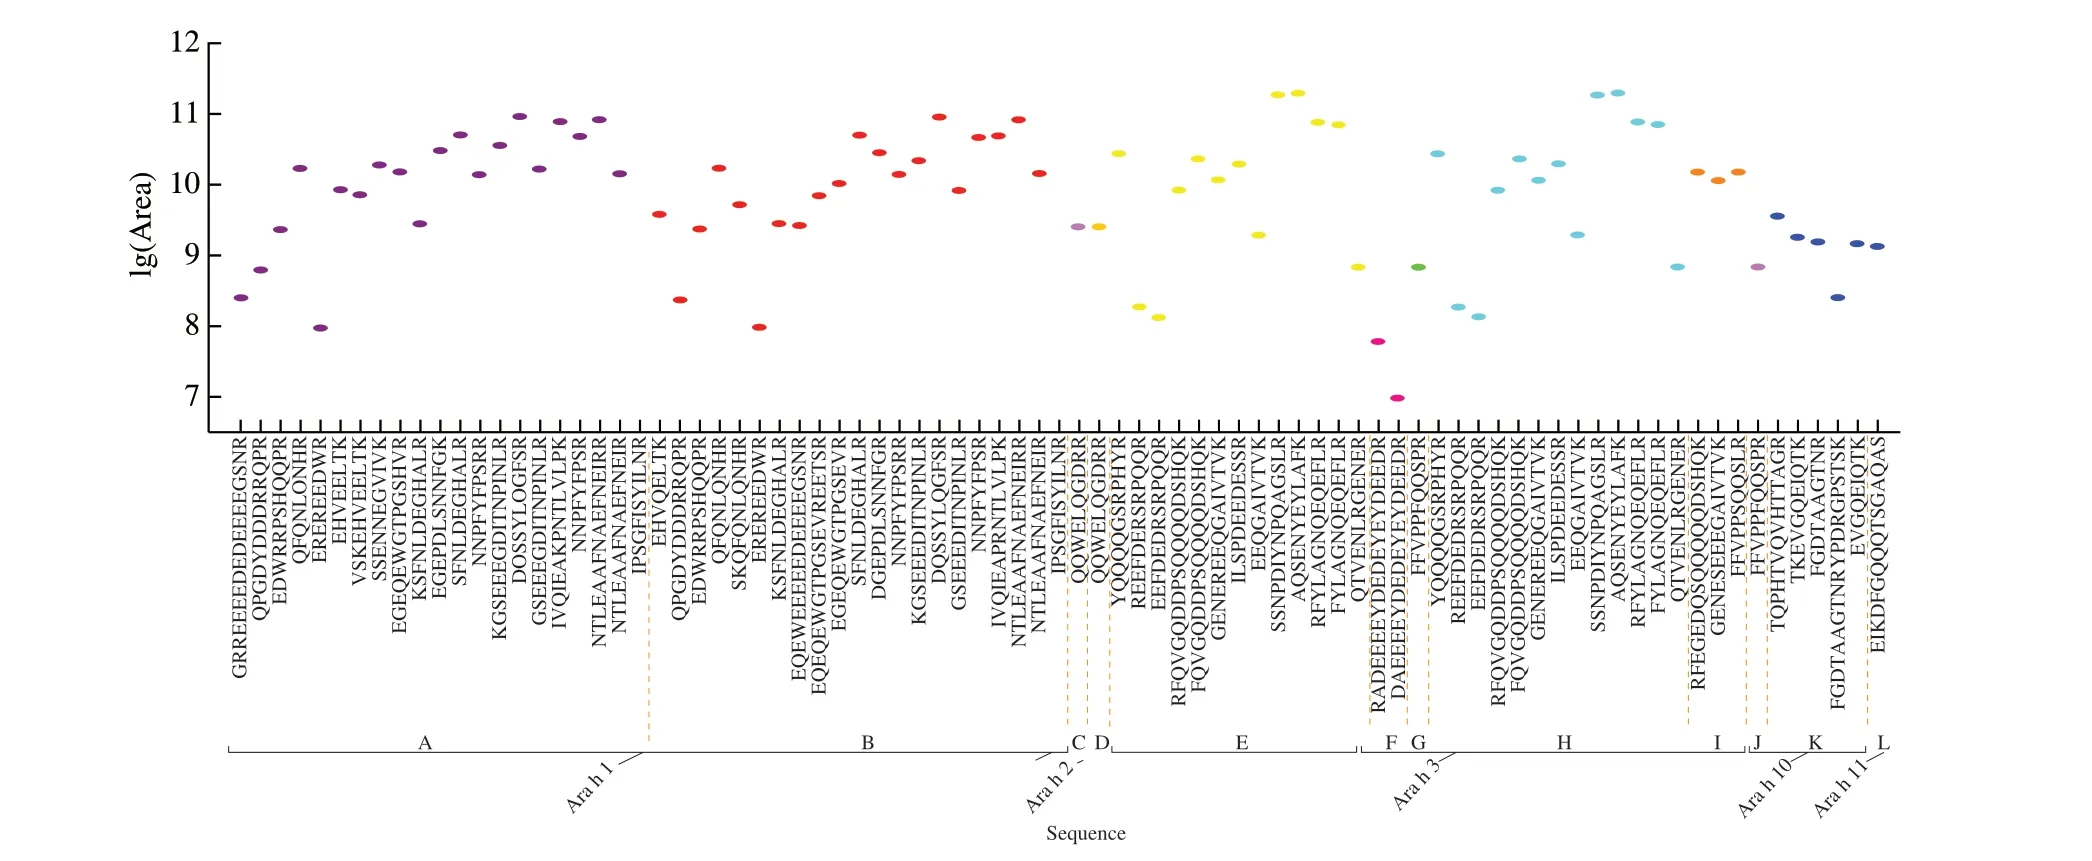
Fig. 5 Relative abundances of selected peptides in JH 18 (extractions analyzed in triplicate by MS). Mean peptide peak area was converted to logarithm values.A-L represent UniProt accession number of different subunits in proteins. A, P43238; B, Q6PSU3; C, Q6PSU2; D, A0A445BYI5; E, E5G077; F, O82580;G, A1DZF0; H, Q6IWG5; I, Q9FZ11; J, Q9SQH7; K, Q647G5; L, Q45W87 (Different colors represents different subunits).
As shown in Fig. 5, there were 83 peptides identified. Same as JH 13 and JH 16, the peptide markers identified in JH 18 were also mostly from allergenic protein Ara h 1 and Ara h 3, with a few additional peptides identified from Ara h 2, Ara h 10 and Ara h 11.Unlike the other two varieties of peanuts, the abundance of peptides isolated from allergenic protein in JH 18 were the lowest, mainly concentrated in 9-11. Of the 42 peptides identified in Ara h 1,18 peptides with high MS response had been reported previously,indicating current MS method and subsequent analysis is sufficient in identifying peptide markers.
The distribution of potential peptide markers in chosen high oleic peanuts was correlated to the distribution of their allergenic protein subunits. When we compared Fig. 3, 4 and 5, it was found that the subunits and peptides isolated and identified in JH 13 and JH 16 had higher repeatability than those of JH 18. Among these proteins and peptides, JH 13 and JH 16 share similar protein profiles since that they both contain allergenic proteins such as Ara h 1, Ara h 2, Ara h 8 and Ara h 10. On the contrary, allergenic protein profile or identified peptide markers for each allergenic protein was quite different in JH 18 from those of the other two cultivars. Further studies are need to examine whether the unique allergenic protein profile that JH 18 correspond to different allergenicity profile. It was worth noting that peptide QQWELQGDRR from Ara h 2 found both in Q6PSU2 and A0A445BYI5 had been identified in all 3 varieties.
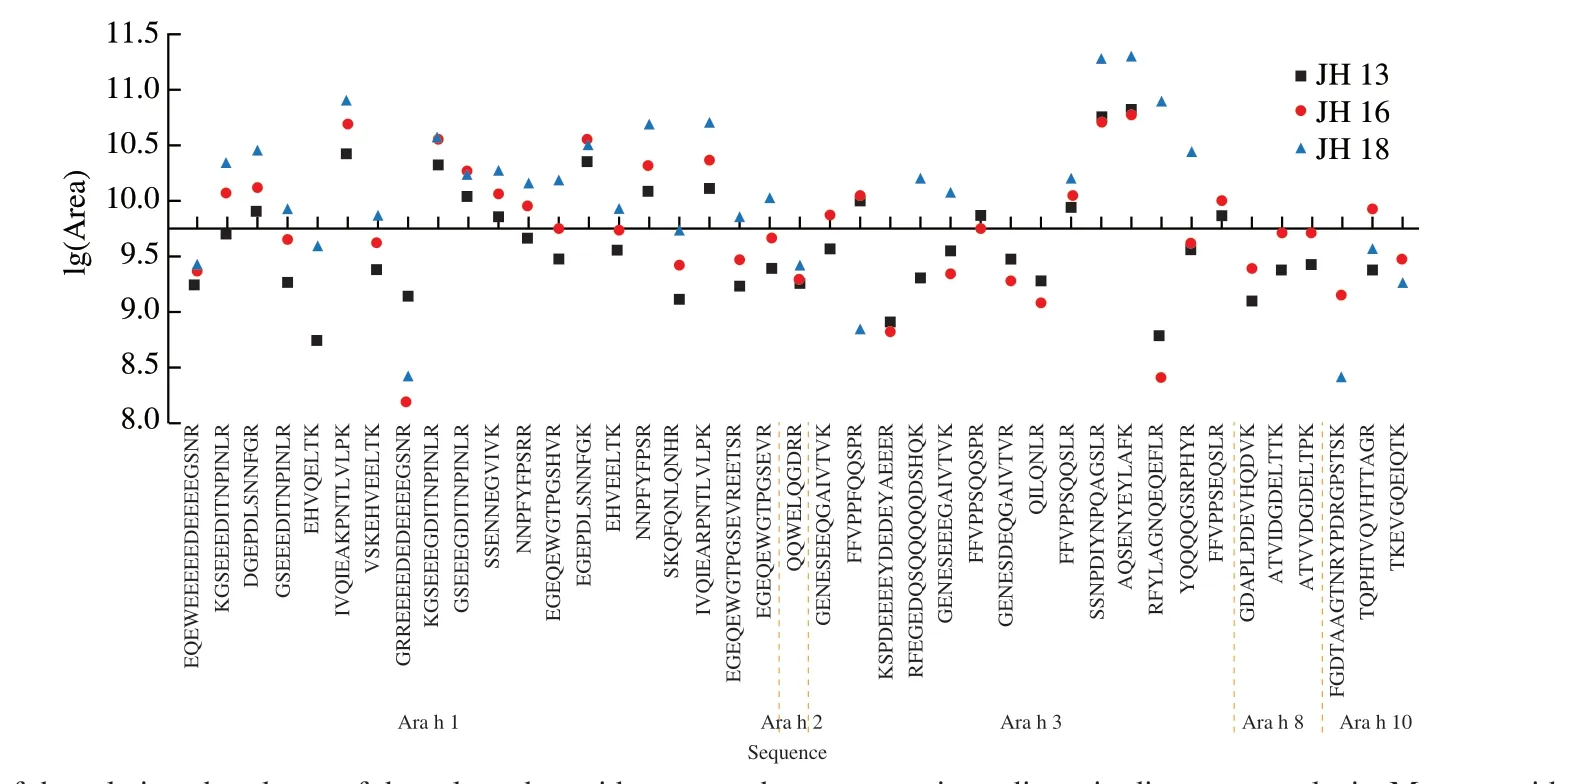
Fig. 6 Comparison of the relative abundance of the selected peptides across three peanuts ingredients in discovery analysis. Mean peptide peak area was converted to logarithm values.
We have identified 41 peptides from Ara h 1, Ara h 2, Ara h 3,Ara h 8 and Ara h 10 that occurred in 3 cultivars of high-oleic acid peanuts, as shown in Fig. 6. Ara h 1 and Ara h 3 had larger molecular weight than the other allergens, therefore more peptides were identified in Ara h 1 and Ara h 3. The abundance of identified peptide markers ranged from 8.0 to 11.5. Among them, the abundance of peptide markers isolated from JH 13 was centered around 8.8-11.0 and those in JH 16 and JH 18 were more scattered. It was found that the abundance of most peptide markers in JH 18 were high, and that of most peptides in JH 13 and JH 16 were similar, mainly between 9.0-10.5.
As mentioned earlier, PSMs value represents the reliability of MS detection and score value represents the abundance of protein subunit. The higher score value, the higher protein subunit abundance. As shown in Fig. 6, three identified peptides IVQIEAKPNTLVLPK, SSNPDIYNPQAGSLR, AQSENYEYLAFK which shared among all three cultivars, showed great MS response:their logarithm value were higher than 10. IVQIEAKPNTLVLPK was derived from Ara h 1 (N1NG13) and the scores of N1NG13 were 2 806.8, 3 360.3, 2 067.9 and PSMs of IVQIEAKPNTLVLPK were 141, 182, 182 in JH 13, JH 16, JH 18, respectively. Both SSNPDIYNPQAGSLR and AQSENYEYLAFK were peptides derived from Ara h 3 (Q6IWG5), and 4 429.6, 2 980.5, 2 890.6 were the scores of Q6IWG5 in JH 13, JH 16, JH 18, respectively,indicating this subunit was found in high concentrations in peanut protein extract. PSMs of SSNPDIYNPQAGSLR were 282, 147, 100 and these in AQSENYEYLAFK were 237, 177, 39 in JH 13, JH 16 and JH 18. In sum, based on the abundance and reproducibility of identified peptides, IVQIEAKPNTLVLPK, SSNPDIYNPQAGSLR,AQSENYEYLAFK identified from Ara h 1 and Ara h 3 can be used as surrogate peptide markers for identification of allergenic protein in Chinese high-oleic peanuts.
4. Conclusions
In this study, we have developed a feasible and robust Orbitrap Fusion-based MS method and target peptide-filtering pipeline for the detection of allergenic proteins in Chinese high-oleic acid peanuts.The allergenic proteins and their subunits of JH 13 and JH 16 share similarity in their allergenic protein profile, while that in JH 18 were different. All selected peanuts with high oleic contain highly allergenic protein Ara h 1, Ara h 2, Ara h 3 and Ara h 6. JH 13 also contained Ara h 4, Ara h 7, Ara h 8, Ara h 9, Ara h 10, Ara h 15,Ara h 17. JH 16 contained Ara h 7, Ara h 8, Ara h 10, and Ara h 15,while JH 18 also contained Ara h 4, Ara h 8, Ara h 11, Ara h 14.Allergenic protein profiles of Chinese high-oleic acid peanut cultivars were very similar to that of conventional peanuts. In high-oleic acid peanuts, two major allergen proteins, Ara h 1 accounted for about 17%-25% of total allergen proteins, Ara h 3 accounted for to 67%-70% of total allergen, and the remaining allergen protein account for less.
Additionally, a comprehensive peptide-filtering pipeline has been developed for identification of potential peptide markers in peanut allergen proteins. The feasibility and reliability of the screening method has also been effectively verified. Through this method, three novel peptide markers, IVQIEAKPNTLVLPK,SSNPDIYNPQAGSLR and AQSENYEYLAFK surrogate to Ara h 1, Ara h 3 and Ara h 3 proteins with high abundance, good MS response and highly reliability were identified, which could be used as candidate peptide markers for the detection of peanut allergens in different food matrices.
Conflict of interest
The authors declare that they have no conflicts of interest (financial or otherwise) exists in the submission of this manuscript.
Acknowledgment
We would like to thank Prof. Haiteng Deng and Xianbin Meng in Proteomics Facility at Technology Center for Protein Sciences,Tsinghua University, for mass spectrometry analysis.
This research has been supported by the China National Key R&D Program during the 13thFive-year Plan Period (2019YFC1605004).
杂志排行

食品科学与人类健康(英文)的其它文章
- The role of probiotics in prevention and treatment of food allergy
- Roles of fermented plant-, dairy- and meat-based foods in the modulation of allergic responses
- The role of gut microbiota and its metabolites short-chain fatty acids in food allergy
- Association of nutrients intake during pregnancy with the risk of allergic disease in offspring: a meta-analysis of prospective cohort studies
- Purif ication and immunoglobulin E epitopes identif ication of low molecular weight glutenin: an allergen in Chinese wheat
- Determination of egg and milk allergen in food products by liquid chromatography-tandem mass spectrometry based on signature peptides and isotope-labeled internal standard