Lattice thermal conduction in cadmium arsenide
2022-11-21ChinnappagoudraKamatagiPatilandSankeshwar
R F Chinnappagoudra M D Kamatagi N R Patil and N S Sankeshwar
1Department of Physics,S.S.Government First Grade College,Nargund-582 207,Karnataka,India
2Research Resource Centre,Visvesvaraya Technological University,Belagavi-590 018,Karnataka,India
3Department of Physics,B V B College of Engineering and Technology,Hubli,Karnataka 580031,India
4Department of Physics&Electronics,CHRIST(Deemed to be University),Bangalore-560 029,Karnataka,India
Lattice thermal conductivity(LTC)of cadmium arsenide(Cd3As2)is studied over a wide temperature range(1–400 K)by employing the Callaway model. The acoustic phonons are considered to be the major carriers of heat and to be scattered by the sample boundaries,disorder,impurities,and other phonons via both Umklapp and normal phonon processes.Numerical calculations of LTC of Cd3As2 bring out the relative importance of the scattering mechanisms. Our systematic analysis of recent experimental data on thermal conductivity (TC) of Cd3As2 samples of different groups, presented in terms of LTC, κL, using a nonlinear regression method, reveals good fits to the TC data of the samples considered for T <~50 K,and suggests a value of 0.2 for the Gruneisen parameter. It is,however,found that for T >100 K the inclusion of the electronic component of TC,κe,incorporating contributions from relevant electron scattering mechanisms,is needed to obtain good agreement with the TC data over the wide temperature range. More detailed investigations of TC of Cd3As2 are required to better understand its suitability in thermoelectric and thermal management devices.
Keywords: dirac semimetals,Cd3As2,thermal conductivity,phonon scattering
1. Introduction
Cadmium arsenide (Cd3As2), a 3D II–V material with a tetragonal crystal structure,is a Dirac semimetal with a characteristic linear dispersion(E=¯hvfk)and is known to possess interesting electronic properties such as high room temperature carrier mobility (μ~107cm2·V-1·s-1), large thermoelectric power(S~600 μV·K-1),high carrier concentration(n~1024m-3),low resistivity(ρ~11.6 nΩ·cm),and low thermal conductivity (κ~10 W·m-1·K-1).[1–7]Consequently, it has attracted a great deal of attention as a probable candidate for various applications in opto-and magneto-electronic and thermoelectric devices.[7,8]The interest in Cd3As2as a promising thermoelectric material arises due to not only its attractive electronic properties but also its very-low thermal conductivity. Recently, a larger-than-unity value for the thermoelectric figure of merit,Z(=S2/ρκ), has been reported for Cd3As2in the presence of a magnetic field.[9–14]However,to obtain a better understanding and a clear perspective of the suitability of Cd3As2in not only thermoelectric devices but also thermal management issues, it becomes crucial and imperative for a detailed study of the property of thermal conductivity(TC)in this technologically important material.
In the presence of a thermal gradient applied across a semiconducting material sample, the heat energy is carried predominantly by the phonons of the acoustic mode,the contribution from the charge carriers is small. Correspondingly,the thermal conductivity (TC) of the material,κ, is due to two contributions, namely,κLfrom the lattice, andκefrom the charge carriers. In general,the TC of a material is known to exhibit a typical temperature dependence: with increase in temperature,the TC at first(forT <~5 K)is found to increase asT3due to phonon-boundary scattering,then reaches a maximumκmaxaroundTmax~0.05ΘDwithΘDbeing the Debye temperature,due to phonon–impurity and phonon–phonon scatterings, and finally at higher temperatures decreases asT-1,owing to dominance of phonon–phonon scattering. Further,in the case of degenerate material samples,κecan become appreciable at higher temperatures.
In literature, there exist a few investigations on the thermal properties of Cd3As2,and most of them are experimental.Among the first experimental reports on TC of Cd3As2is the study of Spitzeret al.[15]In their measurement of the TC,they reported a very low room-temperature value of~2.6 W/m·K–2.9 W/m·K for undoped samples. Another early investigation on TC was the study by Armitage and Goldsmid[16]on different samples over the temperature rangeT~8 K–300 K.They found that, with increasing temperature, the lattice thermal conductivity(LTC)of Cd3As2falls continuously asκL~T-1forT >~10 K,reaching a value of about 1 W/m·K at 300 K,suggesting predominance of phonon–phonon scattering. They have also suggested that a maximum may exist just below 8 K,with imperfection scattering playing a major role at liquid helium temperatures.Combarieu and Jay-Gerin,[17]in their measurement of the specific heat of Cd3As2at low temperatures(1.7 K<T <~30 K),showed that the specific heat is dominated by the lattice contribution. They found a value of 111 K forΘD. Bortkowskiet al.[18]have reported measurements of TC over the temperature range from 4.2 K to 40 K in Cd3As2samples oriented in different crystallographic directions.They found the TC to depict a well-defined maximum around 6 K and to be characterized by anisotropy.Zhanget al.[11]reported the observation of low TC,one order of magnitude lower than the conventional metals or semimetals with similar electrical conductivity. In their analysis of the temperature-dependent TC of undoped Cd3As2, the significant enhancement in TC observed below 50 K is found to follow aT-1dependence,suggesting that phonon–phonon scattering is the main reason for the low value of TC. Recently, Wanget al.[10]reported measurements of the temperature dependence of TC of four Cd3As2single crystals with different carrier concentrations in the presence of a magnetic field. They found that for their four crystal samples in zero magnetic field, as the temperature increases over a wide temperature range (10 K<T <500 K),κfirst decreases rapidly in the low-temperature range,becomes weakly temperature dependent in the intermediatetemperature range,and then increases in the high-temperature range. Pariariet al.,[12]in their study on the effect of magnetic field on validity of the Wiedemann–Franz law,also reported a similar temperature dependence of TC in the Dirac semimetal Cd3As2in zero magnetic field over 20 K<T <350 K. The sharp increase inκthey observed below 50 K also suggests the smaller contribution to the total TC at low temperatures from electronic thermal conductivity (κe). Recently, Yueet al.,[19]using first principles calculations and temperature-dependent high-resolution Raman spectroscopy, described the ultralow LTC of Cd3As2forT >100 K,based on soft-mode-enhanced phonon–phonon scatterings. They ascribed the observed[10]anomalous temperature dependence of TC around 450 K to an interplay between the phonon–phonon Umklapp scattering rates and the soft optical phonon frequency.
So far, there have been only a few reports[20–22]with regard to theoretical investigations of thermal transport properties of Cd3As2. Lundgrenet al.,[21]in their analytical study of the thermoelectric properties of Weyl and Dirac semimetals,used a semiclassical Boltzmann approach to investigate the effect of various electron relaxation processes due to charged impurities, short-range disorder and electron-electron interactions on the electronic contribution to TC. They ignored theκLcontribution from phonons to the TC. Recently, solving the Boltzmann transport equation using an iteration technique,Amarnathet al.[22]studied the temperature dependence ofκeconsidering contributions from various electron scattering mechanisms.Their attempt to explain the TC data of Wanget al.,[10]Zhanget al.[11]and Pariariet al.,[12]in terms of only the electronic contribution could obtain agreement only forT >~100 K.
We note here that these studies indicate that the temperature dependence of TC of Cd3As2exhibits a typical behavior.[10–13]With decrease in temperature fromT~400 K,the TC is found to, at first, show a decreasing trend in the range 400 K>T >200 K,before showing a significant(κ~T-1) increase belowT~50 K, then reach a large value (~50 W·m-1·K-1)near the maximumκmaxaroundT <~10 K,and finally show a decrease for lower temperatures.It may also be noted that in all the samples of Cd3As2referred to above,the decrease of TC from the boundary scattering is not seen down toT~5 K, and has been ascribed to the large crystalline size.[10]Further, there have been theoretical investigations with regard to electronic contribution to TC, and there have not been much attention paid to lattice contribution. In the present work we present a detailed study of LTC of Cd3As2using the Callaway model[23]over a wide temperature range(2 K<T <400 K). Further, taking into account the relevant electron and phonon scattering mechanisms, we analyze the available TC data, in terms of both the components, namely,κLandκe,using a nonlinear regression method,and suggest a value for the Gruniesen parameter. In Section 2, we give the details of the Callaway theory of LTC employed in our study.Our results and discussion are presented in Section 3.
2. Theory
The thermal conductivity of a material,κ, is defined by the relation[23–26]

whereUis the heat flux density in the material produced by the temperature gradient ∇T;κ, in general, is a tensor.As stated above, the total TCκis due to two contributions,namely,the LTC,κL,and the electronic TC,κe:

In literature,different approaches have been used to study the thermal conductivity of materials.[24–31]In the present work,assuming the heat in the material to be transported mainly by the acoustic phonons, we obtain the expression for the lattice contribution,κL, by solving the Boltzmann transport equation for phonons in the relaxation time approximation. The heat transportsvialongitudinal acoustic (LA) and transverse acoustic (TA) phonon modes are quite different and depend on their characteristic frequencies and dispersion.[29–32]The phonon dispersion of Cd3As2shows that LA and TA modes overlap.[19]Due to lack of experimental data on the phonon spectrum for this Dirac semimetal,we do not considered here the individual contributions from the LA and TA modes. Assuming the material to be isotropic, we use the Callaway model which uses Debye approximation and considers the average contribution from the LA and TA modes. In the Callaway model,κLcan be expressed in the form:[23–25]

Here,g(x)=x4ex/(ex-1)2,ΘDis the Debye temperature andH=k4B/(6π2v¯h3), withv-1= [(1/vl)+(2/vt)]/3 denoting the averaged sound velocity.[23]In Eq.(5),τNdenotes the relaxation time for normal (N) phonon processes (N-phonon,N-process) which are non-resistive, andτRis the sum of all resistive (R) processes including those due to Umklapp (U)phonons: (τR)-1=∑i(τi)-1, whereτiis the phonon relaxation time corresponding to theithresistive scattering process.The combined relaxation rate (τC)-1is written as (τC)-1=(τN)-1+(τR)-1.[23–26]
2.1. Phonon relaxation times
In the temperature range of interest (1 K<T <400 K),the flow of heat in a Cd3As2sample is considered to be hindered by the scattering of the phonons,at lower temperatures by the sample boundaries,the various impurities and disorder in it,and at higher temperatures by other phonons,mainlyviathe U-processes.
2.2. Phonon–phonon scattering
The ideal thermal resistance of a material,due to phonon–phonon interactions, arises mainly from the Umklapp threephonon processes.[23–26]However, the N-phonons which do not contribute directly to the thermal resistance, are known to influence the other resistive processes.[30,31]A proper description of the relaxation times for these processes requires a knowledge of the phonon spectrum.[29–31]In literature,different forms for the phonon–phonon relaxation times have been suggested,based on the crystal symmetry and their dependencies onωandT.[30]The phonon–phonon relaxation rates can be expressed as[29–32]
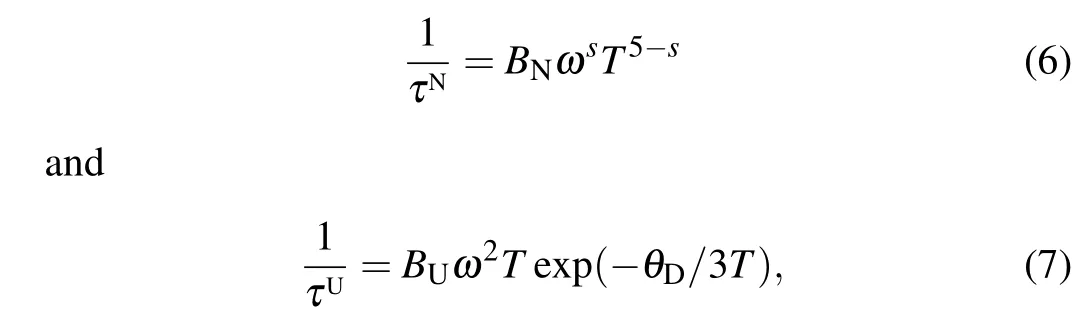
where the scattering coefficientsBNandBU, respectively, characterize the N- and U-phonon–phonon scattering strengths,and are given by[29–31]
Here,Mis the average mass of an atom,V0=a2cits volume,andγis the mode averaged Gruneisen parameter.[30]The value of the exponentsin Eqs. (6) and (8), in the case of Nphonon rates,depends on the crystal symmetry and the phonon mode.[32]
2.3. Phonon–impurity scattering
The scattering rate for the scattering of phonons by impurities is expressed as[24–26]

whereA=V0Γ/4πv3,withΓdenoting the strength of the scattering from isotopes and point defects, such as substitutional impurities as well as possible strain in a specimen. The value ofΓdepends on the concentration of impurities and their mass and radius differences.[30,31]
2.4. Phonon–disorder scattering
The disorder associated with the imperfections in a solid,such as strain due to impurities,isotopes and dislocations,can also be a source of scattering for phonons. The scattering rate for phonon–disorder interaction is expressed as[29]

whereDOdenotes the phonon–disorder scattering strength.
2.5. Phonon-boundary scattering
The scattering of phonons by sample boundaries is assumed to be independent of temperature and frequency, and reads[30,31]

whereLErepresents an effective phonon mean free path of the order of the cross-sectional dimensions of the specimen. It includes effects resulting from sample size, geometry, specular reflection of phonons at the surface, etc., which may lead to deviation from the expectedT3behavior.LEcan be written in the form[30]
For a sample of lengthland cross-sectional sidesbandt,the Casimir lengthLC=(4bt/π)1/2. The value of the specularity parameterpvaries from 0 to 1; wheneverp >0, partial specular reflection occurs to decrease the effect of boundary scattering.
3. Results and discussion
We have performed numerical calculations ofκL(T)using Eqs. (3)–(13), for characteristic parameters of Cd3As2:[17,22,33]a=3.189 ˚A,c=5.185 ˚A,vL=3500 ms-1,andvT=2160 ms-1. The Debye temperature depends on the phonon spectrum and is known to be different for the three acoustic modes. However,due to lack of experimental data on phonon spectrum, we take the average value ofΘD=111 K reported in Ref.[17]. Unlike the treatment of Asen-Palmeret al.,[31]we do not consider the individual contributions from the LA and TA modes. In the case of N-phonon scattering rates for the bulk tetragonal system, the frequency exponentsin Eqs. (6) and (8) is usually taken as 2 for LA and 1 for TA phonons.[30,34]However, in literature, other temperature and frequency dependent N-phonon relaxation rates have also been considered to explain experimental data on TC.[24,34]
With a view to first understand the temperature dependence of the total LTC and the relative importance of the individual contributions due to the various phonon scattering mechanisms limiting LTC in Cd3As2over a wide temperature range, we choose to illustrate the same for parameters characterizing sample A of Wanget al.[10](see Table 1).It may be mentioned here that, while the boundary scattering coefficientLEis determined by the sample surface specularity parameterp(0<p <1), the phonon–phonon scattering coefficientsBNandBUdepend crucially on the material Gruneisen parameterγ. In the absence of clarity on the roles of LA and TA phonons and the frequency dependences of their phonon scattering rates on the thermal conduction processes,we present here calculations ofκLconsidering two values for the frequency exponent, namelys=1, often considered typical of TA phonon frequency dependence ands=2,as characteristic of LA phonons. Figure 1 depictsκLas a function of temperature, calculated using Eqs. (3)–(13), with(τR)-1=(τB)-1+(τI)-1+(τDO)-1+(τU)-1,for typical values of the scattering parameters:p=0.2,Γ=1.2×10⁻⁴,D0=10-19s and takingγ=0.2 ands=1. Curvesa,b,canddrepresent the temperature dependences of the individual contributions due to scattering from sample boundaries,disorder, impurities, and other phonons, respectively. Curve 1 denotes the behavior of the total contribution,κL. It is found that each of these scattering mechanisms is operative over certain ranges of temperature. For the values of the parameters chosen, at very low temperatures (T <4 K), where phonon-processes are frozen out,κLis predominantly determined by boundary and disorder scatterings with characteristicT3andT2dependences, respectively. With increase in temperature,κLreaches a maximum ofκmax~10 W/mK atTmax~8 K,where phonon–impurity scattering is found to become important. With further increase in temperature,κLis found to decrease asT-1because of phonon–phonon scattering. Our calculations also indicate that the influence of the phonon–impurity scattering is significant even at higher temperatures (T >~100 K). The dashed curve in Fig. 1 depicts the temperature dependence ofκLcalculated for the same set of parameters listed above, but withs=2. We notice that in this case,although the variation ofκLis similar to that calculated withs=1,its magnitude is slightly greater in the range 8 K<T <120 K. With a view to investigate the role of Nphonons in determining LTC, we have also performed calculations of its components,κ1andκ2,as given by Eqs.(3)–(5),again,for the parameters of sample A of Wanget al.[10]Curvesaandbin the inset in Fig.1 show,respectively,the temperature dependences of the contributionsκ1andκ2. Curve 1 represents the dependence of the totalκL. We find that although the contribution fromκ2, which is due to the N-phonons, is very small forT <50 K,it is found to become important at higher temperatures and then tend to saturateκL,forT >100 K;it is sensitive to the value ofΓ.[31]

Fig. 1. Temperature dependence of LTC, κL, of Cd3As2 calculated for the parameters of sample A of Wang et al.[10] Curves a, b, c and d depict individual contributions from phonon-boundary, phonon–disorder, phonon–impurity and phonon–phonon scatterings,respectively,to the total κL (curve 1), calculated with s=1 in Eq. (6). The dashed line depicts the overall κL calculated with s=2. Inset shows the contributions from κ1(curve a)and κ2(curve b)to κL (curve 1),calculated with s=1.
In the following,we analyze the recent experimental TC data available for six samples of Cd3As2, i.e., four of Wanget al.,[10]one of Zhanget al.,[11]and one of Pariariet al.[12]in terms of LTC,κL. In our analysis, we attempt to obtain fits to the data by treating the scattering parametersp,Γ,D0andγas fitting parameters,keeping in view of the relative importance of the various phonon scattering mechanisms determiningκL(T),and noting that,while the parametersp,ΓandD0are sample dependent,γis characteristic of the material.Further, to obtain a good fit with the experimental data for a sample of known dimensions, we vary first the value ofpbetween zero and unity to obtain a fit with the low temperature data, and then that ofΓandD0to match the data near the peak value of TC. Using these approximate values of the sample-dependent parameters, we determine the value of the intrinsic high-temperature phonon scattering fitting parameterγby a nonlinear regression procedure. This is repeated for each sample. Finally, we systematically finely tune the values ofpandΓto arrive at a single value forγ,the parameter which is characteristic of the material Cd3As2. We find that,with these values of the fitting parameters,p,Γ,D0andγ,thus obtained, the value of 0.2 for the average Gruneisen parameterγdescribes well the TC data of the six samples considered. We note here that the value ofγ, which reflects the strength of the phonon–phonon interactions, needs to be substantiated by experimental studies for Cd3As2. In the case of ZrTe5,also a Dirac semimetal,a value of 1.25 is reported from DFT calculations.[35]
Figures 2(a), 2(b), 2(c) and 2(d), respectively, show the fits we have obtained for the data of samples A,B,C,and D of Wanget al.,[10]which are in the form of single crystals with needle-like shapes. The solid dots, in each of the figures, denote their data obtained for 8 K<T <300 K.It may be noted that the data for all the samples of Ref.[10]show a variation of TC typical of the behavior ofκL(T)corresponding to temperaturesT >Tmax: the TC is seen to decrease suddenly for 8 K<T <~50 K and then to increase slowly forT >50 K.Curvesain Figs. 2(a)–2(d) represent the variation ofκL(T)calculated using Eqs.(3)–(13), withs=1. The values of the fitting parameters used to obtain the fits are listed in Table 1.We notice that our calculations ofκL(T)obtain good fits for all the four samples of Ref. [10], only over the low temperature range,T <40 K,and that curvesaunderestimate the data for higher temperatures. The dotted line in Fig. 1(a) depicts the variation ofκL(T)calculated withs=2. We further note that the temperature dependence ofκLcalculated withs=1(curvea) is similar to that calculated withs=2 forT <50 K, and represents the data more closely for higher temperatures. It may however be mentioned that the deviations ofκL(T)from the measured TC noticed in Figs.1(a)–1(d)for higher temperatures becomes larger with increasing temperatures.

Fig.2. Temperature dependences of TC of four samples of Cd3As2 of Wang et al.:[10](a)sample A,(b)sample B,(c)sample C,and(d)sample D. Curves a and b, respectively, represent our calculations of the contributions κL and κe to the total κ (curve 1), with s=1. Dots denote experimental data. In(a),the dotted and dashed lines,respectively,represent κL and κ calculated with s=2.
With a view to obtain a quantitative agreement with the experimental data over the entire range of temperatures, we now examine the contribution of the electronic componentκe(T)to the overall behavior of TC.It may be noted that the electronic TC,κe, in semiconductors, though much smaller than the lattice component(κe/κL~0.01),is expected to become important at higher temperatures, especially in degenerate systems. It is known to display a typical temperature dependence:[24,25]with increasing temperatures,κe,at first increases rapidly, then tends to saturate at higher temperatures;it is very small at very low temperatures and becomes significant at higher temperatures.[22,24]Here,we employ the Boltzmann transport formalism for electrons and expressκein the form[24,25]

In Eq. (15),τ(Ek) denotes the overall momentum relaxation time of the electrons with energyEkand velocityvk,with other quantities having their usual meaning.[20–22]Considering the electrons in Cd3As2to undergo scattering from charged impurities,disorder and acoustic phonons,[20,21]we have computed the overall electron relaxation rate assuming Matthiessen rule:(τ(Ek))-1=∑i(τι(Ek))-1,the explicit expressions for the individualielectron relaxation rates,(τι(Ek))-1,being given in Refs.[20,21]. Curvesbin Figs.2(a)–2(d)represent the results of our calculations ofκeperformed using Eq. (14) for characteristic parameters of the Cd3As2samples of Refs.[22,33]:deformation potential constant,D=30 eV,and disorder scattering parameter,ndV0=0.16 (A0)-1. In order to obtain fits to experimental data on TC,κ, at the higher temperatures(T >200 K),we have treated the charged impurity concentration,Ni,as a variable parameter,to alter the magnitude ofκe.It is observed that,as expected,κeis small and shows an increase in magnitude from zero at 0 K to~2 W/mK at 400 K.It is also clear thatκecan become larger thanκLat high temperatures(T >~200 K).Curves 1 in Figs.2(a)–2(d)denote the temperature dependences of the total TC,κ=κL+κe,withκLcalculated withs=1(curvesa). Our calculations are seen to obtain good fits to the data of Ref.[10]for samples B,C and D over the entire range of temperatures(8 K<T <~400 K).The values ofNiused for calculatingκeto obtain the fits are also listed in Table 1. In the case of sample A,the data is found to show a deviation from curve 1 forT >~300 K.We have,therefore,performed calculations ofκL(T)for characteristic parameters of sample A, takings=2. The dashed curve represents the results of our calculations of the total TC,κ=κL+κe, withκLcalculated withs=2(dotted curve),andκe(T)calculated using Eq.(14). However,the dashed curve is found to show a larger deviation from data than that shown by curve 1.
In the case of samples C and D of Wanget al.,[10]we note that the carrier concentrations of these samples are larger than those of samples A and B. Further, their data shows a slow monotonic increase in TC at higher temperatures, suggesting increased electronic contribution toκ. Accordingly, we first attempt to fit the high temperature data(T >350 K)with electronic contribution alone, and then fit the data at lower temperatures following the procedure described above for samples A and B.The parameters used to obtain the fits are listed in Table 1. It may be noted that a good representation of the data is obtained over the entire temperature range. However,a slight departure from the data is noticed at intermediate temperatures (50 K<T <200 K). This may be ascribed to the lack of sufficient knowledge regarding the phonon dispersion and the consequent simplifications made in our model.
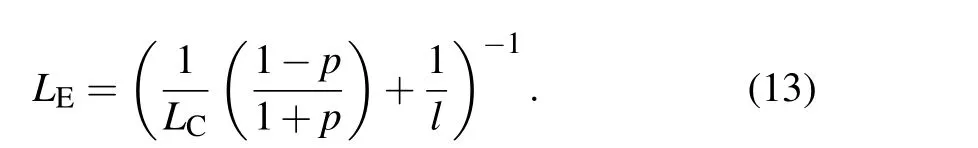
We now present our analysis of the wider-temperaturerange(5 K<T <375 K)TC data reported for the other two samples, one of Zhanget al.[11]and the other of Pariariet al.[12]The filled dots in Figs. 3 and 4 represent the data for both the samples.The data show that,with increase in temperature fromT~5 K,the TC,κ,at first decreases substantially,from a large value,following aT-1dependence mainly due to phonon–phonon scattering till about 50 K–100 K,and then increases slowly,possibly due to the contribution fromκe.[10–13]The low-temperature (T~5 K) large value ofκis found to be 35 W/m·K for the sample of Ref. [11] and 17 W/m·K for the sample of Ref. [12]. We note here that these two samples possess large electron concentrations in characteristic of degenerate semiconductors(see Table 1). Further, apart from not exhibiting the decrease ofκLfrom the boundary scattering forT <Tmax, they show temperature dependences for typical TC in a semiconductor. In our analysis of their data, we have therefore performed calculations considering contributions from bothκLandκeusing Eqs.(3)–(13)and(14),respectively, for characteristic parameters of the samples. Accordingly,we first obtain fits for the high temperature(T >350 K)data with electronic contribution alone, and then follow the procedure described above to obtain the fits to the data at the lower temperatures considering the lattice contribution. In Figs. 3 and 4, curvesarepresent the variation of the lattice contribution,κL,and the curvesbrepresent the electronic contribution,κe, for the samples of Zhanget al.[11]and Pariariet al.,[12]respectively. The parameters used to obtain the fits are listed in Table 1. Here,we note that,in the absence of TC peak and sufficient information about the dimensions of the Cd3As2sample of Ref.[12],the value ofLE(instead ofp)was varied to match the data near the ‘peak’ value of TC; moreover,the large value of 10 mm obtained forLEis suggestive of a large phonon mean free path.[11,12]We find that, with these parameters,very good fits to the data are obtained over the entire temperature range. For instance, our calculations for the sample of Zhanget al.show that at 300 K,κL=1.87 W/mK,which is close to their estimated value of 1.91 W/mK.[11]

Table 1. Sample parameters and scattering parameters determined from analysis of experimental data on TC of Cd3As2 samples of different groups.
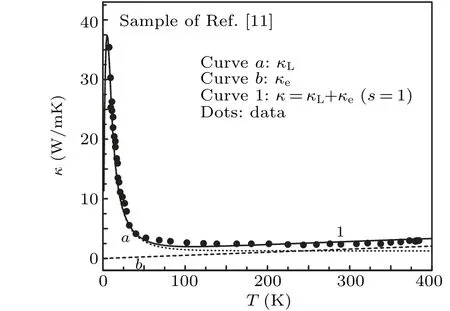
Fig.3.Variation of TC as a function of temperature for the Cd3As2 sample of Zhang et al.[11] Curves a(dotted line)and b(dashed line),represent our calculations of the lattice and electronic contributions,respectively,to the total TC(curve 1). Dots depict the TC data of the sample in Ref.[11].

Fig.4.Temperature variation of TC for the Cd3As2 sample of Pariari et al.[12]Curves a(dotted line)and b(dashed line), respectively, represent lattice and electronic contributions to the total TC(curve 1). Dots depict the TC data of the sample in Ref.[12].
4. Conclusions
We have presented a model for evaluating LTC and analyzed the wide temperature TC data on Cd3As2samples of different research groups using the Callaway model. Good fits with the experimental data are obtained for all the samples considered. A unique value for the Gruneisen parameter characterizing the intrinsic phonon–phonon scattering mechanisms is obtained. The calculations show that,even for high temperatures, LTC is significant. The temperature dependences of both the contributions, LTC and electronic TC, are studied.The present invesitigation brings out the relative importance of the phonon-scattering mechanisms operative in the Cd3As2system.Recently DFT calculations have reported some details of the phonon spectrum of Cd3As2, suggesting possible contribution from optical phonons.[19,35]A more detailed study of TC of Cd3As2, taking into account the anisotropy of the material and the details of the phonon dispersion and considering the separate contributions from the LA and TA phonon modes as well as from the optical phonons to both the lattice and electronic components of TC,is in progress.
Acknowledgement
This work was supported by University Grants Commission(UGC),India.
杂志排行

Chinese Physics B的其它文章
- A design of resonant cavity with an improved coupling-adjusting mechanism for the W-band EPR spectrometer
- Photoreflectance system based on vacuum ultraviolet laser at 177.3 nm
- Topological photonic states in gyromagnetic photonic crystals:Physics,properties,and applications
- Structure of continuous matrix product operator for transverse field Ising model: An analytic and numerical study
- Riemann–Hilbert approach and N double-pole solutions for a nonlinear Schr¨odinger-type equation
- Diffusion dynamics in branched spherical structure