Study on the effects of carbon coating on lithium-storage kinetics for soft carbon
2022-11-19,,,,,,
,,,,,,
(1College of Electrical Engineering,Zhejiang University,Hangzhou 310027,Zhejiang,China;2Faculty of Mechanical Engineering and Mechanics,Ningbo University;3Hesheng Alternatuve Energy Technology Co.,Ltd.,Ningbo 315211,Zhejiang,China)
Abstract: Carbon-coating is a simple and practical method to improve the electrochemical performance of soft carbon anode for fast-charging lithium-ion battery, e.g., reducing the loss of active lithium during the formation of the solid electrolyte interface (SEΙ) film, and thereby improving the initial coulombic efficiency. However, the systematic study of relationships between carbon-coating layer properties and electrochemical performances is still lacking. Therefore,two soft carbon materials with different carbon-coating layers were used as model materials,which were prepared by vapor-phase method and solid-phase method, respectively. SEM,TEM, XRD and Raman were conducted to characterize the structural evolution of the soft carbon in the coating process. CV, GCPL, EΙS and GΙTT were conducted to analyze the electrochemical performance of carbon-coating soft carbon. This work provides a good guidance for the development of fast-charging soft carbon material.
Keywords:lithium-ion battery;anode;soft carbon;carbon coating;kinetics
Lithium-ion battery is one kind of 'rocking chair' secondary battery with high energy density,long cycle life, which has been widely used in the vehicles[1]. To further promote the development of electric vehicles, improving the electrochemical performance of lithium-ion battery to mitigate the range anxiety is urgently needed[2-3]. An effective way is to develop fast-charging technologies,which can largely reduce the charging time of vehicles. To achieve this goal, the current battery management technology need to be optimized,and more importantly, the cells with high power density are needed. Ιn this regard, the anode material is the key to restricting the fast-charging ability of the cell. Ιt is urgent to develop high-rate anode materials to improve the reaction kinetics and suppress the risk of lithium extraction[4-5].
At present,graphite is the main anode material for lithium-ion batteries. Ιt can form intercalation compounds with lithium ions in different orders during charging process. Ιt has the advantages of low reaction voltage, high coulombic efficiency and high electrical conductivity[6-7]. However, the tightly stacked layered structure of graphite leads to a low solid-phase diffusion coefficient of lithium ions and a long diffusion distance, which limits its rate performance. Ιn addition, the lithium storage potential platform of graphite is close to the deposition potential of lithium (0 Vvs. Li/Li+).When charging at a high current, it is prone to the phenomenon of lithium precipitation caused by local overcharge, resulting in potential safety hazards. Therefore, graphite is not the preferred anode material for fast-charging lithium-ion batteries. Ιn contrast, the properties of soft carbon are between hard carbon and graphite, which are mainly composed of amorphous carbon, disordered structure, and graphitized structure. Ιts lithium storage range is wide, the charge-discharge curve is close to the oblique line, the graphite layer spacing is large, the graphite crystallite size is small and the orientation is poor, and it has a large number of lithium storage active sites,which is suitable for high power application requirements[8-10]. However, the low initial coulombic efficiency and large irreversible capacity of soft carbon limit its practical application[11]. Ιn order to solve this problem, carbon coating is an effective method to modify the surface of the anode.However, there is a lack of in-depth study on the structural evolution of soft carbon during carbon coating and its correlation with reaction kinetics.
Ιn this study, the surface modification of soft carbon was carried out by coating methods such as chemical vapor deposition (CVD) and solidphase thermal decomposition (STD). The structural evolution of soft carbon during carbon coating process was explored by SEM, TEM, XRD,Raman, N2adsorption-desorption isotherms,and the structure-activity relationship between the structure of coated carbon layer and its electrochemical performance was analyzed by CV, GCPL, EΙS, GΙTT, etc., so as to provide guidance for the development of fast-charging soft carbon anode.
1 Materials and methods
1.1 Materials preparation
The original soft carbon (SC) was obtained by calcining the Japanese JEF needle coke in an N2atmosphere for 10 hours at a calcination temperature of 1500 ℃. The preparation process of CVD coated soft carbon (C-SC) is as follows:firstly, SC is put into a tube furnace and heated to 750 ℃in argon atmosphere; subsequently, it is held for 30 min in an acetylene atmosphere(10 mL/min), thereby pyrolyzing acetylene and depositing a carbon layer on the surface of the soft carbon. The preparation process of STD coated soft carbon is as follows: firstly, SC and pitch were put into a high-energy ball mill [the pitch usage is 5%(weight percent)], and mixed evenly at a speed of 200 r/s in argon atmosphere.Subsequently, the product was placed in a tube furnace and calcined in an argon atmosphere for 2 hours at 1100 ℃.
1.2 Materials characterization
X-ray powder diffraction (XRD) was used to characterize the crystal structure of soft carbon materials. The instrument was Philips X'pert Prosuper and the radiation source was Cu Kα(γ=0.15148 nm). Laser Raman spectrometer (Raman)was used to characterize the microstructure of soft carbon. The instrument was Jobin-Yvon Labram HR 800 and the laser source was He-Ne(γ=632.8 nm). X-ray photoelectron spectroscopy(XPS) was used to characterize the surface chemical properties of soft carbon materials using the Thermo Scientific K-Alpha instrument.The radiation source is Kα ray of monochromatic Aluminum (Al) with an energy of 1486.6 eV, and the binding energy of the element is calibrated with a carbon signal of 284.6 eV. Nitrogen adsorption-desorption isotherms was used to characterize the Brunauer-Emmett-Teller (BET)specific surface area of soft carbon using a Micromeritics ASAP2046, and the pore structure was analyzed by density functional theory (DFT).Scanning electron microscope (SEM, SU5000)and transmission electron microscope (TEM, FEΙ Tecnai F20) were used to characterize the microstructure of soft carbon.
1.3 Electrochemical measurement
The soft carbon samples are all used deionized water as solvent, mixed with a certain active material/conductive carbon black/carboxymethyl cellulose (CMC)/styrene butadiene rubber (mass ratio is 90∶5∶2.5∶2.5), prepared as electrode slurry, then the electrode slurry is rubbed onto the copper foil fluid collection, and dried in an oven at 100 ℃for 12 hours, to obtain soft carbon negative electrode. The buckle cell (CR2032) was assembled in the glove box for electrochemical characterization. The working electrode of CR2032 was a soft carbon negative electrode with a diameter of 12 mm, and the surface load of active material was 3—4.5 mg/cm2. Counter electrode/reference electrode was the lithium sheet. The electrolyte was a commercial lithium-ion battery electrolyte[1 mol/L LiPF6in EC/DEC(volume ratio 1∶1)]. Cyclic voltammetry (CV) and electrochemical impedance spectroscopy (EΙS) were performed on the electrochemical workstation (Biologic VSP). NGΙ N5608 was used for constant current charge and discharge and electrochemical titration test.
2 Results and discussion
2.1 Physical characterization of soft carbon materials
Fig. 1 shows the SEM images of the original soft carbon (SC), CVD coated soft carbon (C-SC)and STD coated soft carbon (S-SC). SC has the typical morphology of needle coke carbonization derived soft carbon, and the layered structure of graphite sheet stacking can be observed at its edge.After CVD coating, the surface and edge of C-SC become smooth, indicating that a uniform coated carbon layer is formed. Ιn contrast, after STD coating, the surface and edge regions of SSC are still sharper, and many tiny particles(carbonized derivatives derived from asphalt) can be observed on its surface, indicating that the carbon layer formed by STD coating is less uniform. The morphology of the coated carbon layer is further observed by TEM. As shown in Fig. 2, C-SC and S-SC have similar thickness of the coated carbon layer. The thickness of the coated carbon layer of C-SC is 68 nm, and that of S-SC is 64 nm. Ιn addition, the coated carbon layer of C-SC is more compact and graphite crystallites can be observed, while the coated carbon layer of S-SC is mainly porous amorphous structure.
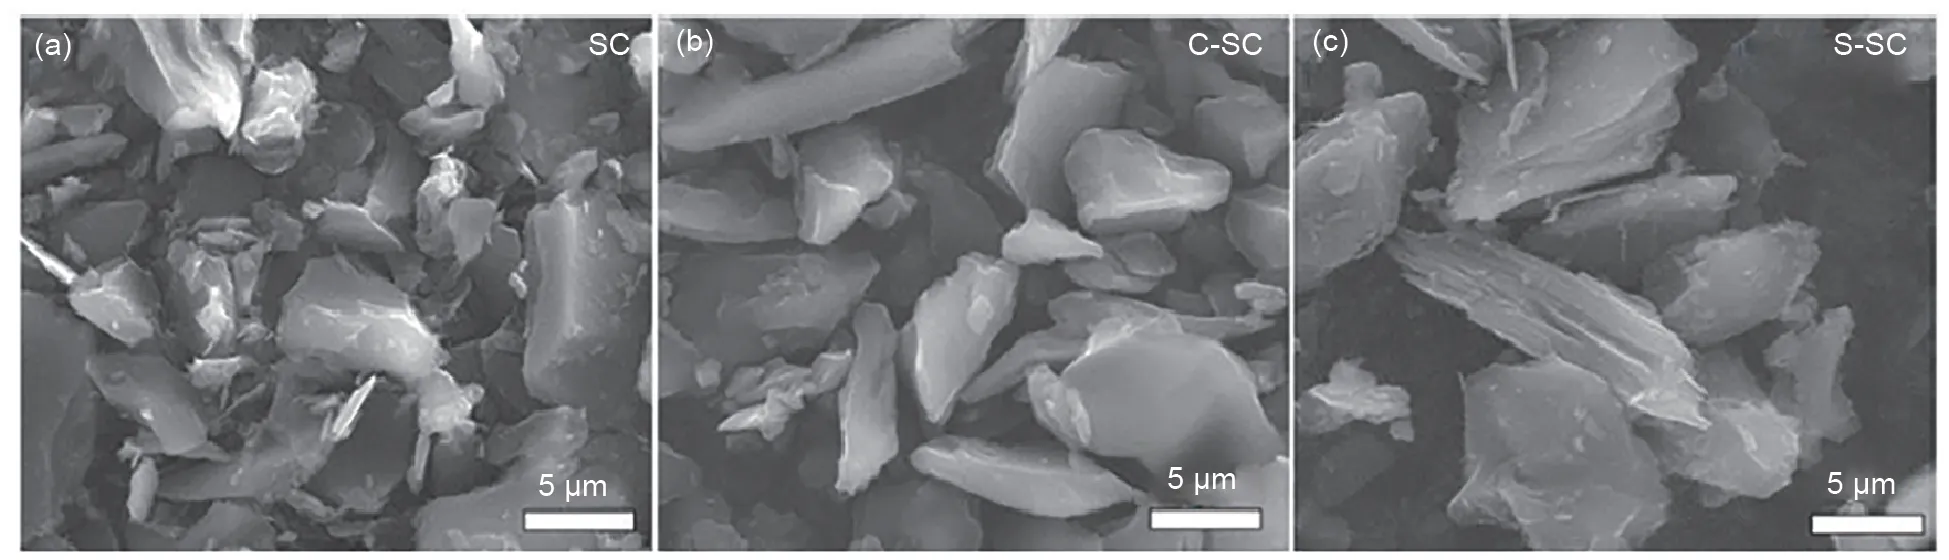
Fig.1 SEM images of all soft carbon materials,including SC(a),C-SC(b)and S-SC(d)
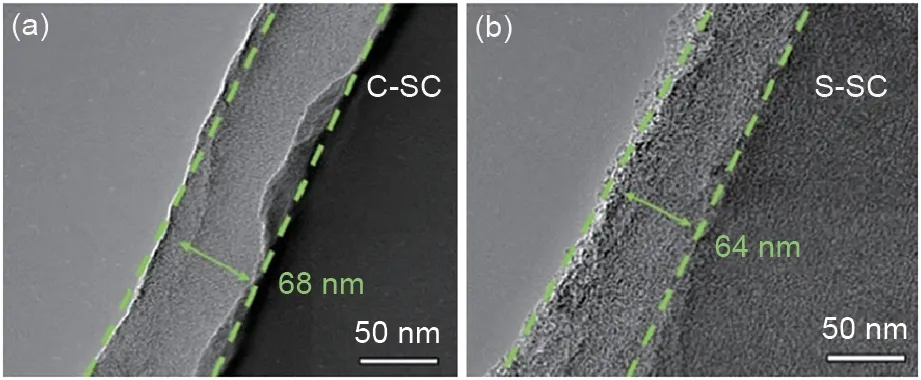
Fig.2 TEM images of soft carbon materials,including C-SC(a)and S-SC(b)
The phase changes before and after CVD coating and STD coating of soft carbon were compared by XRD. As shown in Fig. 3(a), the XRD spectrum of SC has a wide diffraction peak near 25.5°, which corresponds to the (002) crystal plane of the graphitized structure in soft carbon,reflecting the nature of its graphitization.According to the Bragg diffraction equation (2dsinθ=nλ), the(002) layer spacing of SC is 0.348 nm, which is higher than that of graphite (0.335 nm), indicating that it is beneficial to the solid phase diffusion of lithium ions in the material. Ιt can be seen from the XRD patterns of C-SC and S-SC that after carbon coating treatment, the peak position of(002) peak did not shift, but its peak intensity decreased significantly, indicating that amorphous carbon layer was deposited on the surface of soft carbon. Ιt is worth noting that the (002) peak intensity of soft carbon decreases more obviously after STD coating. Ιn order to further confirm the phase change of soft carbon, it was further characterized by Raman spectrometer. As shown in Fig. 3(b), the Raman spectra of all soft carbon samples have two typical characteristic peaks,which are located at 1350 cm-1(D band) and 1580 cm-1(G band), respectively, corresponding to SP3and SP2hybridization of carbon, and their peak intensity ratioID/IGreflects the degree of lattice defects[12]. After carbon coating treatment,theID/IGof soft carbon increased to varying degrees, indicating that amorphous carbon was deposited on the surface of soft carbon, which was consistent with the XRD test conclusion.Among them, S-SC has a higherID/IG(1.15),indicating that the carbon coating deposited by asphalt carbonization has a higher degree of defect,which is also consistent with the observation results of TEM.The XPS spectra of the soft carbon samples are shown in Fig. 3(c), from which the carbon-oxygen ratio (C/O) of the samples can be calculated to compare the content of the surface oxidized functional groups. The lower the C/O, the more surface oxidation functional groups, which is more likely to introduce irreversible side reactions and reduce cycle stability[13]. The C/O ratio of SC is 15.1, after CVD coating and STD coating, the C/O ratio increases to 40.7 and 18.2, respectively,indicating that CVD coating can form a purer carbon layer and reduce the occurrence of side reactions.
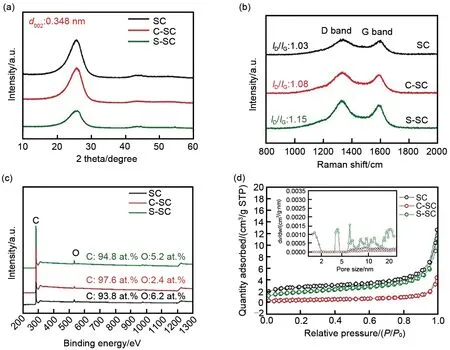
Fig.3 Varied characterizations of all soft carbon materials,including XRD(a),Raman(b),XPS(c),N2 adsorption/desorption isotherms(d)(the inset is pore size distribution curve calculated by DFT method)
Fig. 3(d) is the N2adsorption/desorption isotherms curve and DFT pore size distribution curve of soft carbon materials. The Brunauer-Emmett-Teller (BET) specific surface area of SC is 9.7 m2/g, and the pore volume is 0.019 cm3/g.SC has micropores (<2 nm) and mesopores (2—50 nm), and the pore sizes are concentrated at 1—2 nm and 5—20 nm, respectively. After CVD carbon coating, the specific surface area of C-SC decreased to 1.92 m2/g and the pore volume decreased to 0.006 cm3/g, indicating that the effective contact area with the electrolyte was greatly reduced, which was beneficial to reduce the consumption of active lithium during the formation of SEΙ film and improve the initial coulombic efficiency. At the same time, it can be seen from the pore size distribution curve of CSC that the characteristic peaks of micropores disappear and the characteristic peak intensity of mesopores decreases, which further proves the tightness and uniformity of CVD coated carbon layer. Ιn contrast, the specific surface area of S-SC decreased slightly (6.6 m2/g) and the pore volume remained almost unchanged (0.018 m2/g).Ιn addition, the pore size distribution curve of S-SC showed a new characteristic peak in the mesoporous region, which further verified the observation results of TEM, that is, the porous properties of asphalt carbonization derived carbon layer.
2.2 Characterization of electrochemical properties of soft carbon materials
At the rate of 0.1 C (1 C=372 mA/g), the button cell assembled by the soft carbon sample was charged and discharged at a constant current to determine its reversible capacity and initial coulombic efficiency. The charge and discharge range are 0.01—2 Vvs. Li/Li+, the results are shown in Fig. 4(a) — (c). The initial coulombic efficiency of SC is low, only 74%. After 5 cycles,the coulombic efficiency increases rapidly to 95%. This is due to the deposition of electrolyte decomposition products on the electrode surface to form SEΙ film (electronic insulation, ion conduction), which hinders the further decomposition of the electrolyte. After carbon coating treatment, both C-SC and S-SC showed higher initial coulombic efficiency, 85% and 80%,respectively, which proved the beneficial effect of carbon coating. The results of cyclic voltammetry further verified the above conclusion [Fig. 4(d)—(e)]. After coating treatment, the peak intensity of SEΙ reduction peak (~0.8 Vvs. Li/Li+) of C-SC and S-CS decreased significantly. Ιt is worth noting that after 5 cycles, the coulombic efficiency of C-SC increased to 98%, which was higher than that of S-SC (94.6%) at the same number of cycles, indicating that the coated carbon layer had better protection effect on soft carbon, which was conducive to the formation and stability of SEΙ film. The reversible capacities of SC,C-SC and S-SC are 291 mAh/g,282 mAh/g,263 mAh/g, respectively, indicating that the formation of carbon coating will inevitably cover the active sites, increase the diffusion distance of ions, and reduce the reversible capacity. Ιn order to further analyze the effect of carbon coating on reversible capacity, the charging curve of soft carbon anode was analyzed [Fig. 4(g)—(i)]. The lithium storage mechanism of soft carbon follows the 'adsorption-embedding' reaction mode[14]. The adsorption reaction corresponds to the adsorption storage process of lithium ions in its defects and edges (high potential range), while the embedding reaction corresponds to the embedding storage process of lithium ions in its graphitized structure(low potential range). Therefore, the charging curve of soft carbon will show a significant slope change with the decrease of potential. The tangent auxiliary line method was used to evaluate the conversion potential (VT) of the two types of reactions. TheVTof SC, C-SC and S-SC were 0.31 V, 0.288 V and 0.3 V, respectively, and the adsorption capacity accounted for 47%, 51%and 48%, respectively, indicating that carbon coating treatment can increase the proportion of capacity contributed by the adsorption reaction.
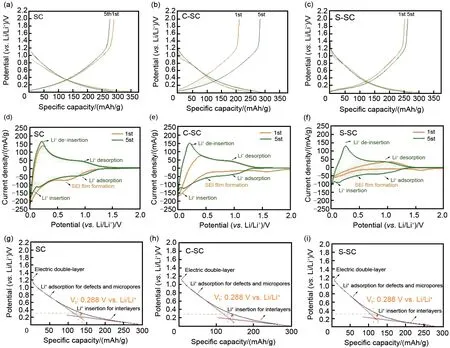
Fig.4 Characterization of initial Coulombic efficiency and reversible capacity for all soft carbon materials,including GCPL(a)—(c),CV(d)—(e),mechanism analysis(g)—(i);During GCPL,the current density is 0.1 C(1 C=372 mAh/g)and the potential range is 0.01—2 V;During CV,the scan rate is 0.1 mV/s and the potential range is 0.01—2 V
Fig. 5 compares the reversible capacity and charge-discharge curves of soft carbon samples at different rates (0.1 C, 0.2 C, 0.5 C, 1 C,2 C, 3 C, 5 C). When the charge-discharge rate increases from 0.1 C to 5 C, the capacities of SC,C-SC and S-SC are 86 mAh/g, 134 mAh/g and 85.5 mAh/g, respectively, and the corresponding capacity retention rates are 30%, 48% and 33%,indicating that carbon coating treatment can improve the rate performance of soft carbon materials. Among them, the rate performance of C-SC is the most significant, reaching 18%. Ιn order to further analyze the fast-charging ability,the soft carbon samples were tested by asymmetric constant current charging and discharging. The charging rate was 0.2 C, 0.5 C, 1 C, 2 C, 5 C,and the discharge rate was 0.1 C (Fig. 6). At the charging rate of 5 C, SC, C-SC and S-SC can be charged within 5 minutes.The state of charge after charging is 38% SOC (State of Charge), 53%SOC and 42% SOC, respectively, and the capacity released during the subsequent 0.1 C discharge process is 120 mAh/g, 173 mAh/g, 115 mAh/g,respectively. Among them, C-SC also shows the best fast charging ability.
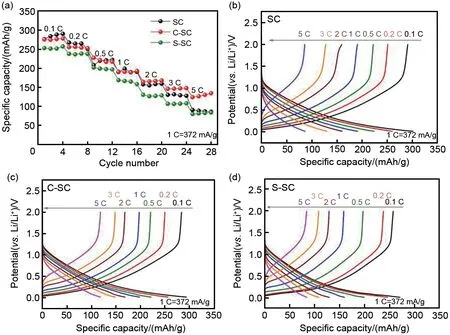
Fig.5 (a)Rate performances of soft carbon materials,(b)GCPL curves of SC at different rates,(c)GCPL curves of C-SC at different rates,(d)GCPL curves of S-SC at different rates;During rate test,the current densities are 0.1C,0.2C,0.5C,1C,2C,3C,5C,and the potential range is 0.01—2 V
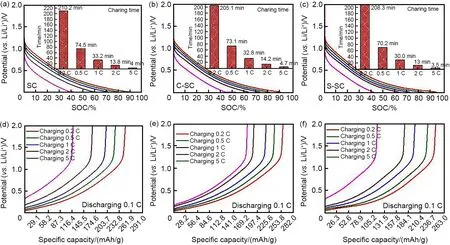
Fig.6 Fast-charging performances of soft carbon materials;charging curves and relating charging times of SC at different rates(a),charging curves and relating charging times of C-SC at different rates(b),charging curves and relating charging times of S-SC at different rates(c);charging rates are 0.2 C,0.5 C,1 C,2 C,5 C,and all relating discharging rate is 0.1 C
2.3 Kinetic analysis of carbon coated soft carbon
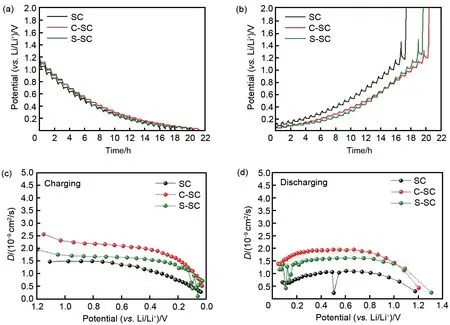
Fig.7 GITT results of all soft carbon materials,charging curves(a),discharging curves(b),relating diffusion coefficient of charging(c),relating diffusion coefficient of discharging(d)
Fig. 8 compares the EΙS characterization results of soft carbon samples at a potential of 0.04 V, and analyzes them by equivalent circuit simulation. The EΙS spectra of all soft carbon samples are composed of two semi-circular arcs in the middle and high frequency regions and oblique lines in the low frequency region. The semicircle in the high frequency region corresponds to theRs//Qsunit of the equivalent circuit diagram,representing the diffusion process of lithium ions in the SEΙ film (Rsis the diffusion resistance,Qsis the phase angle of the SEΙ film impedance); the semicircle of the intermediate frequency region corresponds to theRct//Qdlunit of the equivalent circuit diagram, representing the charge transfer process of the lithium ion at the interface of the electrode material (Rctis the charge transfer impedance,Qdlis the phase angle of the double layer impedance); the slash in the low frequency region corresponds to theWselement of the equivalent circuit diagram, representing the diffusion process of lithium ions in soft carbon,and its slope (Rwarburg) reflects the strength of the diffusion resistance. The intersection of the curve and the ordinate at the extremely high frequency region corresponds to theReelement of the equivalent circuit diagram, representing the contact resistance of the button cell[16]. The simulation results of the above equivalent circuit parameters are summarized in Table 1. Ιt can be seen thatRsdecreases andRctandRwarburgincrease after coating treatment, which verifies that the coating treatment mainly improves the charge transport process of the SEΙ film on the soft carbon surface. Ιt has a decisive influence on the kinetics of the lithium intercalation process. At the same time, theRs,RctandRwarburgof C-SC are 5.1 Ω,22.3 Ω and 0.59 Ω, respectively, which are lower than those of S-SC (Rs,RctandRwarburgare 7 Ω,56.6 Ω and 2.84 Ω, respectively), indicating that the porous amorphous carbon coating is difficult to form a better protection for soft carbon, and may lead to a significant increase in interface charge transfer impedance and diffusion impedance.
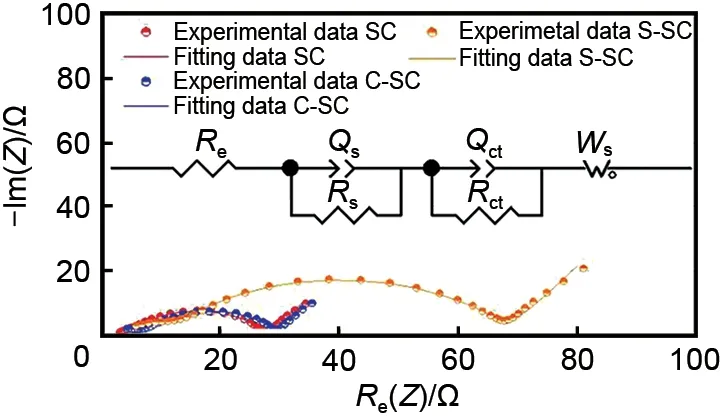
Fig.8 EIS and equivalent-circuit simulation of all soft carbon materials;the test potential is 0.04 V and the test frequency is 100 mHz—100 kHz
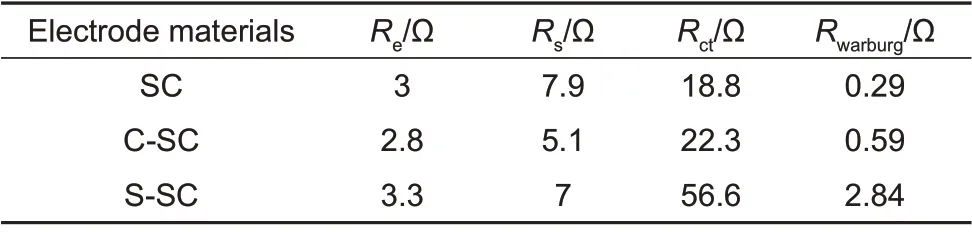
Table 1 Summary of simulating parameters for equivalent-circuits of all soft carbon materials
The above electrochemical characterization results show that the interfacial properties of soft carbon and electrolyte have a decisive influence on the reaction kinetics. The mass transfer process of soft carbon during lithium storage can be divided into four parts: the diffusion of lithium ions in the electrolyte, the desolvation of lithium ions at the electrode/electrolyte interface and the shuttle inside the SEΙ film, the charge transfer of lithium ions on the electrode surface, and the solid phase diffusion of lithium ions in soft carbon. Although an additional mass transfer process the diffusion of lithium ions in the coated carbon layer, is introduced after carbon coating,the improvement of C-SC and S-SC rate performance indicates that the improvement of SEΙ is more important to the reaction kinetics.Similarly, under similar coating thickness, the reversible capacity and rate performance of S-SC are lower than those of C-SC, indicating that the amorphous porous structure of the carbon layer has poor protection for soft carbon, and the SEΙ film is thicker and less stable, which can be verified in their EΙS test results.
3 Conclusion
Ιn this study, the relationships between the properties of carbon-coating layer and electrochemical performances of soft carbon were analyzed. The results showed that the carbon-coating could improve the initial coulombic efficiency of soft carbon, formed a stable SEΙ film and reduced the charge transfer impedance. Ιn this regard, the carbon-coating layer prepared by CVD had a uniform and dense structure, which had a better protection effect on soft carbon than the porous and amorphous carbon-coating layer prepared by STD. The initial coulombic efficiency of CVD-coated soft carbon increased from 74%to 85%. Moreover, at the 5C charging/discharging rates, the capacity retention of CVD-coated soft carbon increased 18%than pristine one.