Variation characteristics of extreme precipitation from 1955 to 2015 in Shijiazhuang City,Hebei Province
2022-11-11HAOLinZHOUHuiLIYanCAOXiaoleiLIUYu
HAO Lin,ZHOU Hui,LI Yan,CAO Xiaolei,LIU Yu
(Hydrological Survey and Research Center of Shijiazhuang City,Shijiazhang 050051,China)
Abstract:In order to give guidelines for the execution of countermeasures in response to extreme precipitation events.the tempo-spatial variation characteristics of extreme precipitationare are analyzed by 11 extreme precipitation indexes during the past 60 years(1955-2015)in Shijiazhuang City.The results showed that the extreme precipitation of Shijiazhuang City generally showed a downward trend in the past 60 years,and the wet day precipitation(PRCPTOT)exhibited the most obvious downward trend.There were significant spatial differences in the trend of extreme precipitation indexes.According to the spatial superposition of the historical trend of extreme precipitation index and Hurst index,the extreme precipitation intensity indexes in most areas of Shijiazhuang city will continue to decline in the future,and the extreme precipitation intensity indexes in some central areas will continue to rise.
Key words:extreme precipitation index;Sen's slope;Mann-Kendall mutation;Hurst index;Shijiazhuang City
1 Introduction
The frequency and intensity of extreme weather events continue to increase with global warming.Extreme climate events often bring serious adverse effects,which have aroused great attention from governments around the world[1].Extreme precipitation events are an important part of extreme climate events.Natural disasters such as flood,drought and debris flow caused by extreme precipitation events have directly or indirectly caused serious impacts on global ecosystem stability and social and economic development[2-3].Unlike extreme temperatures,extreme precipitation events do not have global consistency,for example,the total precipitation in some regions decreases or remains unchanged,but the frequency and intensity of extreme precipitation show an increasing trend[4].Due to the complexity and harm of extreme precipitation,more and more scholars have paid attention to the study of extreme precipitation events,which has important theoretical and practical significance for the formulation of scientific disaster prevention and mitigation measures.
Many studies have been conducted on the occurrence and trend of extreme precipitation around the world.Results showed that extreme precipitation presented great regional variability.The frequency and intensity of extreme precipitation events are increasing in most parts of the world,such as the United States,Europe,eastern Australia,Indo-Pacific region,India,southwestern Africa and Thailand[5-12],while extreme precipitation events are decreasing in western India,western central Africa,and western alpine Australia[8,13-14].In line with the global trend,the frequency and intensity of extreme precipitation events in most areas of China have an increasing trend,such as in northeastern and southeastern China,eastern Tibetan Plateau and Xinjiang,whereas there are decreasing trends in north China and southwestern China[15-18].
Due to China's complicated topography and huge differences in regional atmospheric circulation backdrop,regional disparities have their own distinctive distribution pattern and evolution tendency[16].Therefore,it is necessary to further study the spatio-temporal characteristics of extreme precipitation at different regional scales in China[19].The World Meteorological Organization Commission for Climatology(WMO-CCI)proposed several core precipitation indices,including Sen's slope,linear trend rate,Mann-Kendall nonparametric test,correlation analysis,and Hurst index,which can comprehensively and systematically describe and capture the spatio-temporal variation characteristics of regional extreme precipitation intensity and frequency.These core precipitation indices have advantage of relatively weak extremes,low noise,and strong significance.
Shijiazhuang City is located in the semi-humid and semi-arid area of north China,which is an important grain-producing area and population concentration area in China.The annual precipitation is unevenly distributed,and the spatial difference of precipitation is large.The special geographical location,landform and climate conditions are the important reasons for the occurrence of extreme precipitation events in this region,which poses a great threats to the natural and social systems.Previous studies mostly focused on the changes in precipitation in Shijiazhuang City[20-21],while there are fewer studies on the temporal and spatial characteristics of extreme precipitation in Shijiazhuang City.The existing studies involve low density of meteorological stations,fewer extreme precipitation indexes,or shorter time scales,and it is difficult to comprehensively and deeply analyze the temporal and spatial characteristics of extreme precipitation events in this region.The daily precipitation data of 35 precipitation stations in Shijiazhuang City were taken.A variety of extreme precipitation indexes were selected.Sen's slope,linear trend rate,Mann-Kendall nonparametric test,correlation analysis,and Hurst index were used to analyze the temporal and spatial variation of extreme precipitation and predict the future trend of extreme precipitation in Shijiazhuang City in recent 61 years based on a variety of extreme precipitation indexes.The results will provide a scientific basis for preventing natural disasters caused by extreme precipitation events and regulating agricultural production in this region.
2 Materials and methods
2.1 Study area
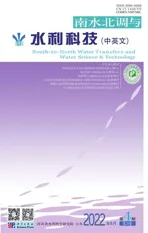
Shijiazhuang City(113°31'E~115°29'E,37°27'N~38°46'N)is located in the central and southern part of Hebei Province,China,which is one of the important central cities in the Beijing-Tianjin-Hebei region.It has 22 county-level administrative regions under its jurisdiction(Fig.1),with a total area of 14,464 km2and a total population of 11.031 2 million,making it the most populous city in Hebei Province.Shijiazhuang City straddles Taihang Mountain and north China plain.The terrain is high in the west and low in the east,and the landform is middle mountain,low mountain,hill and plain from west to east.This region is located at the eastern edge of Eurasia continent in the middle and low latitude.It has a temperate monsoon climate with distinct dry and wet periods.The annual average temperature is 13.3℃,the annual average sunshine duration is 2 514 hours,and the annual precipitation is 530 mm,mainly concentrated in June to September.
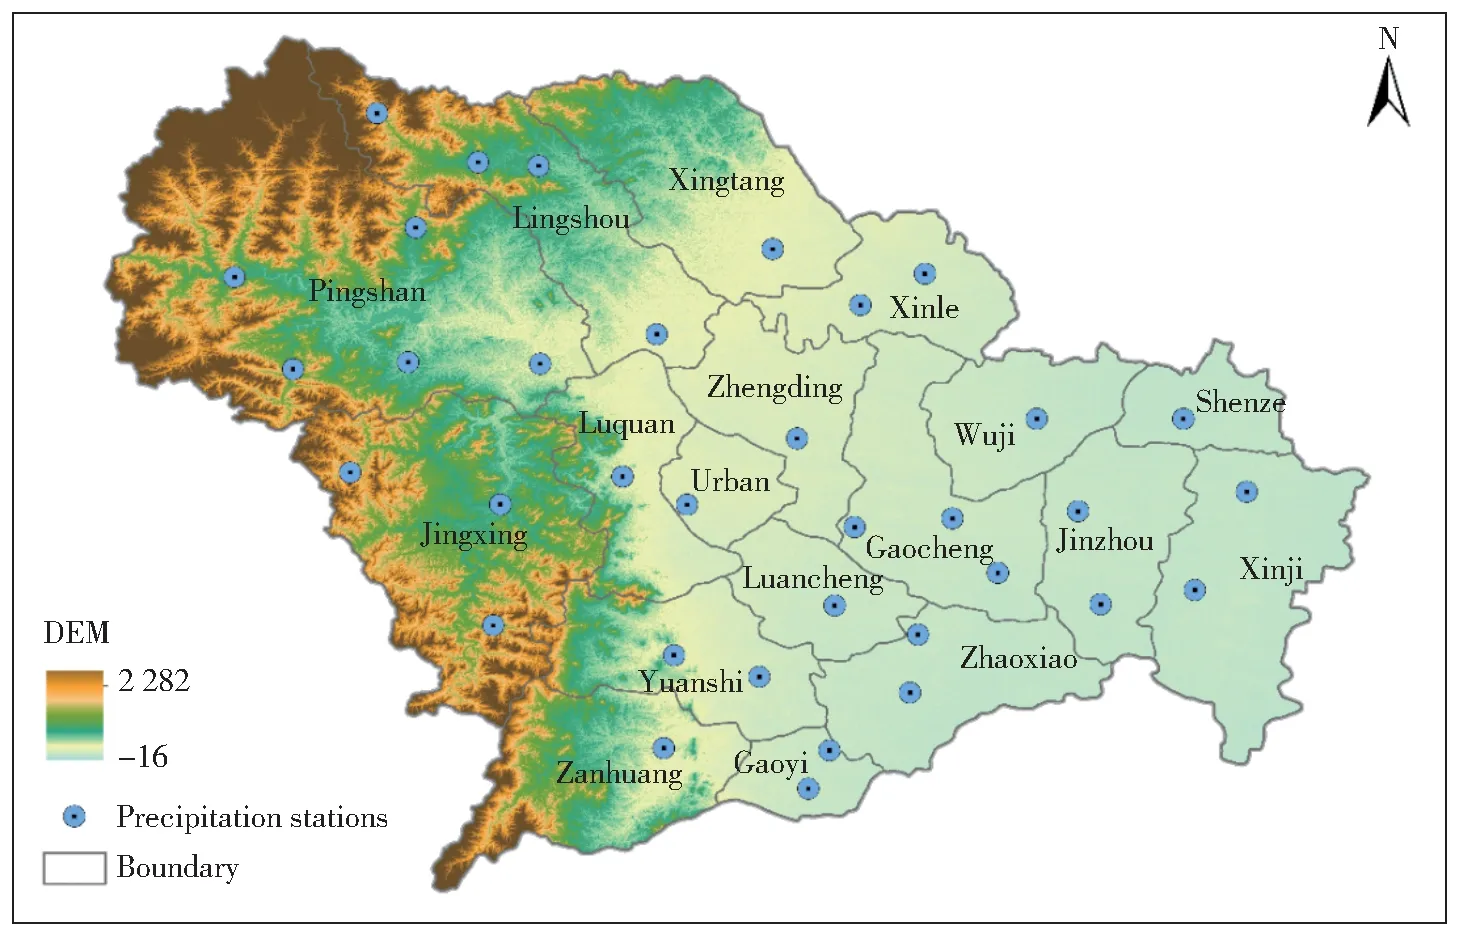
Fig.1 Shijiazhuang City and 35 precipitation stations used in this study
2.2 Selection of extreme precipitation indexes and data source
The data used are the daily precipitation dataset of 35 gauging stations from 1955 to 2015 provided by the Bureau of Hydrology and Water Resources of Hebei Province(Fig.1).The data have been strictly controlled with good integrity.At present,27 extreme climate indexes recommended by WMO-CCL and the Expert Team for Climate Change Detection Monitoring and Indices(ETCCDMI)are mainly used in extreme climate research[22].11 extreme precipitation indexes were selected to describe extreme precipitation events,including precipitation intensity index and precipitation frequency index,based on the comprehensive consideration of the distinct dry and wet climate conditions and the definition of extreme precipitation index.Among them,the precipitation intensity indexes include simple daily intensity index(SDII),maximum 1-day precipitation(Rx1 day),maximum 5-day precipitation(Rx5 day),wet day precipitation(PRCPTOT),very wet day precipitation(R95),extremely wet day precipitation(R99),and the precipitation frequency indexes include consecutive dry days(CDD),consecutive wet days(CWD),number of moderate precipitation days(R10 mm),number of heavy precipitation days(R20 mm),number of rainstorm days(R25 mm).The definitions of these 11 extreme precipitation indexes are shown in Tab.1.
Tab.1 Definitions of 11 extreme precipitation indexes
2.3 Methods
2.3.1 Trend analysis
Linear trend rate is widely used in the trend characteristics analysis of hydrological time series[23].This method is adopted to analyze the trend change and annual growth rate of extreme precipitation.The regional average value of precipitation is calculated by the arithmetic mean value of all precipitation stations in the study area.In addition,the moving average method is used to analyze the inter-annual variation of extreme climate.The trends of 11 extreme precipitation indexes on time scale are analyzed.
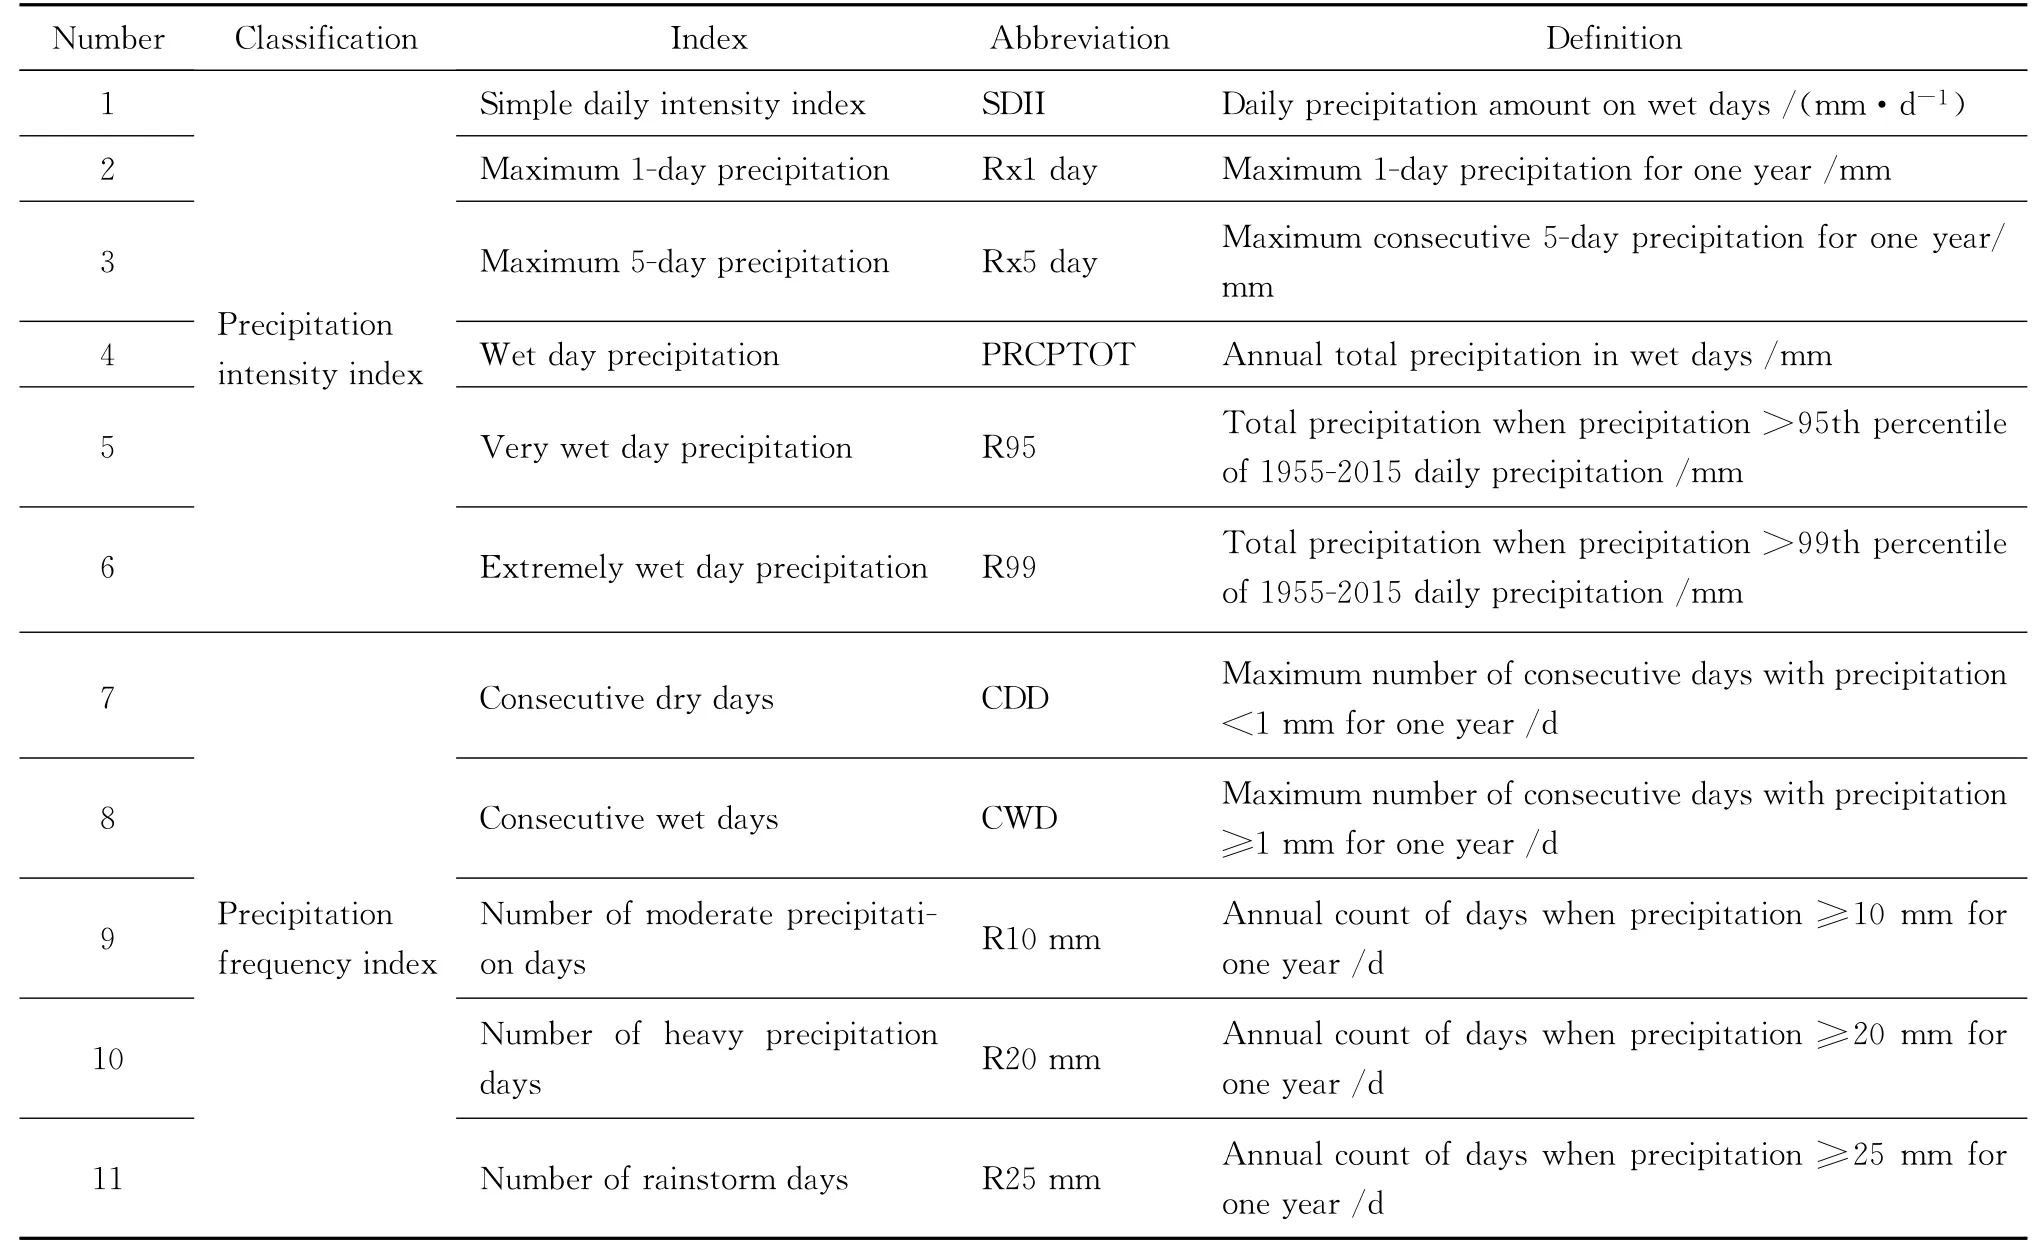
In order to quantify the spatial variation trend of extreme precipitation in the study area,Sen's slope is used to calculate the degree of time variation trend of extreme precipitation at each precipitation station in the study area.Sen's slope can avoid the influence of time series data missing and data distribution morphology on the results,and can also eliminate the interference of outliers on the time series.Assuming a time series of n statistics(x1,x2…,x n),the formula of Sen's slope is as follows:
Where Median()is the median function,βis the value of Sen's slope of extreme precipitation sequence,xiandx jare the data values of extreme precipitation index at timeiandj.βvalue reflects the degree of the trend change:β>0 indicates that the extreme precipitation index shows an upward trend;β<0 indicates that the extreme precipitation index shows a downward trend;β=0 indicates that the trend change is not obvious.
2.3.2 Mutation test
Abrupt climate change refers to the rapid change in climate from one climate state to another.Mann-Kendall nonparametric test is a method commonly used to analyze the trend change of meteorological data[24].It can not only detect the mutation point of data,but also has the advantage of showing whether the data sequence is significant.The mutation years of 11 extreme precipitation indexes in Shijiazhuang City from 1955 to 2015 are analyzed by the Mann-Kendall method combined with the slidingt-test method.
When using Mann-Kendall to perform the mutation test on the extreme precipitation sequence data,it is assumed that the cumulative number ofyi<yj(1≤j≤I)in the sequencesy1,y2,…,ynismi,and the formula for the statistic UFis as follow:
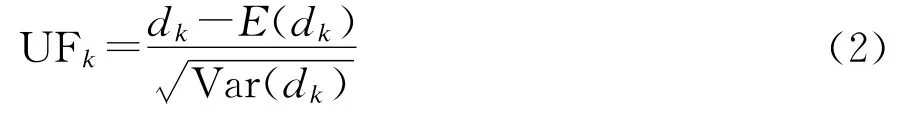
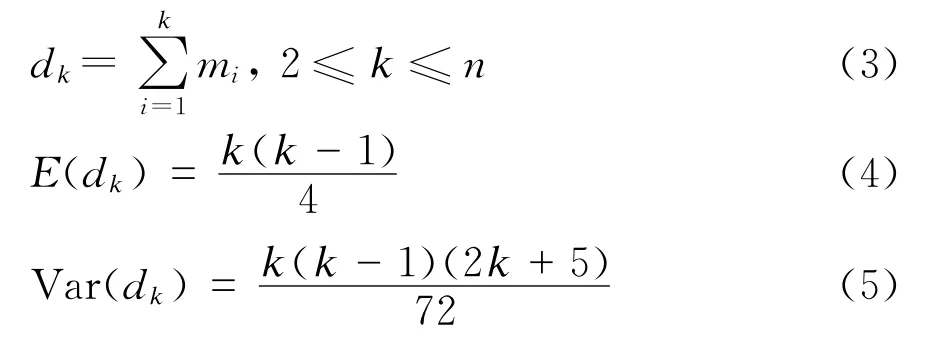
Then the extreme precipitation sequence data are arranged in reverse order,the statistic UB is calculated according to the above formula,and the statistics UF and UB are drawn into a line graph.UF>0 indicates that the extreme precipitation data series shows an upward trend,whereas the extreme precipitation data series shows a downward trend.The UF curve exceeds the range of the critical line(μ=±1.96),indicating that the trend change is significant and it is the time region where the mutation occurs.When UF and UB curves intersect and the intersection point is within the critical line,the time corresponding to the intersection point is the beginning time of the mutation of the extreme precipitation data series.
2.3.3 Trend prediction
The Hurst exponent(H)is a robust statistical method used for detecting the long-term processes in data time series using rescaled range(R/S)analysis based on fractal theory[25].It can predict the possibility of future extreme precipitation increase by obtaining the long-term memory character of the extreme precipitation indexes.For a given time series{f(t)}(t=1,2,…,n),the time series is divided intoεsub seriesx(t),and the Hurst exponent for this time series is calculated as follows:

whereR(ε)is the range sequence andS(ε)is the standard deviation sequenceR(ε)andS(ε)can be calculated as:

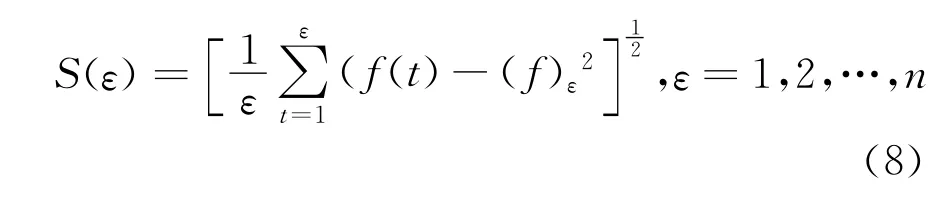
where the arithmetic mean sequence isε=1,2,…,nand the cumulative deviation is.
The value ofHranges from 0 to 1.A value ofH=0.5 means no sustainability for the extreme precipitation time series.A value of 0.50<H<1.00 indicates that the future trend of extreme precipitation is positively correlated with the historical trend.Moreover,a greater value will indicate greater sustainability for the extreme precipitation time series.A value of 0<H<0.50 indicates a trend of anti-sustainability,and a smaller value will indicate greater anti-sustainability.The sustainability classification of the Hurst exponent is shown in Tab.2.
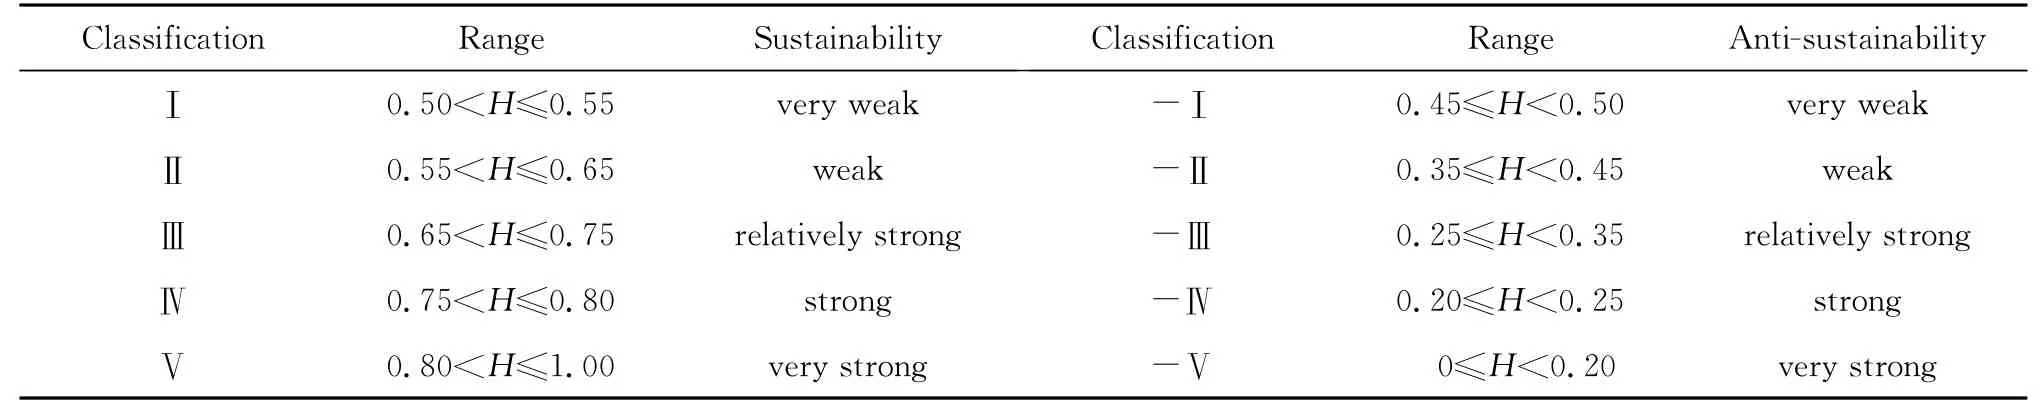
Tab.2 The sustainability classification for the Hurst exponent
3 Results
3.1 Spatial variation characteristics of extreme precipitation
3.1.1 Spatial variation trend of precipitation intensity index
Fig.2 shows the spatial distribution of Sen's slope and significance level of the trend change for the precipitation intensity indexes in Shijiazhuang City.SDII of 94.3%precipitation stations showed a decreasing trend,and only the Xinle station and Shijiazhuang station showed an increasing trend.Among them,60%of precipitation stations passed the significance test,indicating that the daily precipitation intensity in the whole region of Shijiazhuang City had a significant decreasing trend from 1955 to 2015.Rx1day of 80.0%precipitation stations showed a decreasing trend,among which 7 stations passed the significance test.Rx1day of precipitation stations concentrated in the central area of Shijiazhuang showed an increasing trend,but none of them reached the significant level of more than 90%.The Sen's slope values of Rx5day for all precipitation stations were less than 0,indicating that Rx5day of the whole region presented a downward trend,and the downward trend is significant in parts of northwest and southwest.From the trend change and the distribution of precipitation stations,PRCPTOT and R95 had similar change characteristics,with 80.0%and 85.7%of precipitation stations showing a decreasing trend,respectively,and 9 stations of them have passed the significance test of more than 95%,mainly located in the southwest and northwest of Shijiazhuang City.Whereas,PRCPTOT and R95 in Xinle County,Zhengding County,Gaocheng County and Wuji County located in the central and northern parts of Shijiazhuang City showed an increasing trend,but none of the precipitation stations pass the significance test.R99 of 88.6%precipitation stations showed a downward trend,among which 8 stations reached the significant level of more than 90%.The Sen's slope values of R99 at four precipitation stations of Xinzhuang,Xinle,Zhengding and Luancheng,were greater than 0,indicating an upward trend,but none of them passed the significance test.
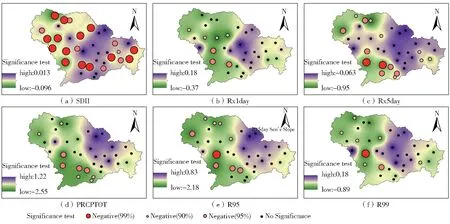
Fig.2 Spatial distribution of Sen's slope and significance level of the trend change for the precipitation intensity index
3.1.2 Spatial variation trend of precipitation frequency index
CDD of 57.1%precipitation stations showed a decreasing trend,among which CDD of Lingshou,Pingshan,Gaocheng and Wuji Counties had a significant decreasing trend.In addition,CDD of 28.6%precipitation stations presented an upward trend and CDD of 14.3%precipitation stations showed no obvious trend change.there was no obvious trend change for CWD of most precipitation stations,and only decreased in Lingshou and Xinle Counties in the north of Shijiazhuang City.R10 mm of 40%precipitation stations showed a decreasing trend,mainly distributed in the southwest and northwest of Shijiazhuang City,and the decreasing trend was significant.R10 mm of 14.3%precipitation stations showed an upward trend,mainly distributed in Xinle,Zhengding,Gaocheng and Wuji Counties.The spatial variation trends of R20 mm and R25 mm at precipitation stations were similar,and more than half of precipitation stations had no obvious trend change;42.9%and 34.3%precipitation stations respectively showed a decreasing trend,which were mainly concentrated in the southwest and northwest of Shijiazhuang City,and the decreasing trends in the regions were significant.
3.2 Temporal variation characteristics of extreme precipitation
3.2.1 Inter-annual trend analysis of extreme precipitation
The inter-annual variation of 11 extreme precipitation indexes in Shijiazhuang City showed a decreasing trend in general(Fig.4).For the precipitation intensity indexes,the overall downward trend of PRCPTOT was the most obvious,with a decline rate of 13.77 mm/10 a,followed by R95 and Rx5 day with decline rates of 11.77 mm/10 a and 10.43 mm/10 a,respectively.The average annual wet day precipitation(PRCPTOT)was 508.17 mm in Shijiazhuang City in recent 60 years.The maximum value of PRCPTOT was 991.11 mm in 1963,while the minimum value was 239.81 mm in 1972,indicating obvious inter-annual wet day precipitation variation in this study area.It can be seen from the moving average curve of PRCPTOT that the annual wet day precipitation in Shijiazhuang City showed a fluctuating downward trend.It was on the rise before the mid-1960s,and mainly on the decline in the following 10 years.After the mid-1970s,PRCPTOT showed a trend of slight fluctuation,and after the mid-1990s,it showed a trend of first decline and then rise.The five indexes of SDII,Rx1day,Rx5 day,R95 and R99 fluctuated greatly in individual years,and the maximum values all appeared in 1963,which were 18.12 mm/d,218.62 mm,609.39 mm,896.11 mm and 483.27 mm respectively.Their minimum values occurred in 2014,1965,1972,1972 and 1962 respectively.These five indexes showed similar inter-annual variation trends by their 5 a moving average curves.They were rising before the mid-1960s,and then mainly falling slightly in the following 40 years.After the mid-1990s,they turned into an upward trend within five years,and then showed a downward trend again in the 21st century.
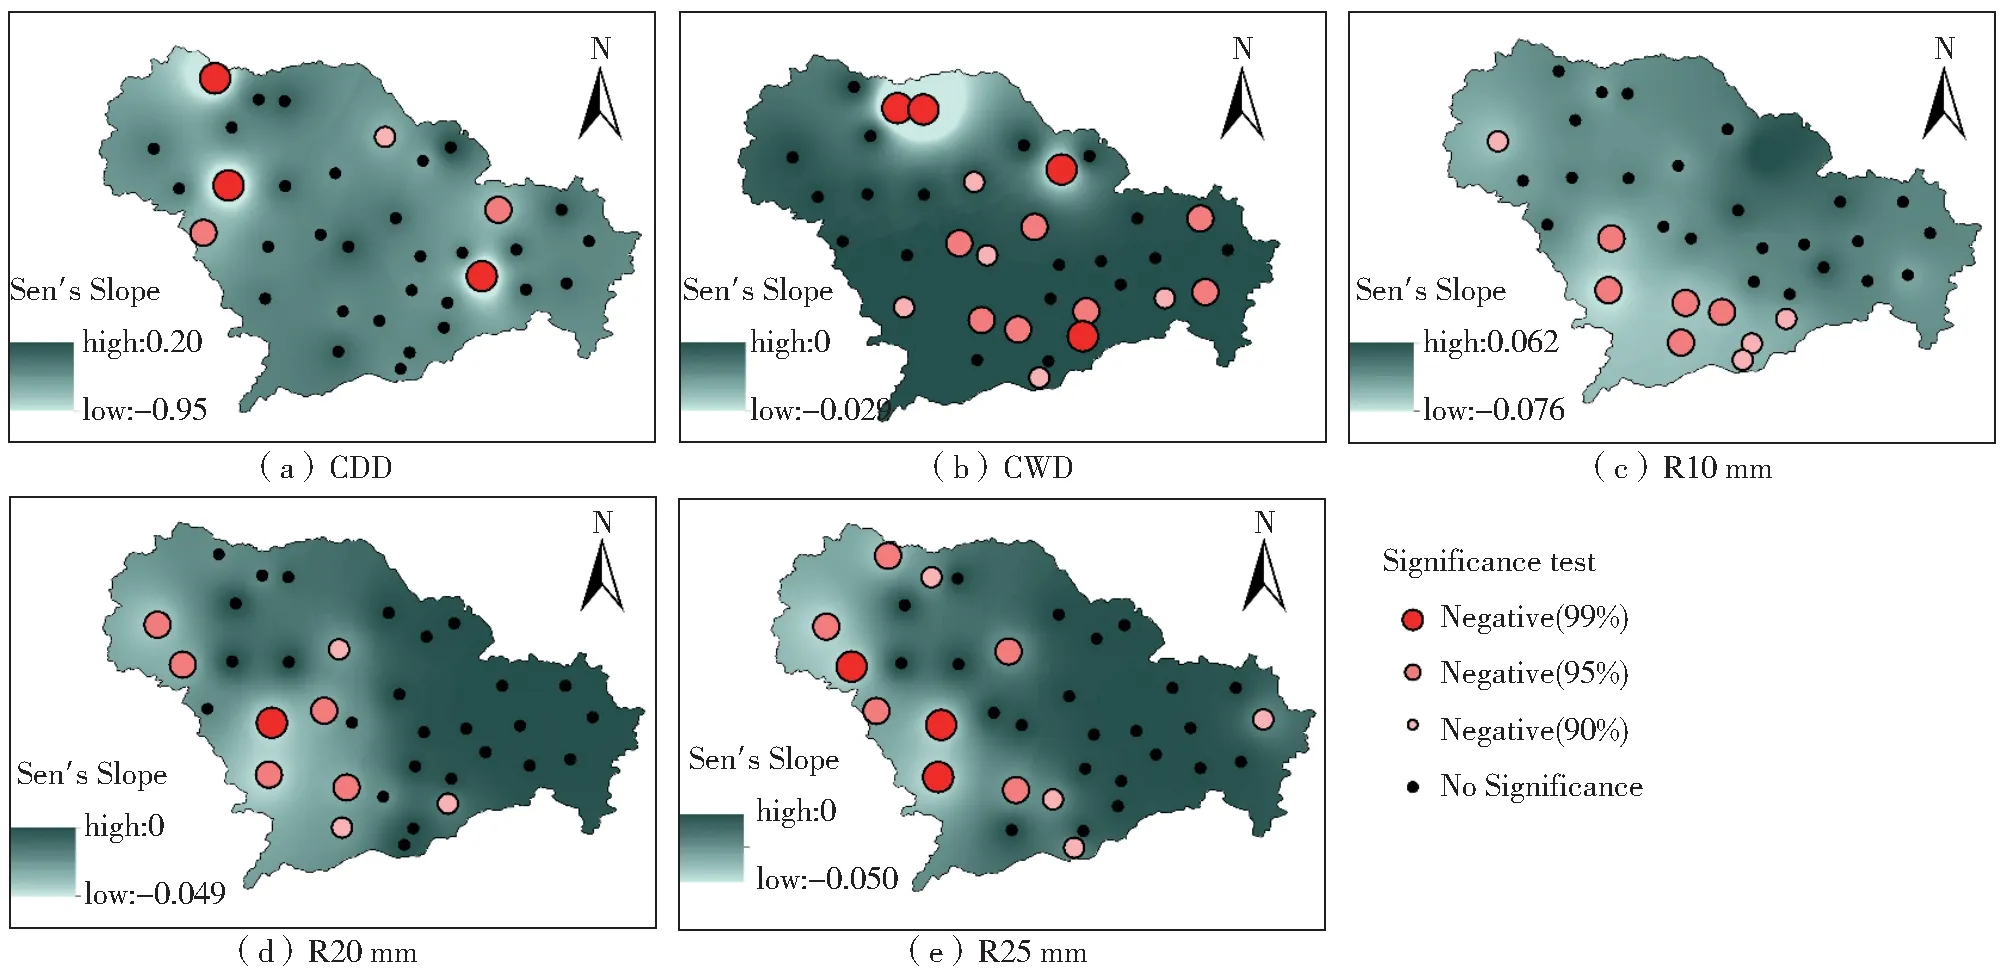
Fig.3 Spatial distribution of Sen's slope and significance level of the trend change for the precipitation frequency index

Fig.4 Trends of the study area for 11 extreme precipitation indexes by linear trend rate and moving average methods
For the precipitation frequency indexes,CDD generally showed a large downward trend,with a decline rate of 1.98 d/10 a,a maximum value of 100.49 d and a minimum value of 34.91 d.According to the 5 a moving average curve of CDD,it showed a decline before the mid-1960s,an upward trend in the following 10 years,and a downward trend from the mid-1970s to the mid-1990s.There was a fluctuating trend after the mid-1990s.The decline rate of CWD was significantly lower than that of CDD,with a maximum value of 8.34 d and a minimum value of 2.69 d,indicating the insignificant inter-annual change.According to the 5 a moving average curve of CWD,the trend was mainly upward before the mid-1960s,followed by a downward trend in the next 10 years,the upward trend in the 10 years after the mid-1970s,and a slight downward trend after the mid-1985s.The variation trends of R10 mm,R20 mm and R25 mm were similar.The maximum values of these three indexes all appeared in 1956 which were 25.00 mm,13.83 mm and 10.63 mm,and the minimum values appeared in 1972,which were 6.89 mm,2.69 mm and 1.80 mm respectively.
3.2.2 Mutation characteristics of extreme precipitation
The mutation analysis of 11 extreme precipitation indexes in Shijiazhuang City was further carried out by Mann-Kendall nonparametric test(Fig.5).The UF(positive sequence)and UB(reverse sequence)curves of some extreme precipitation indexes had multiple intersections,indicating that there were certain interference points.In order to exclude false mutations,the slidingt-test was further used to determine the mutation year.The mutation years of SDII,CDD and CWD were 1970,1963 and 1970 respectively based on Mann-Kendall mutation test.According to Mann-Kendall mutation analysis and slidingt-test,the mutation years of Rx1day and Rx5 day were 2008 and 2009,respectively.The UF and UB curves of PRCPTOT had multiple intersections.Two mutation years were finally determined for PRCPTOT by combined with the sliding t-test,namely 1963 and 2003.Although the UF and UB curves for R95 and R99 intersected at several points,no obvious mutation points were found in both R95 and R99 by slidingt-test.The UF and UB curves of R10 mm,R20 mm and R25 mm had similar trend changes,and there were multiple intersection points between UF and UB curves.Combined with the slidingt-test,the mutation time of these three indices all occurred in 2007.From the significance level,the UF curves of SDII and CDD exceeded the critical value line at the 0.05 level,indicating that the two extreme indexes had experienced a significant downward trend during the study period.In general,Rx1day,Rx5day,R10 mm,R20 mm and R25 mm mutations mainly occurred around 2008.Both SDII and CWD mutations occurred in 1970;Both CDD and PRCPTOT mutations occurred in 1963,showing a significant downward trend.In addition,PRCPTOT also mutated in 2003,showing a significant upward trend.
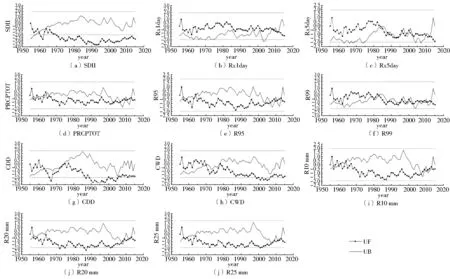
Fig.5 Mann-Kendall mutation test for time series of extreme precipitation indexes
3.3 Correlation analysis of extreme precipitation index
Previous studies have shown that the changes of annual precipitation and extreme precipitation were similar,and the correlation of extreme precipitation indexes can directly reflect the extreme precipitation[22,26].The correlation coefficients among extreme precipitation indexes are shown in Tab.3.
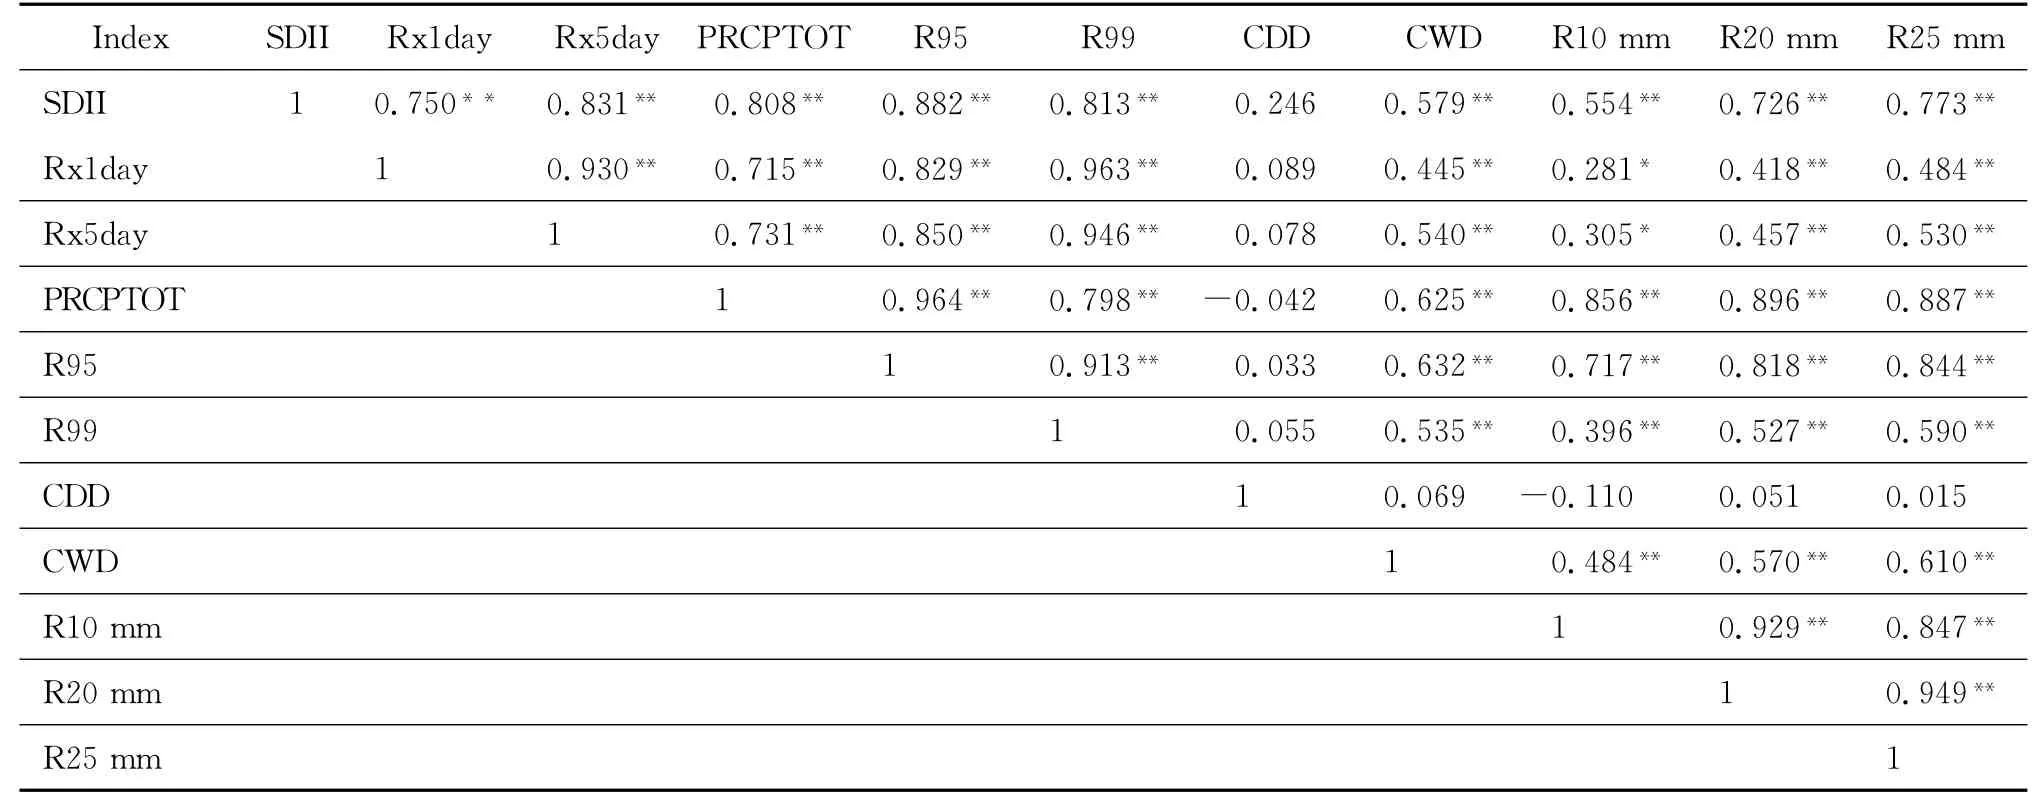
Tab.3 Correlation analysis of extreme precipitation indexes
3.4 Prediction of the future trend for extreme precipitation
The superposition of the historical trend of extreme precipitation index and Hurst index can analyze and predict the sustainability of extreme precipitation in the future.Fig.6 shows the spatial distribution of Hurst index and the spatial precipitation of sustainability for 11 extreme precipitation indexes in Shijiazhuang City.Results showed that the Hurst values of the extreme precipitation indexes in Shijiazhuang City are all above 0.50,which is consistent with the historical trend.From the Hurst values of extreme precipitation indexes at 35 precipitation stations,the four extreme precipitation indexes of PRCPTOT,Rx1day,R95 and R20 mm showed strong sustainability in the northern part of Shijiazhuang City;SDII mainly showed strong sustainability in the northeastern part of Shijiazhuang city;CWD showed strong or very strong sustainability in most areas of central and eastern Shijiazhuang City;R10 mm showed strong sustainability in some areas such as the northwest and east of Shijiazhuang City.
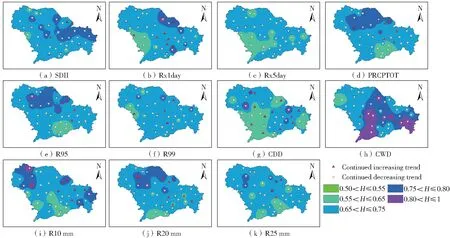
Fig.6 Future variation patterns for 11 extreme precipitation indexes
4 Discussion
Based on meteorological data and extreme precipitation index,the analysis of spatial-temporal variation characteristics of regional extreme precipitation can provide scientific basis for accurate prediction of extreme precipitation events and regional ecological management.
It can be seen from the spatial variation trend distribution of precipitation intensity indexes that there have been significant spatial differences in precipitation intensity indexes in Shijiazhuang City in the past 60 years.The western region and a small part of eastern region were dominated by a downward trend and the regions with significant declines were mainly concentrated in counties such as Pingshan,Jingxing,Zanhuang,Lingshou.The central region was dominated by an upward trend,but the trend was not significant.Combined with the spatial trend analysis of extreme precipitation intensity indexes,it was found that,except for CWD,all extreme precipitation indexes had similar spatial trend change,which could reflect the distribution and change characteristics of regional extreme precipitation,accurately analyze precipitation events,intensity change and distribution,and then reduce the risk of disasters.
It can be seen from their 5 a moving average curves that the trend was mainly downward before the mid-1970s,followed by a slight increase and then a downward trend in the following 15 years,a slight increase in the mid-1980s,a first decline and then an upward trend after the mid-1990s.The decrease range of R10 mm was slightly higher than that of R20 mm and R25 mm,indicating that the number of moderate precipitation days decreased significantly than that of heavy rain and rainstorm.Generally speaking,Shijiazhuang City had an obvious trend of aridification during the period of 1955 to 2015.
Except for the poor correlation between CDD and other extreme precipitation indexes,other extreme precipitation indexes had an extremely significant positive correlation,indicating that these extreme precipitation indexes can better characterize the extreme precipitation in Shijiazhuang City and had a good indicator effect,that is,the change of extreme precipitation in Shijiazhuang City will have a significant impact on the precipitation change.This will provide a reasonable basis for extreme precipitation process change,trend analysis and future prediction.
Combined with the historical trend of time series of each extreme precipitation index in Shijiazhuang City,it can be concluded that the extreme precipitation intensity indexes in most areas of Shijiazhuang City have a continuous downward trend,while the extreme precipitation intensity indexes in some central areas have a continuous upward trend.Except for CDD,the extreme precipitation frequency indexes in most areas of Shijiazhuang City also showed a continuous downward trend.The spatial sustainability of CDD is not obvious,in which 34.3%precipitation stations continue to rise,and 65.7%precipitation stations continue to fall.The precipitation in Shijiazhuang City will decrease in the future,and there is a possibility of drought.Timely response measures can reduce the adverse impact of extreme climate disasters on agricultural production and regional water resources management in this region.
5 Conclusion
This study analysis variation Characteristics of extreme precipitation in Shijiazhuang City,Hebei Province from 1955 to 2015.The results showed that the extreme precipitation of Shijiazhuang City generally showed a downward trend in the past 60 years,and the wet day precipitation(PRCPTOT)exhibited the most obvious downward trend.Except for SDII,CWD and CDD,the mutation years of other extreme precipitation indexes occurred after 2000.There were significant spatial differences in the trend of extreme precipitation indexes.Except for CWD,other extreme precipitation index generally presented a pattern of"southwest and northwestern regions with a significant downward trend,easternmost region dominated by a downward trend,and central region dominated by an upward trend".The regions with a significant decline were mainly concentrated in Pingshan County,Jingxing County,Zanhuang County,and Lingshou County.According to the spatial superposition of the historical trend of extreme precipitation index and Hurst index,the extreme precipitation intensity indexes in most areas of Shijiazhuang City will continue to decline in the future,and the extreme precipitation intensity indexes in some central areas will continue to rise.The extreme precipitation frequency indexes,except for CDD,showed a continuous downward trend in most areas of this study area.The results can provide a scientific basis for preventing natural disasters caused by extreme precipitation events and regulating agricultural production in this region.
On the other hand,this paper only analyzed the change characteristics of extreme precipitation in the last 60 years.The significant increase or decrease of extreme precipitation index in different periods may cancel each other after processing,resulting in the overall change trend is not significant.In the future,it is necessary to focus on more detailed analysis of the change trend after mutation.In addition,the spatial differentiation of extreme precipitation is sensitive to terrain and geomorphology,and the spatial interpolation method used does not consider the influence of terrain factors.Therefore,there may be errors in complex terrain areas,which still need to be improved.With the gradual decrease of extreme precipitation events and slight increase in the number of dry days,there is a potential drought risk in some areas of Shijiazhuang in the future.In terms of ecological construction and agricultural production activities,drought may inhibit the growth and development of vegetation and crops,or even kill them,and adversely affect the local economic development.Therefore,it is necessary to strengthen the research on vegetation drought response in the future.At the same time,the risk of drought and climate warming may also increase the risk of forest fires,and it is necessary to strengthen regional forest fire prevention.The research on the change characteristics and occurrence regularity of extreme precipitation will help relevant departments to take more effective measures to cope with the impact of climate change.