Crustal structure of the Qiangtang and Songpan-Ganzi terranes(eastern Tibet) from the 2-D normalized full gradient of gravity anomaly
2022-10-18SongaiXuanChongyangShen
Songai Xuan , Chongyang Shen
a Shanghai Astronomical Observatory, Chinese Academy of Sciences, Shanghai 200030, China b Institute of Seismology, China Earthquake Administration, Wuhan 430071 China
Keywords:Gravity anomaly Normalized full gradient Crustal structures Anomalous sources Qiangtang and Songpan-Ganzi terranes
ABSTRACT Numerous geophysical studies have revealed the lithospheric structure of the Qiangtang and the Songpan-Ganzi terranes in the eastern Tibetan Plateau. However, crust-mantle evolution and crustal response to the Indian lithospheric subduction are still controversial.Answering these questions requires additional information regarding crustal structure. In this study, the 2-D normalized full gradient (NFG)of the Bouguer gravity anomaly was used to investigate anomalous sources and interpret the crustal structure underneath the Qiangtang and Songpan-Ganzi terranes.The NFG-derived structures with loworder harmonic numbers (N = 33 and N = 43) showed that an anomalous source beneath the southern Qiangtang terrane had a characteristic northeastward-dipping shape, suggesting the northeastward motion of the crustal material induced by underthrusting Indian lithospheric mantle. The NFG images with harmonic number N = 53 showed a large-scale anomalous source in the lower crust of the transformational zone from the Qiangtang terrane to the Songpan-Ganzi terrane, consistent with thickening crust and resistance of lower crustal flow. The anomalous source demonstrated by the NFG results with harmonic number N = 71, located in the upper crust underneath the Ganzi-Yushu fault,suggested a seismogenic body of the 2010 MW6.9 Yushu event.
1. Introduction
It has been widely acknowledged that the Indian Plate penetration beneath the Tibetan Plateau after the India-Asia collision~50 Ma[1-3].However,the penetration distance of the subduction front is still debated with the options including the Bangong-Nujiang suture [2,4,5], central Qiangtang terrane [6] and north margin of the Qiangtang terrane [7,8], especially in eastern Tibet.Differences in the patterns of the subducting plate determine different responses in crustal deformation and structure [9],whereas the crustal structure can, to a certain degree, reveal crust-mantle interactions and help interpret lithospheric mantle activities, such as the mantle origin of the magmatic intrusion in the Emeishan Large Igneous Province[10].
Several models,such as lateral extrusion[1-3]and lower crustal flow [11,12], have been proposed to interpret the lithospheric evolution of the Tibetan Plateau since the India-Asia collision. In eastern Tibet, the left-lateral faults in the region of the Qiangtang and Songpan-Ganzi terranes appear to be active with several large earthquakes, including the 2010 Yushu MW6.9 event, and significant lateral extrusion of the Tibetan lithosphere controlled by the large strike-slip faults accommodating the India-Asia collision[1,2]. Multi-type geophysical and geodetic investigations have suggested differences in the lithospheric structure, deformation and temperature between the Qiangtang and Songpan-Ganzi terranes [5,9,13-17]. The complex anomalous sources existing in the crust would result from the Indian lithospheric subduction and the crust-mantle interactions [3,4]. Determining the crustal anomalous sources can contribute to understanding the deformation response to the Indian subducting lithospheric mantle and the interaction between the two terranes on the crustal scale.
The normalized full gradient(NFG)of a gravity anomaly is one of the most effective methods for interpreting crustal structure,especially for locating anomalous sources[18-22].In this work,we present NFG sections with multi-scale gravity signals based on the Bouguer gravity anomaly (BGA) from dense ground-based gravimetry of the SW-NE trending profile across the Qiangtang and Songpan-Ganzi terranes in eastern Tibet. We focused on the presentation of the crustal anomalous sources and their tectonic implications and discussed the structures related to the 2010 MW6.9 Yushu earthquake.
2. Data and method
2.1. Gravity data and analysis
We collected ground-based gravity and elevation data from the Riwoqe-Yushu-Mado gravity profile at the Institute of Seismology(China Earthquake Administration) [23]; the profile was SW-NE trending across the Qiangtang and Songpan-Ganzi terranes and intersects with the Bangong-Nujiang and Jinsha sutures,as well as the eastern Kunlun fault in the eastern Tibetan Plateau(Fig.1).The dataset of 224 measurement sites was consisted of gravity readings and geographic coordinates (longitude, latitude and elevation). 6 shared stations connected the profile with a gravity network(Crustal Movement Observation Network of China)and then linked them to the absolute gravity benchmark at Yushu station. The distances were in the range of 0.5-13.3 km(average about 3.8 km between neighboring stations)on the integrated section (Table 1).Based on the theory of traditional surveying adjustment, the accuracy of the calculated gravity values at each site was better than 33 μGal. After the corrections of normal gravity, Bouguer and terrain, the complete BGA was obtained (Fig. 2).
The BGA was in the range of-536.197 to-470.271 mGal with an average of -505.211 mGal, suggesting a thickening crust in the eastern Qiangtang and Songpan-Ganzi terranes. Some of the anomalies were obviously separated by tectonic faults,such as the Ganzi-Yushu fault (F6), the Byan Har Mountain fault (F10) and the Kunlun Mountain Pass fault(F12),and were roughly divided into 5 segments along with the about 500 km profile (Fig. 2). Apart from the fourth segment, the BGA of the other segments showed a gradual decrease with change rates are approximately -0.1 mGal/km from SW to NE for the first,second and fifth segments;however,the change rate was only -0.05 mGal/km for the third segment.Large residuals of these 4 segments(1-3,5)between the BGAs and their linear tendencies indicated lateral heterogeneity in the crust[16,24,25]. The BGA almost linearly increased approximately 40 mGal from -510 mGal to -470 mGal in the fourth segment, suggesting distinct variations in crustal thickness from the Bayan Har to the Kunlun Mountains in the northeastern Songpan-Ganzi terrane [13,14,24,26].

Fig.1. Tectonic setting and location of the gravity profile on a topographic map from ETOPO1. The gray triangles delineate the measurement sites,and the white stars are sites of deep seismic sounding. The focal mechanism solution of the 2010 Mw6.9 Yushu earthquake and the major aftershocks (red circles) are from the United States Geological Survey(https://earthquake.usgs.gov/).

Table 1 Statistical information for the measured gravity profile.
2.2. NFG method
The gravity anomaly Vzcan be expressed as the finite Fourier sine series at depth z:

The NFG method utilizes horizontal and vertical derivatives of the gravity anomaly Vz,which is expressed as the finite Fourier sine series according to Eq. (1), based on the downward analytical continuation. It minimizes the high-frequency noise of the observed gravity data and helps to determine the singular points induced by an underground anomalous source [20]. Subsequently,the geometry and location of the anomalous source can be effectively outlined from the NFG sections. The non-dimensional 2-D NFG operator GH(xi,zj) is defined as:
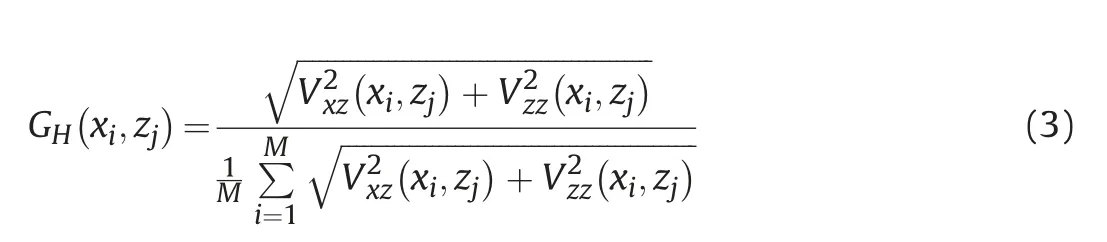
Where Vxz(xi,zj) and Vzz(xi,zj) are the horizontal and vertical first derivatives of the gravity anomaly Vzat point (xi,zj), and M is the number of the points used in the calculation. The detailed computational process of the operator GH(xi,zj) can be found in several previous studies [20,21,27].
2.3. Synthetic testing
The NFG method has been identified as an effective method for determining the location of anomalous sources in several previous studies [18-22,27,28]. Many models have been applied to test the efficiency of this method, but there is an absence of a combined model reconstructing anomalous sources at the same horizontal locations and significantly different scales and depths. Thus, to improve the understanding of the NFG method, a new model composed of two horizontal infinity prisms(lower panel shown in Fig.3a),which are orthogonal to the profile strike,was designed to test the efficiency of multi-scale anomalous source determination.The deeper prism with the larger scale denotes a relatively wide anomalous source(prism 1)in the same crustal layer,and another(prism 2) is for shallow anomalous structures. Table 2 lists the parameters of the combination model and the upper panel in Fig. 3a shows the calculated gravity anomaly.
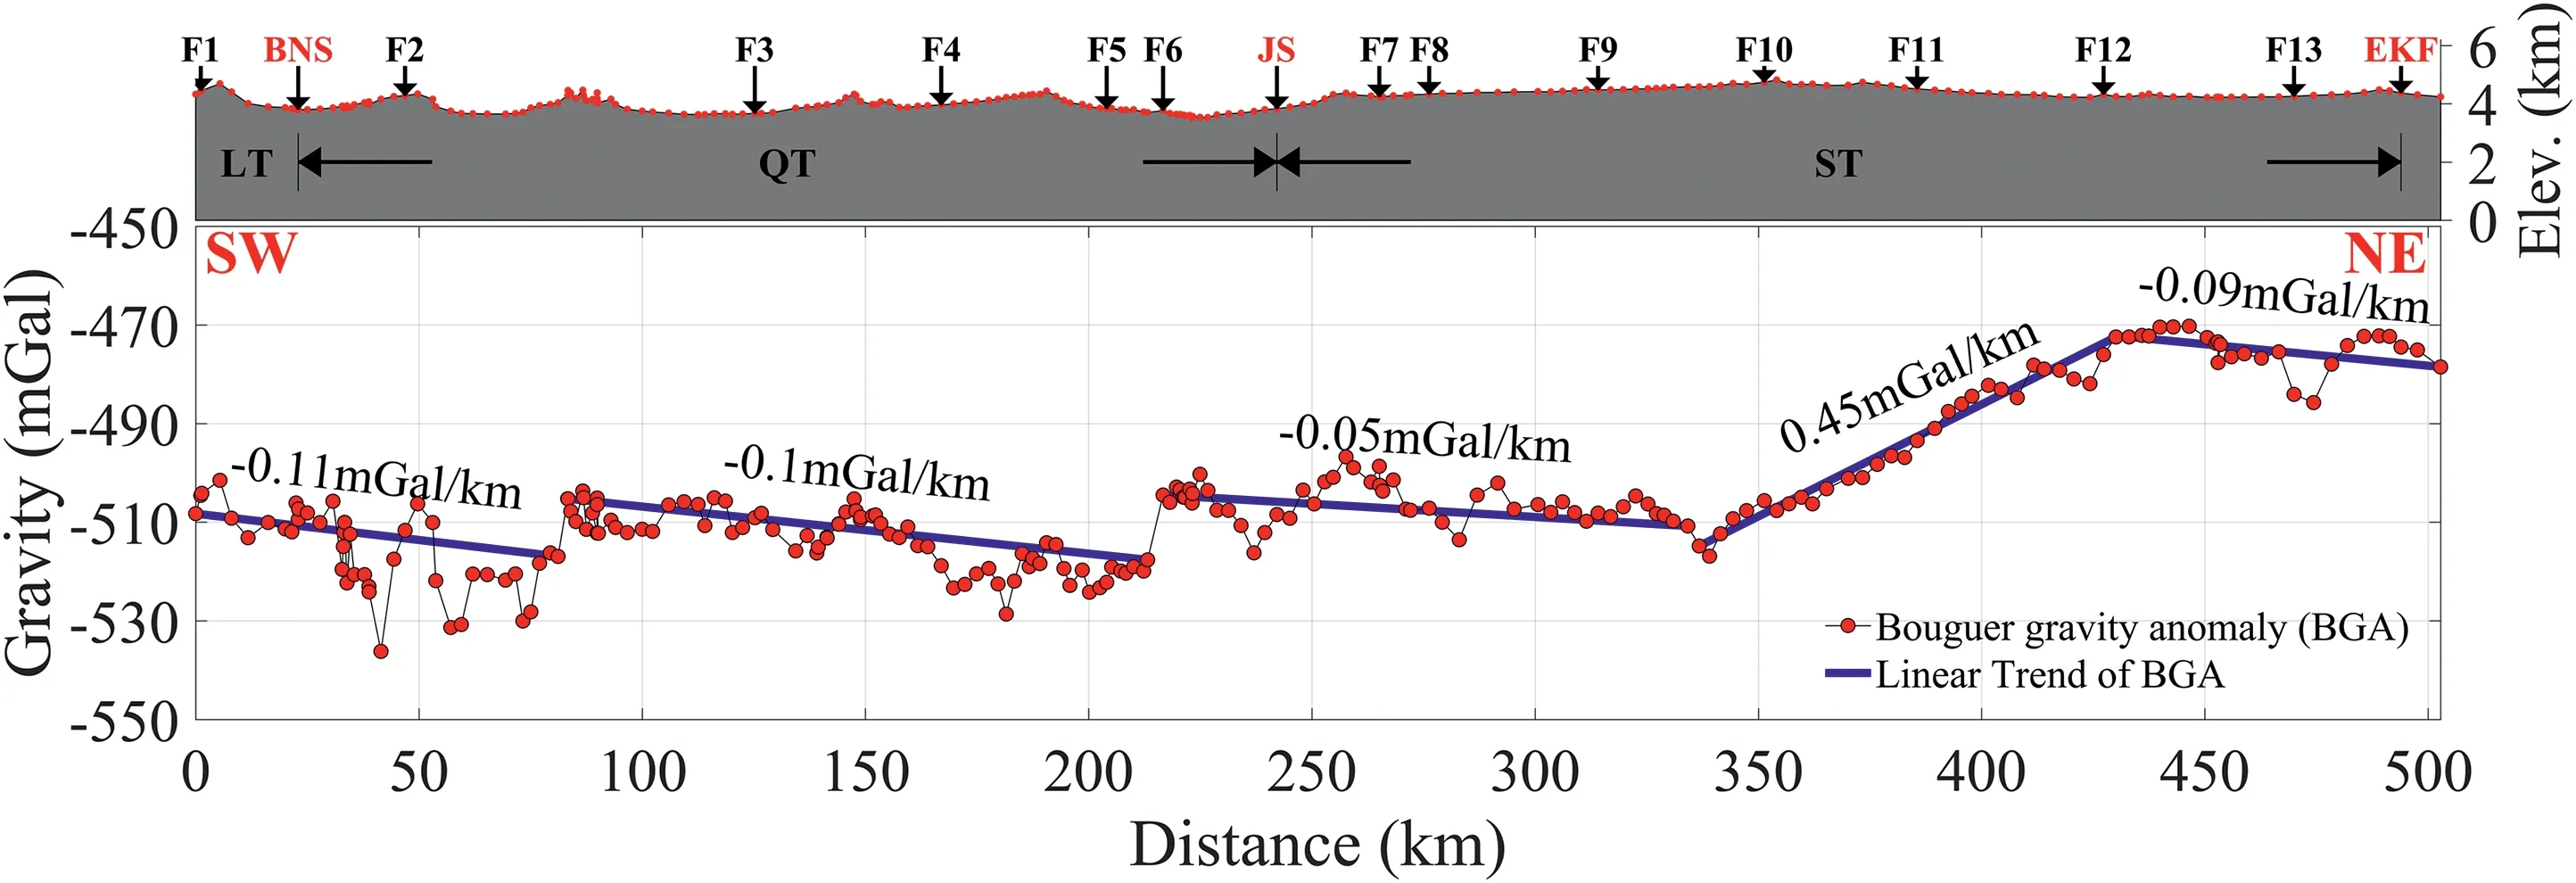
Fig. 2. Elevation and Bouguer gravity anomaly(BGA).The thick blue lines denote the linear trend of the BGA for five segments; the change rates from southwest to northeast are also presented.LT,Lhasa terrane;QT,Qiangtang terrane;ST,Songpan-Ganzi terrane;EKT,Eastern Kunlun terrane.The thick red lines indicate the boundaries of geological block or sutures: Bangong-Nujiang suture(BNS), Jinsha suture(JS)and East Kunlun fault(EKF). The thin black lines indicate major faults: F1,Nujiang fault;F2,Langcang fault;F3,Zhanaqu fault;F4,Zigasi fault;F5,South of Fenghuo Mountain fault;F6,Ganzi-Yushu fault;F7,Wudaoliang fault;F8,Chumaerhe fault;F9,Qingshuihe fault;F10,Bayan Har Mountain fault;F11, Dari fault; F12, Kunlun Mountain Pass fault; F13, Maduo fault.

Fig. 3. (a) Test model with two horizontal infinite prisms (lower panel) and their gravity anomalies (upper panel). (b) and (c) NFG results of the combined model for N = 63 and N = 315, respectively, (d) the prism 1 only for N = 125, and (e) the prism 2 only for N = 280.
After testing a large quantity of harmonic numbers, the NFG image when N = 63 (Fig. 3b) was accepted as the first result. Two symmetric NFG maxima(NFGMax)were present at approximately 26 km depth and located on the upper edge of prism 1;the distance between them was approximately equal to the length of this edge.Although the lower edge could not be identified clearly,the center is approximately located at the gradient belt between the high and low NFG values. At this stage, the model could not locate prism 2 because of a lack of NFG evidence.The second interesting result was that NFGMax coincided with the center of prism 2 and the depth was then located. Although the size of prism 2 could not be determined directly,a small-scale anomalous source was identified from the NFG range.Therefore, the NFG method distinguished the anomalous sources with different scales and depths by using various harmonic numbers (i.e., the different wavelengths of thegravity signals). To further characterize the NFG results of the two prisms separately,we also imaged the NFG results from the gravityonly induced by each prism(Fig.3d and e).Fig.3d for prism 1 shows two symmetric NFG maxima located at about 30 km depth,and the distance between them was approximately equal to the length of prism 1,which had a selected N greater than the combined model.In contrast to the combined model,the NFG minima were under the two NFGMax as a result of the effects of prism 1.In other words,the NFG result with two NFGMax was characteristic of an anomalous source with a large horizontal scale.For prism 2 only,the NFGMax coincided with the center of prism 2 from the NFG result when N = 280 (Fig. 3e). In summary, the anomalous sources with different horizontal scales presented different NFG characteristics.We concluded that the complex crustal structure is not bounded by one optimum harmonic number (OHN) in field applications.
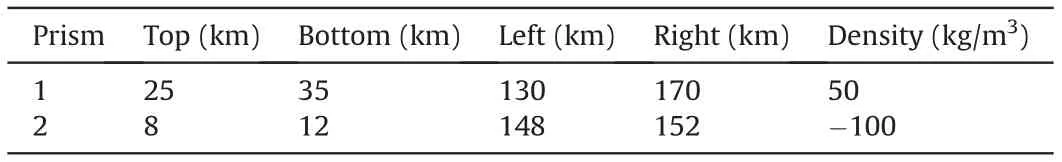
Table 2 Parameters of the testing model.
3. Results
We first obtained the BGA data of the profile with a 2-km horizontal interval using cubic interpolation method, and then the same 2 km as the horizontal interval is taken as the depth interval of the downward continuation. The second-order polynomial was taken as the regional anomaly and removed from the BGA during the NFG calculation. The NFG results strongly depended on the harmonic number of the Fourier series; therefore, the OHN selection was essential for determining the anomalous sources, similar to the testing model.To choose OHNs effectively,we not only used the curve depicting the relationship between NFGMax and the harmonic number N [27], but also introduced the quantity Er[29],which was defined as the energy proportion between the reconstructed and original anomaly:

Where Ereca(N) is the energy of the reconstructed anomalies with the harmonic number N, and Eoriais the energy of the original anomaly.According to the Ercurve and the relative maxima of the NFGMax shown in Fig.4,we used 33,43,53 and 71 as the OHNs for interpretation of the multi-scale wavelength of the gravity signal.The lower order OHN was applied, and the longer wavelength of the gravity signal was reconstructed to determine the larger scale buried anomalous source, while the higher order OHN was the opposite.
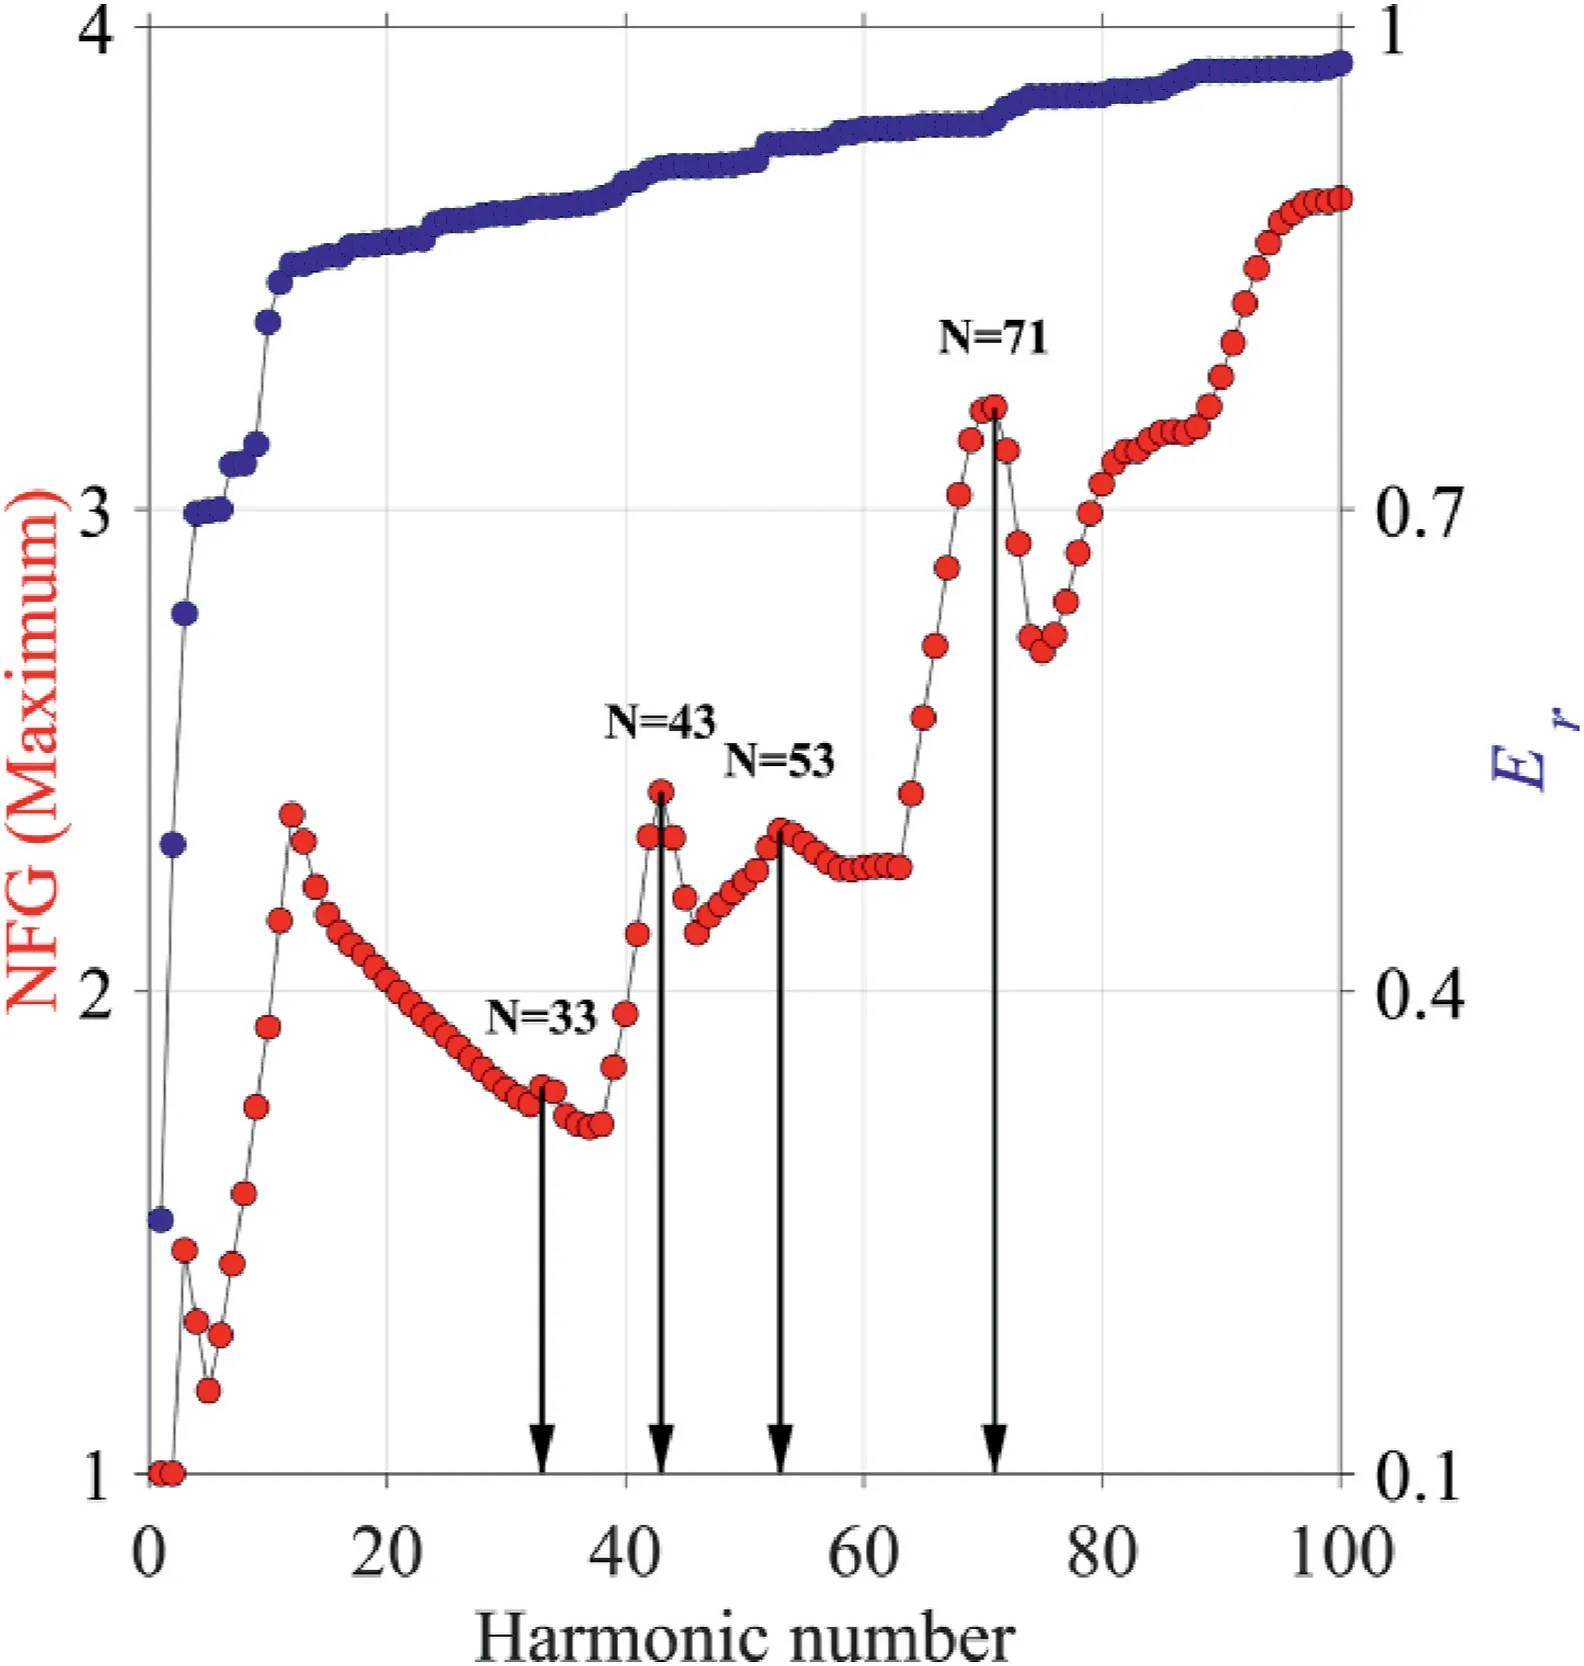
Fig. 4. NFG maximum (red circles) and Er (blue circles) versus the harmonic number from 1 to 100.
The NFG image when N = 33 (Fig. 5a) represented the crustal structure related to the gravity signal of the long wavelength,and three regions with relatively high NFGs appeared in this section,which suggests three anomalous sources: the northeastwarddipping anomaly from the Bangong-Nujiang suture to the Zhanaqu fault (F3), the vertically distributed anomaly between the Deqin fault (F4) and Ganzi-Yushu fault (F6) and the shallower anomaly located at approximately 340-450 km along with the profile. The buried depth of the anomalies in the Qiangtang terrane crust is deeper than the Songpan-Ganzi terrane. In terms of the gravity anomaly residuals (Fig. 2), the first northeastwarddipping anomaly may be partly melted material with high temperature and low density caused by post-collisional magmatism in the southern Qiangtang terrane [30-32]. This is consistent with lithospheric downwelling near the Bangong-Nujiang suture[2,4-6], which inevitably would be dragged by the subducting Indian lithosphere. However, the subducting effect may be bounded by the large-scale Ganzi-Yushu strike-slip fault, which cuts through the crust, as suggested by the second anomaly.Lateral heterogeneity of the lower crust was not recognized underneath the Songpan-Ganzi terrane from the low-order Nderived NFG results; however, the third anomaly in the upper crust may suggest a gradual thickening of the crust (1-3 km)from SW to NE, as it is inferred from the deep seismic sounding data (red circles between 20 and 30 km shown in Fig. 5).
The crustal structures related to the gravity signals of the middle wavelength are demonstrated by the NFG images when N = 43 and N = 53 (Fig. 5b and c). The most distinct anomalous sources inferred from the two NFG images were located in the lower crust and uppermost mantle underneath the Jinsha suture near the site with downwelling Moho (red circles between 60 and 80 km in Fig.5)and low electrical resistivity[32],which may result from lower crustal flow [11,34] or underplating beneath the Jinsha suture [4]. The vertical scale of the NFG-derived anomalous source when N = 53 (Fig. 5c) was larger than N = 43 (Fig. 5b) and the NFGMax of the former (Fig. 5c) was deeper than the latter (Fig. 5b). The northeastward-dipping anomaly between the Bangong-Nujiang suture and the Zhanaqu fault (F3) was present almost completely in the upper crust(Fig. 5b). However, it changed into two independent anomalies when N = 53 (Fig. 5c). The first one was under the Bangong-Nujiang suture and another one at a distance of about 75 km.Similar characteristics appeared between the Deqin (F4) and Ganzi-Yushu (F6) faults, where the NFG anomaly changed from the upper crust (Fig. 5b) into two parts near the boundary of the upper and lower crust(Fig.5c).The Deqin and Ganzi-Yushu faults should be the SW and NE boundaries of this anomalous source with low velocity[16], which agrees with but is deeper than that shown in Fig. 5b. The focus of the 2010 MW6.9 Yushu earthquake was located at the NE boundary of this anomalous source, suggesting an earthquake-related structure. In the northeastern Songpan-Ganzi terrane, the shallow NFG anomalies (Fig. 5b and c) corresponded to the Bayan Har (F10), Dari (F11) and Kunlun Mountain Pass (F12) faults. There existed an NFG anomaly(N = 43) between the Kunlun Mountain Pass (F12) and Maduo(F13) faults in the lower crust (Fig. 5b), corresponding to a lowvelocity source [16], but this was absent in the NFG result when N = 53 (Fig. 5c).
If the NFG anomaly near 50 km in the lower crust is ignored because of the boundary effect,the most significant NFG anomaly when N = 71 was beneath the Ganzi-Yushu fault (F6), SW of the Jinsha suture(Fig.5d),which agrees with the high velocity in the upper crust [35]. The NFGMax was located at a depth of approximately 10 km and 20 km away from those with N = 43(Fig. 5b) and N = 53 (Fig. 5c), indicating NFG results from different anomalous sources; the former was in the upper crust and the latter two were located in the lower crust to the uppermost mantle. The focus of the 2010 MW6.9 Yushu earthquake was located near the relative NFGMax, suggesting the location of the seismogenic body. An alternative interpretation with the relatively high NFG beneath the Deqin fault (F4) is similar to the horizontal prism shown in the synthetic testing (Fig. 3b and d),which may suggest a horizontal anomalous source of about 60 km from SW to NE in the upper crust [16]. Analogously, a horizontal anomalous source was possibly present between the Bangong-Nujiang suture and about 70 km along the profile in shallow crust, centered underneath the Langcang fault (F2). In addition, the small-scale NFG anomalies in the upper crust at distances of approximately 160, 330, 370 and 430 km basically correspond to the Deqin (F4), Bayan Har Mountain (F10), Dari(F11) and Kunlun Mountain Pass (F12) faults, respectively.
4. Discussion
Numerous geophysical structures (e.g., velocity and electrical structures) beneath the Qiangtang and Songpan-Ganzi terranes provided significant evidence for subducting Indian lithosphere[4,7,30], lower crustal flow [33,36] and thickening Tibetan crust[13,14,24-26]. Our NFG-derived crustal structures (Fig. 5) showed 3 major anomalous sources along with the gravity profile: the dipping structure underneath the Bangong-Nujiang suture, and the large-scale anomalous source under the Jinshan suture in the lower crust and the small-scale anomalous source around the seismic focus of the 2010 MW6.9 Yushu earthquake. Apparently,some NFG anomalies with different N values may illustrate identical sources [18], such as the northeastward-dipping anomalous source underneath the southern Qiangtang terrane(Fig.5a and b).
One of the more accepted interpretations is that Indian lithospheric underthrusting is the major driving force of tectonic movement on the Tibetan Plateau [2,5]. Generally, the lowtemperature Indian lithosphere [32] would retain its mineralogy and strength; therefore, it can extend hundreds of kilometers beneath the Plateau from the Himalayas to the Bangong-Nujiang suture [2,4-8,30]. Correspondingly, the generated northward thrust during extension would deform the overlying crust with northward displacement, the NFG-derived northeastward-dipping anomalous source underneath the Bangong-Nujiang suture (Fig. 5a and b) agrees with this inference. The absence of dipping structures in the northern Qiangtang and Songpan-Ganzi terranes in our results may be related to the large angle subduction-slab [7,8]. Our results support the possible scenario that the Indian lithospheric mantle penetrates as far as the southern or central Qiangtang terrane [2,4-6], but cannot confirm the shallow-angle subduction model underneath the eastern Qiangtang terrane [9].
Additionally, the lower crust in the transitional zone between the Qiangtang and Songpan-Ganzi terranes[13,14,24-26]implied a different crustal structure between the SW and NE tectonic units of the Jinsha suture.The NFG images illustrated the complex structure in the Qiangtang terrane and relatively simple structure in the Songpan-Ganzi terrane (Fig. 5), which corresponds to the weak or lack of radial anisotropy distributed across the Qiangtang terrane and strong anisotropy through the Songpan-Ganzi terrane [9].Lower S-wave velocity and high Poisson's ratio [37], as well as lower resistivity/higher conductivity in the crust of the Qiangtang terrane[38]suggest partial melting,but this is absent beneath the Songpan-Ganzi terrane [13]. A possible scenario is that the flow direction of the lower crust changed from northward to eastward[36,39]. If this was true, the NFG-derived anomalous source in the lower crust underneath the Jinsha suture(Fig.5b and c) should be an obstacle to the northward lower crustal flow, so that the large strike-slip Ganzi-Yushu fault (F6), the western segment of the Xianshuihe-Xiaojiang fault system,is more likely the north margin of the flow channel. It should be noted that the higher effective elastic thickness compared with adjacent regions[40]also suggests the presence of a strong lithospheric mantle, which is indispensable for large vertical loadings where the NFG-derived anomalous source corresponds to high velocity[16].As a consequence,our NFG results suggest that the Ganzi-Yushu fault (F6) can be considered the north margin of the crustal channel flow [11,12,34] and the obstacle may be the high-velocity anomalous source between the Ganzi-Yushu (F6) and Chumaerhe (F8) faults [13].
The left-lateral strike-slip Ganzi-Yushu fault(F6)appears to be one of the most active faults of the Tibetan Plateau, with several large historical earthquakes along with it, including the recent 2010 Yushu MW6.9 event. An anomalous body with the low velocity at the bottom of the upper crust beneath the Ganzi-Yushu fault [16] coincides with the anomalous source derived from the NFG result when N = 71 (Fig. 5d), may be inferred as the seismogenic body of the 2010 Yushu event. Our results distinguished the seismogenic body from the crustal transitional zone between the crust of the Qiangtang and Songpan-Ganzi terranes. Upper crustal deformation should be partly decoupled from the motion of the lower crust due to the existence of the lower crust flow[11,12,34], so that the partitioning of strain observed at the surface may not extend completely to the lower crust [2]. Although the Ganzi-Yushu fault (F6) may cut the crust down to the Moho,earthquakes are more likely to occur in the brittle upper crust than in the ductile lower crust. The seismogenic body inferred from NFG images (Fig. 5d), located over the boundary of the crustal flow (Fig. 5c), implies a difference in velocity movement between the two terranes, which has also been suggested by surface observations [17]. The development of a seismogenic body is suggested by the different velocities between the upper and lower crust induced by partial decoupling, eastward movements of the lower crust in the Qiangtang terrane and absence in the Songpan-Ganzi terrane [33].
Fig. 6 shows the diagrammatic representation of our NFGderived subduction-related, crustal flow-related and earthquakerelated structures, which correspond to NFG anomalies with horizontal and vertical scales ranging from a few kilometers to dozens of kilometers(Fig.5).Northward thrusting of the Indian lithosphere is considered the major driving force to the south,where the crustal material with northward movement changes direction eastward because it is induced by resistance[38]or subduction of the Asian lithosphere to the north[4],which allows for thickening crust and lower crustal flow direction changes.The lower crustal flow and its changing direction are resisted by the Songpan-Ganzi terrane[13];this,along with the inferred different velocities between the upper and lower crust in the Qiangtang terrane,may suggest the tectonic environment of the 2010 Yushu earthquake.
5. Conclusions
In this study, we presented NFG images from BGA data with different harmonic numbers along a gravity profile across the Qiangtang and Songpan-Ganzi terranes, and multi-scale crustal structures based on the NFG results were investigated. Our results,although not quantitative, provided useful information on three crustal structures. First, a subduction-related structure in the southern Qiangtang terrane was derived from the dipping NFG anomaly with lower order harmonic numbers, which results from the northward subduction of the Indian lithospheric mantle.Second,an anomalous source with a horizontal scale of about 150 km in the lower crust beneath the Jinsha suture, corresponding to thickening crust, was demonstrated by the NFG result with harmonic number N = 53. This source probably resisted the northward movement of lower crustal material. Finally, an anomalous source from the NFG image with harmonic number N = 71 in the upper crust under the Ganzi-Yushu fault was consistent with the focus of the 2010 Yushu MW6.9 earthquake and indicated the seismogenic body of this event.

Fig. 6. Diagrammatic cross-section of the crustal structure in the Qiangtang and the Songpan-Ganzi terranes, eastern Tibet. The red arrows indicate the thrusting direction of the Indian lithosphere, and the blue arrows indicate the direction of movement of the Tibetan crust. Abbreviations are as those shown in Fig. 2.
Conflict of interest
The authors declare that they have no competing interests.
Acknowledgments
We would like to thank Associate Editor Dr.Zhou Yiyan and two anonymous reviewers for their constructive and helpful reviews.This study was financially supported by the National Natural Science Foundation of China (Grant No.42074090).
杂志排行

Geodesy and Geodynamics的其它文章
- A new polar motion prediction method combined with the difference between polar motion series
- Insights into spatio-temporal slow slip events offshore the Boso Peninsula in central Japan during 2011-2019 using GPS data
- Local seismic hazard map based on the response spectra of stiff and very dense soils in Bengkulu city, Indonesia
- Coastal transgression and regression from 1980 to 2020 and shoreline forecasting for 2030 and 2040, using DSAS along the southern coastal tip of Peninsular India
- Thermospheric density responses to Martian dust storm in autumn based on MAVEN data
- Possibilities of mapping neotectonic elements based on the interpretation of space images: A study of Fergana Depression