A modified heuristics-based model for simulating realistic pedestrian movement behavior
2022-09-24WeiLiWang王维莉HaiChengLi李海城JiaYuRong戎加宇QinQinFan范勤勤XinHan韩新andBeiHuaCong丛北华
Wei-Li Wang(王维莉) Hai-Cheng Li(李海城) Jia-Yu Rong(戎加宇)Qin-Qin Fan(范勤勤) Xin Han(韩新) and Bei-Hua Cong(丛北华)
1Institute of Logistics Science and Engineering,Shanghai Maritime University,Shanghai 201306,China
2Shanghai Institute of Disaster Prevention and Relief,Tongji University,Shanghai 200092,China
Keywords: heuristics-based model,lane formation,pedestrian flow,potential collisions
1. Introduction
Walking is one of the most basic transportation modes.Pedestrians need to interact with environmental obstacles and other pedestrians during walking. Pedestrian dynamics has thus received increasing attention from various fields, including building evacuation,[1]transportation engineering,[2]safety management of large events,[3]urban design,[4]etc.Empirical study and computer modeling of pedestrian movement under various conditions have been conducted to explore the mechanism and phenomenon of pedestrian dynamics in the past few decades. In terms of empirical study, field surveys and controlled laboratory experiments were conducted to collect pedestrian movement data. Moreover, collective pedestrian flow behavior can be revealed and illustrated by several basic indicators of pedestrian flow features, such as the fundamental diagrams demonstrating the relationship between pedestrian density and movement velocity or flow rate.[5]
With continuous innovations by researchers,a large number of pedestrian traffic simulation models have been developed. Earlier attempts at modeling pedestrian dynamics at a macroscopic level, which lacks pedestrian heterogeneity and individual behavior.[6]According to different representation methods of space and time,microscopic pedestrian traffic simulation models can be divided into discrete models and continuous models. With these models, many pedestrian flow phenomena such as lane formation, the crowd passing through a bottleneck,the crossing pedestrian flow at intersections can be demonstrated. Representatives of discrete models include the cellular automaton (CA) model[7-10]and the lattice gas (LG)model.[11-13]The social force model(SFM)is the most recognized one in the continuous pedestrian traffic simulation models. The original social force model was proposed by Helbing and Molnar,[14]in which pedestrians are self-driven particles subjected to Newtonian mechanics. By perceiving and responding to the surrounding environment, the interactions between pedestrians and environment are described by various forces, including the self-driving force, psychological repulsive force and physical contact force. Since the pedestrians are under relatively low density in the original SFM,the escape panic version was then proposed,in which the normal contact force and tangential sliding friction force were considered.[15]Owing to the deficiency of the original SFM, some improvements of the SFM have been put forward to improve the computation efficiency and generate more realistic pedestrian behaviors, such as detour and self-stopping.[16-18]For a comprehensive review of SFM and the improvements of models,readers may refer to Ref.[19].
Practically, pedestrians change the moving velocity according to intelligent collision prediction. Moussaıdet al.[20]proposed the heuristics-based model to replace the original SFM, which can reproduce pedestrian behaviors more accurately. Because of the good performance and simple rules,the heuristics-based model has attracted increasing attention in recent years.[21-26]Although the model has been widely applied, there remain deficiencies in theory and also in practical applications. To overcome the deficiency that the original heuristics-based model fails to reproduce lane formation in the dense crowds, Guoet al.[27]proposed an improved model by modifying the objective function of the target direction. Simulation results of pedestrian flow in a ring-shaped corridor accord with the experimental results. Wang and Shen[28]expressed self-driven forces through static friction in their modified model,which solves the theoretical problem of neglecting contact force’s influences on pedestrians’psychology and the application problem of the unrealistic backward motion of the last people repulsed by the preceding one.
Pedestrians may make evading decisions in advance according to the empirical observations,[29,30]that is, potential collisions should also be detected and considered in moving path choice. In the study of Liet al.,[31]a pedestrian identifies a potential conflict and responds to it as soon as the pedestrian with potential risk appears in the “response ranges” of the subject pedestrian. The scenario was simulated by an improved SFM where the long-range conflict avoidance force was introduced. Similarly, to realistically represent pedestrians’ collision avoidance behavior, both time headway and time-to-collision were viewed as indicators of potential collisions, and the corresponding social forces are active if any one of the indicators reaches thresholds.[32]However,only the first collision on the chosen path was considered in the original heuristics-based model,pedestrians were short-sighted. In this paper, by modifying the cognitive heuristics, more realistic pedestrian movement behavior can be simulated and the dynamic process of lane formation in bidirectional flows with high density can be reproduced.
The remainder of this paper is organized as follows. Section 2 presents the modified heuristics-based model. In Section 3, the influence of parameters adjustment on model performance is analyzed by a series of simulations in typical scenarios. In Section 4,the model is validated by comparing the density-velocity relationship with empirical data and reproduction of lane formation phenomenon in bidirectional flows with high density. Finally, in Section 5 some conclusions are drawn from the research findings in the present work.
2. Heuristics-based pedestrian simulation model
In the original heuristics-based model proposed by Moussaidet al.,[20]pedestrian movement was mainly simulated by self-driven force under normal conditions. The direction and magnitude of the desired velocity are two key components determined by two heuristics based on the visual information of pedestrians. The first heuristics determines the desired velocity direction,concerning the trade-off between avoiding obstacles and minimizing detours from the most direct route. The second heuristics determines the desired velocity magnitude,representing the distance from the nearest obstacle in the selected walking direction that ensures a certain time to avoid collisions. In the case of overcrowding,unintentional force affects pedestrian movement in addition to the self-driven force.The force results from physical interactions of this pedestrian with other pedestrians and environmental walls. In this model,pedestrianiis regarded as a circle with radiusri,and the mass ismi. The combination of cognitive heuristics and contact forces accounts for complex collective pedestrian dynamics,represented as

wherevdesandviare desired velocity and current velocity of the pedestriani,τis the relaxation time for adapting movement behavior to avoid collisions,fijis the contact force between pedestrianiand the neighboring pedestrianj, andfiwis the contact force between pedestrianiand obstaclew. In our modified heuristics-based model, the pedestrian movement is still controlled by the self-driven force and contact force. However,the self-driven force is reformulated in more detail as follows.
2.1. Self-driven force
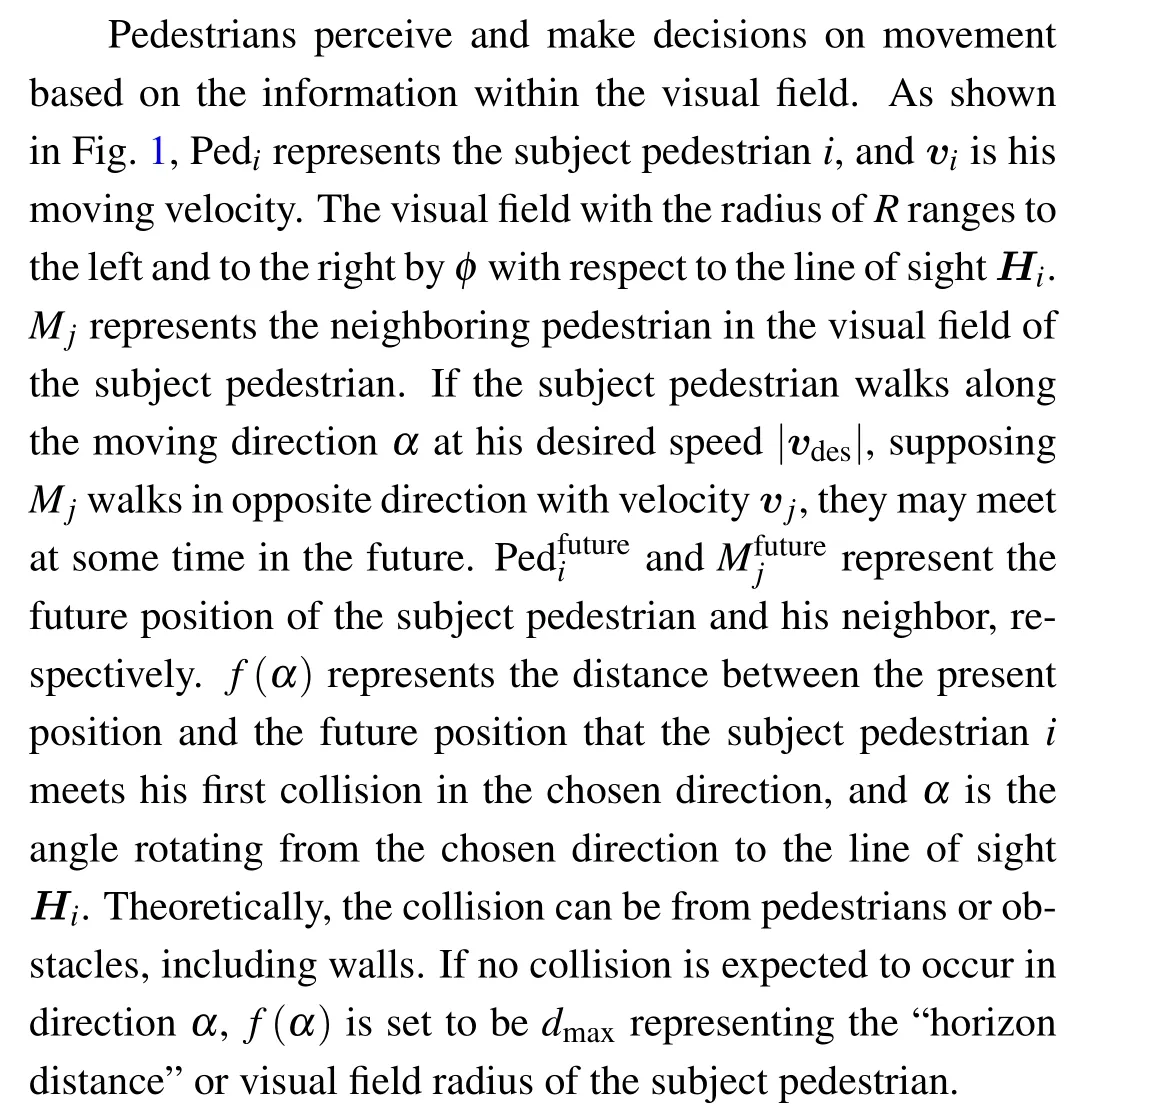
In the original heuristics-based model, the chosen directionαis computed through Eq.(2)by minimizing the distanced(α)to the target point:
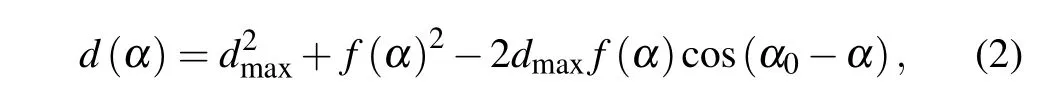
whereα0is the direction of the target point,which is the angle included between the line of sightHiand the direction of desired velocityvdes. The vectorvdesof desired velocity points from the present position of the subject pedestrian to his target point.
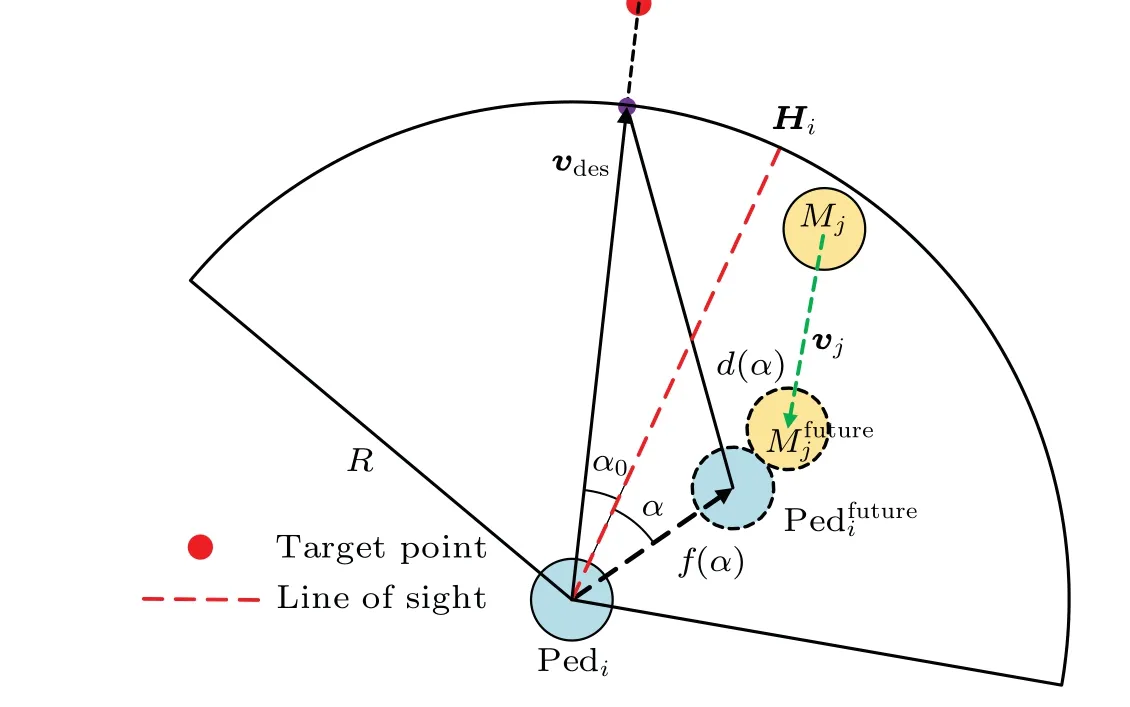
Fig.1. Illustration of cognitive heuristics in original heuristics-based model.
In our modified model, a pedestrian has limited choices of walking direction in the visual field. The view angle 2φis discretized intoNsub-angles with a value ofβ=2φ/N.Accordingly, the angle of directionkisαk=-φ+k·β,k=0,1,2,...,N,as shown in Fig.2.below.
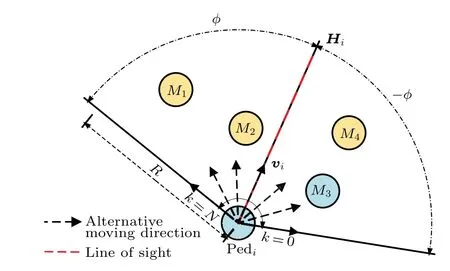
Fig. 2. Schematic diagram of a pedestrian’s visual field discretized into N+1 alternative directions.
2.1.1. Effective forward distance in target direction
In most of existing pedestrian simulation models, the moving target is described as a fixed target point. Once the target point is inappropriately placed, unrealistic pedestrian trajectories can occur in simulations. Taking pedestrian movement in a corridor as an example,when the target point is set to be a middle point of one end, and pedestrians move down from the other end of the corridor,pedestrians on the sides of the corridor gradually walk toward the middle of the corridor.However, we observe that pedestrians tend to walk down the corridor by keeping the current walking direction less changed if no obstruction needs to be avoided.[30]Therefore, the target direction is used in our model to replace the target point in some scenarios, such as in a corridor. Specifically, target direction is the vector starting from the mass center of the subject pedestrian,which is parallel to the corridor direction and points to his forward direction as shown in Fig.3.

Fig. 3. Schematic diagram of target direction for pedestrians in a corridor scenario.
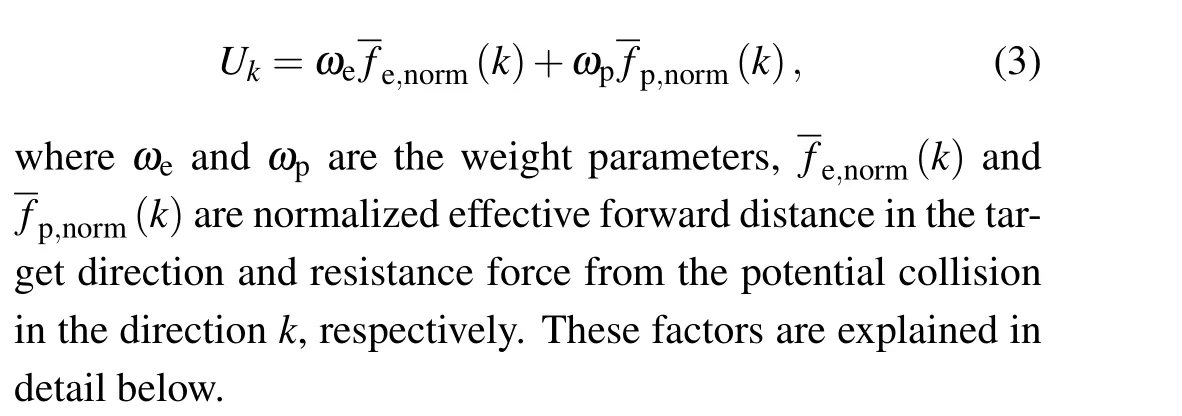
In the original heuristics-based model, the heuristic determining the desired velocity direction of pedestrian is modified in our model. Specifically, the modified heuristic is “A pedestrian chooses the direction that allows the most direct path to the destination, by considering both the presence of closer obstacles and the potential collisions caused by farther obstacles”. The utility maximization approach is adopted to determine the moving direction at the next time step for each pedestrian. Specifically, the utility of each alternative direction is calculated based on the modified heuristic as presented

Fig.4. Schematic diagram of effective forward distance in target direction of a pedestrian.
To represent the movement in the directionktoward destination, the effective forward distance in the target directionfe(k)is defined and calculated from the following equation:

Here,f(k) represents the distance to the first collision in the directionk,which is also the maximum forward distance at the next time step in the directionk;fe(k)is the projection length off(k)along the target direction;α0is the angle included between the line of sightHiand the target direction as shown in Fig.4.
The algorithm to detect the first collision in the directionkis illustrated in Fig.5. Firstly,searched are all the obstacles and neighboring pedestrians for the subject pedestrian within his visual field, by considering that the closer neighbors can obstruct some far neighbors. Then, assuming all the visible neighbors to keep their current moving direction unchanged,the collision point in the directionkfor each of them is calculated. Lastly, the collision point with the shortest distance is defined as the first collision in the directionk.
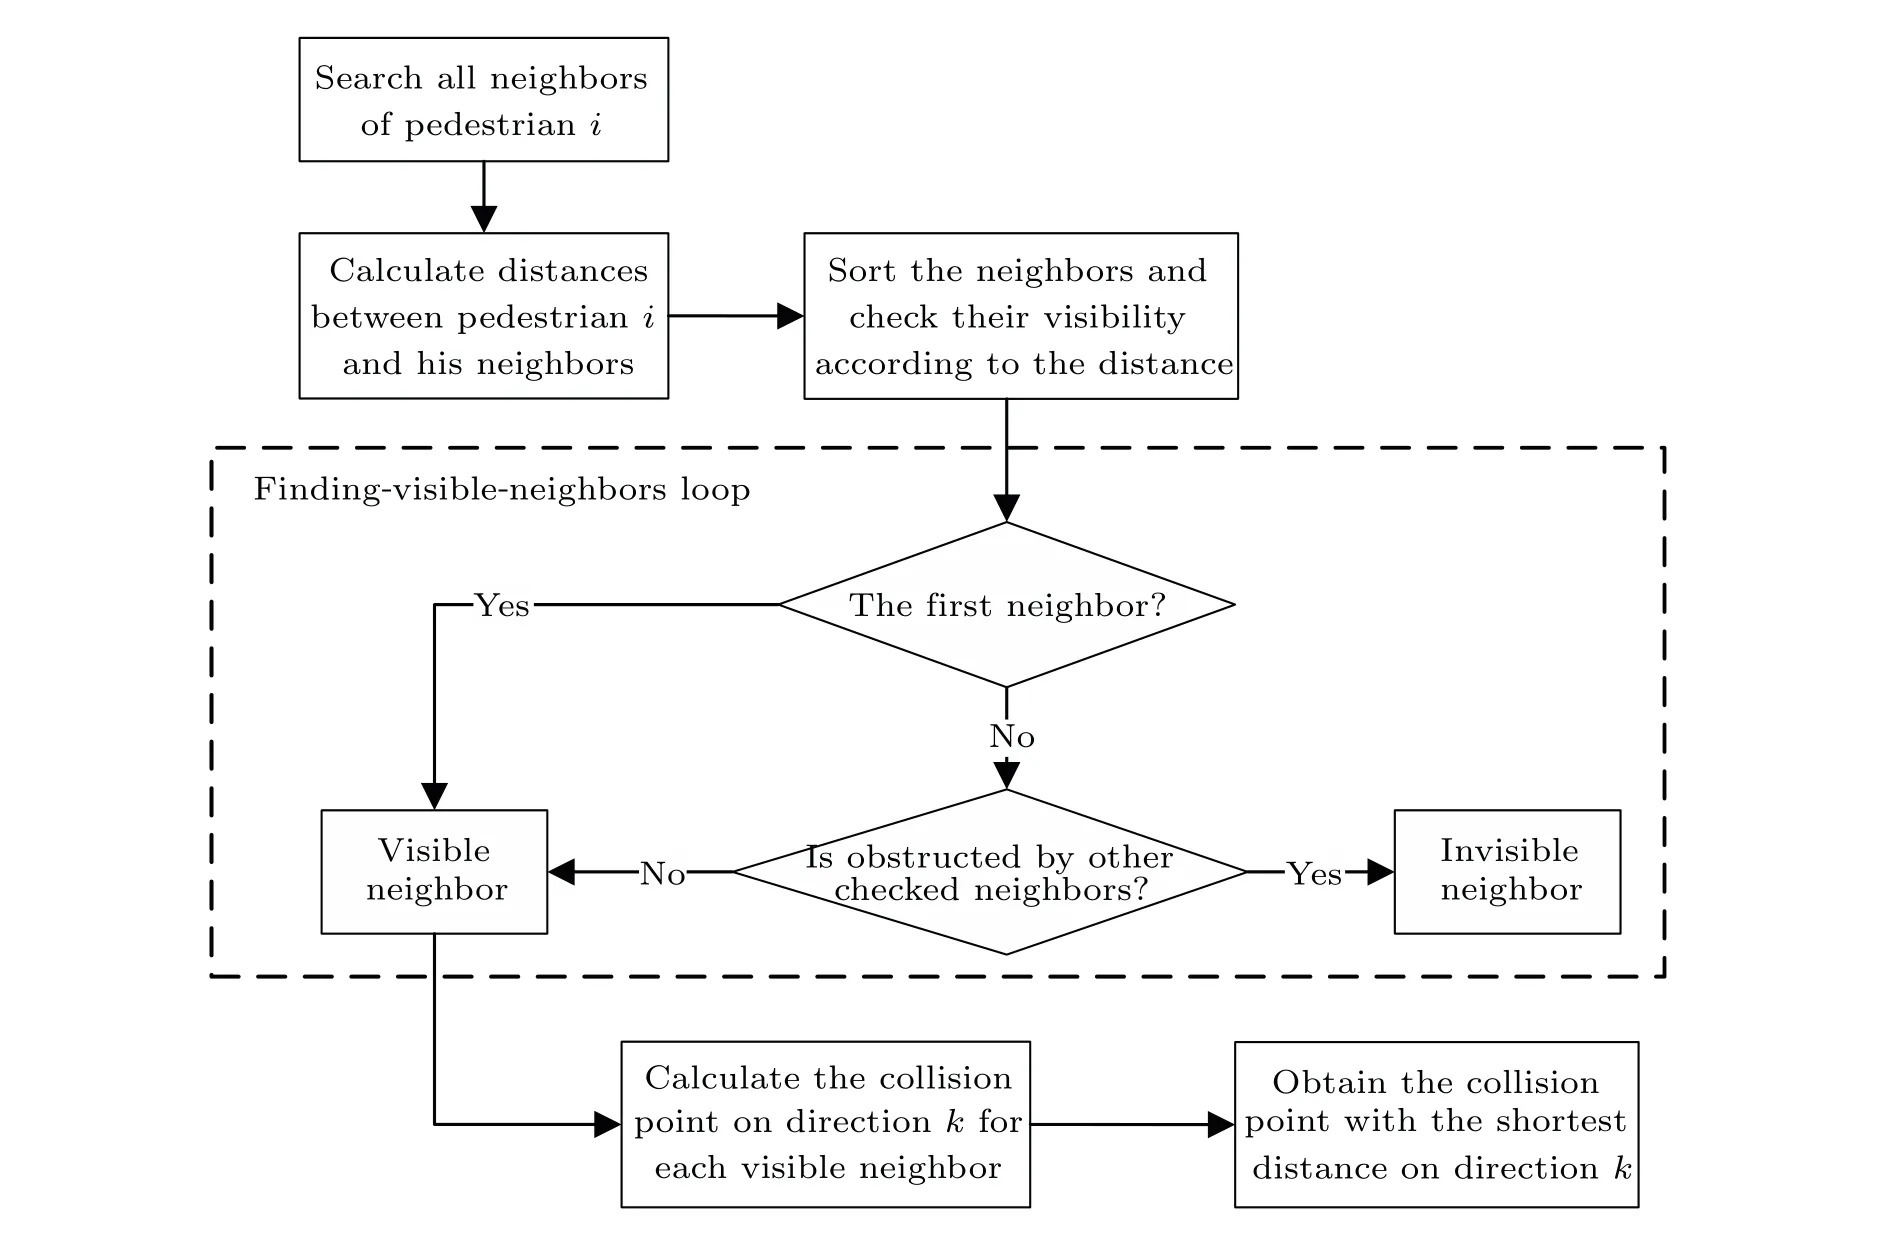
Fig.5. Flowchart of determining the first collision in direction k.
2.1.2. Effective forward distance on target direction
In fact,both the first collision and the potential collisions in the selected direction will affect the subject pedestrian’s velocity decision.Cristinet al.[33]suggested that pedestrians can prospect future collisions and adapt their behavior to the outcome. Thus,the resistance force from a potential collision in the directionkis calculated from the following equation:

wherenpis the number of pedestrians who may have potential collisions with the subject pedestrianiin the directionk, anddi jis the distance between the position of the subject pedestrian and the position of the corresponding pedestrians at the current time step. These pedestrians are detected as follows.Firstly,perpendicular distance from the mass center of pedestrianjto the directionkis less than the body radiusrof the pedestrian,that is,dhi,j <r. In addition,there is a conflict in the moving directions of the subject pedestrianiand the neighboring pedestrianj. Specifically,the relative angle betweenviandvjis greater than 90°; that is,θi,j <90°, as shown in Fig.6.

Fig.6. Schematic diagram of factors used in potential collision detection in direction k.
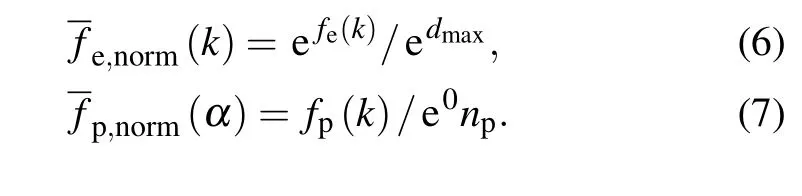
For calculation,fe(k) andfp(k) are normalized for each alternative directionkas shown below:

Once the moving direction at the next time step is selected, the change in the actual velocity at timetcan be determined by the acceleration equation as follows:

2.2. Contact force
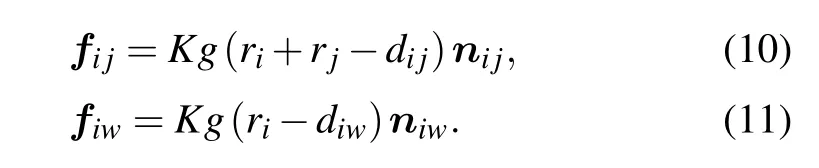
In the case of overcrowding, pedestrians may have body contact. Thus,the contact force needs to be considered to represent the physical interactions between pedestrians. Like the original heuristics-based model, physical interactions with a neighboring pedestrian and an obstacle can be represented,respectively, by the contact forcefi jandfiwwhich are expressed as The contact force is calculated from Eqs.(10)and(11),whereKis a constant parameter;g(x)=0 if the subject pedestrianiand the neighboring pedestrianjdo not have body contact,otherwise it equals the argumentx;dijis the distance between two pedestrians’centers of mass;nijis the normalized vector pointing from pedestrianjtoi;diwis the perpendicular distance of pedestrianito the obstacle, andniwis the direction perpendicular to it.
3. Numerical analysis on model parameters
To better understand the influences offe(α)andfp(α)on the whole simulation model performance,the values of corresponding weight parameters are adjusted in typical scenarios.Parameters used in the model areK=5000,τ=0.5,r=0.2,m=80,N=36,φ=90°,ωe=0.5,andωp=0.5. Simulation results are analyzed as follows.
3.1. Interaction with obstacles
Figure 7 represents a simulation scenario that a pedestrian has to detour around a wide obstacle during the movement in a corridor.

Fig.7. Simulation scenario that a pedestrian is moving in a corridor with a wide obstacle.
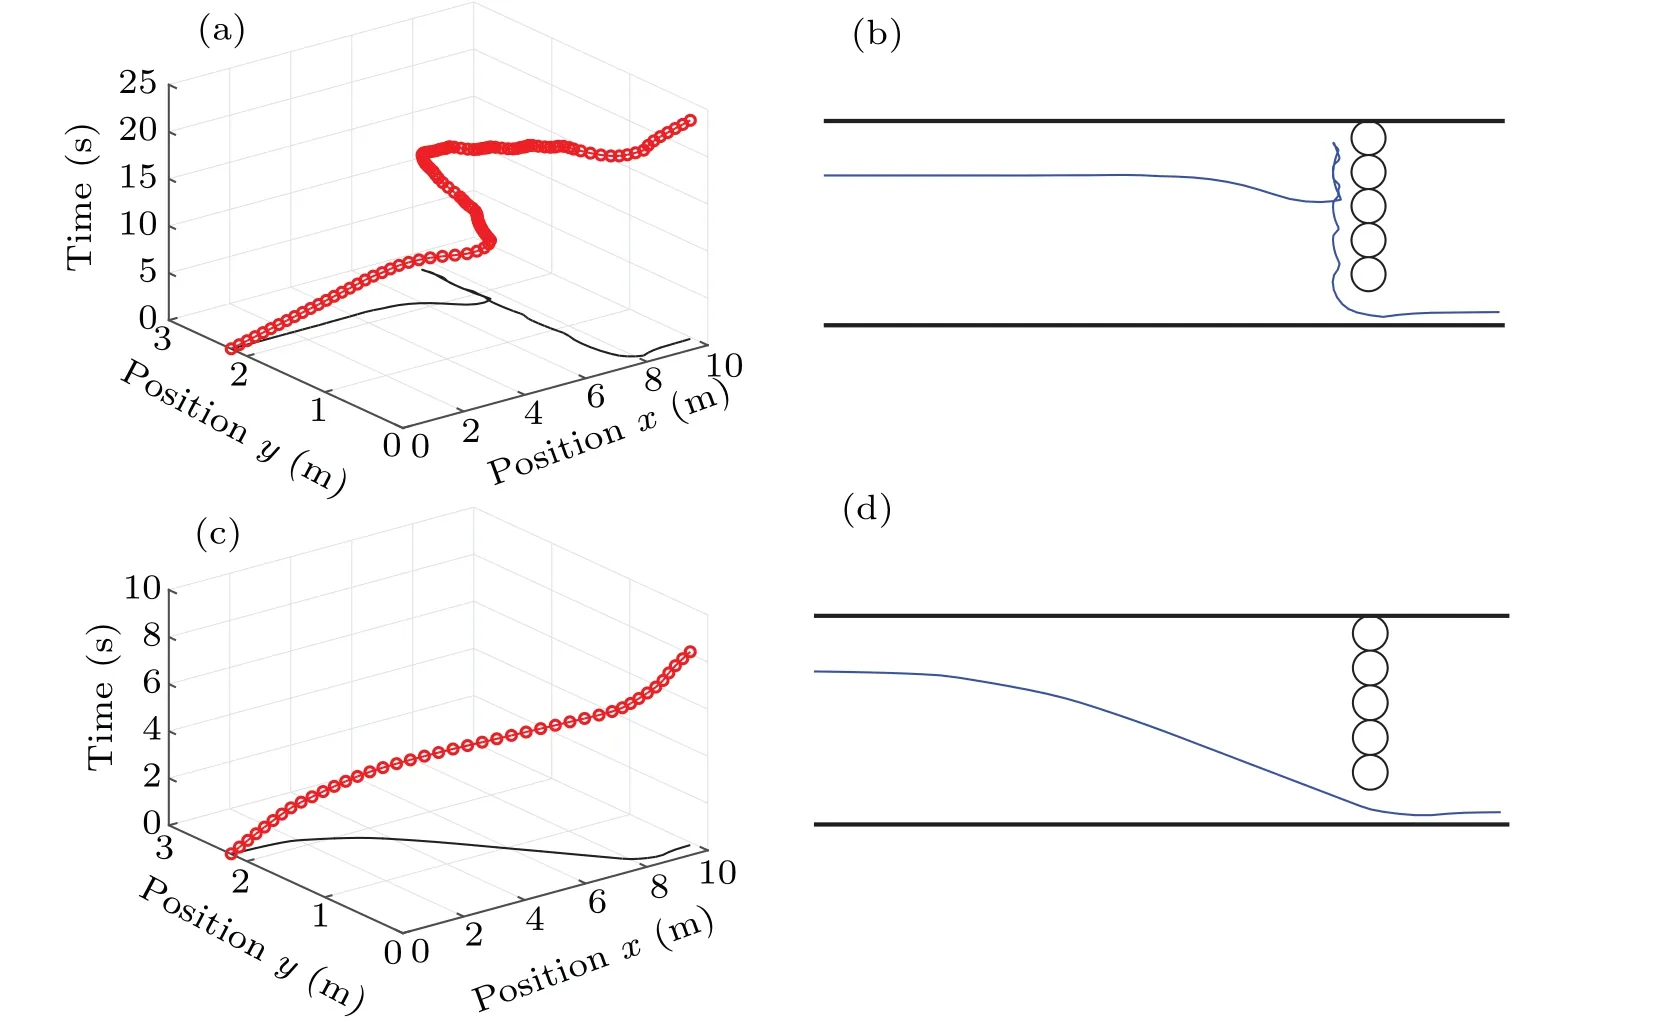
Fig. 8. Pedestrian trajectories in corridor with a wide obstacle, simulated by original heuristics-based model and our modified model: (a)three-dimensional spatial-temporal trajectory simulated by original model, (b) two-dimensional trajectory simulated by original model, (c) threedimensional spatial-temporal trajectory simulated by our modified model,and(d)two-dimensional trajectory simulated by our modified model.
First,we compare the simulated pedestrian trajectories by the original heuristics-based model and our modified model.In this scenario,R=5. The simulation results are shown in Fig. 8. Since the original heuristics-based model lacks the consideration of future collision,the pedestrian in the model is short-sighted.Therefore,the pedestrian tends to make evading decisions until he is very close to the obstacle,unrealistic wandering behavior in front of the obstacle can also be observed as shown in Figs.8(a)and 8(b). However, the pedestrian trajectory simulated by our modified model is more realistic as shown in Figs.8(c)and 8(d).
In addition, a series of test simulations is conducted to evaluate the sensitivity of the parameterR, whereRis set to be 1 m-8 m. The pedestrian trajectory is recorded by different colors according to the value ofRas shown in Fig. 9. It is shown that the larger the value ofR,the earlier the pedestrian will make the detour decision.

Fig. 9. Pedestrian trajectories simulated by (a) original heuristics-based model and (b) our modified model with different visual radii for various values of R.
3.2. Interaction with moving pedestrians
Figure 10 represents another simulation scenario that a pedestrian moves in the bidirectional flows, a group of pedestrians moving in the opposite direction coming toward him. Theoretically, the subject pedestrian may have two path choices. The first one is to directly move through the crowd.This path seems more direct, but he may experience strong resistance due to the frequent collision avoidance in the“passing through”process.The other choice is to make a detour and follow the pedestrians in the uniform flow, reducing the need for head-on collision avoidance.
In this scenario, a larger group of pedestrians are generated in the upper right part of the corridor, moving down the corridor from right to left. Meanwhile, a small group of pedestrians are generated in the lower left part of the corridor,moving from left to right. In the present scenario,R=5. Figure 11 shows the simulation results of the original heuristicsbased model and our modified model. It is found that the subject pedestrian in the original heuristics-based model moves directly through the crowd with opposite moving direction.However,an obvious detour can be observed in the simulated trajectory of the subject pedestrian in our model.The behavior of“avoiding potential collision in the counter flow”simulated by our modified model seems to be more realistic.

Fig.10. Schematic diagram of simulation scenario that a single pedestrian interacts with other pedestrians in bidirectional flows.

Fig. 11. Model performance of simulation scenario shown in Fig. 10 and schematic moving path of the subject pedestrian. Panels(a)and(c)display pedestrian trajectories simulated by original heuristics-based model and our modified model,respectively,with blue solid circles representing the trajectory of the subject pedestrian, red solid circles the trajectories of pedestrians moving in the opposite direction,and green solid circles the trajectories of pedestrians moving in the uniform direction. Panels (b) and (d) show a schematic moving path of the subject pedestrian simulated by the original heuristics-based model and by our modified model,respectively.
4. Modeling of pedestrian behavior
To evaluate model’s ability to model the pedestrian behavior, simulations of some basic scenarios are conducted.The other parameters in our model are as follows:k=5000,τ=0.5 s,r=0.2 m,m=80 kg,R=5 m,N=36,andφ=90°.
4.1. Lane formation in the bidirectional flow
Pedestrian crowd is a complex system, which can perform various self-organization phenomena.Thus,a commonly used method to evaluate the performance of pedestrian simulation models is to reproduce the emergence of empirically observed collective patterns of motion. The formation of pedestrian lanes in the bidirectional pedestrian flow is one of the most important phenomena, where individuals avoid moving pedestrians in the counterflow and share the available space by forming lanes of uniform moving directions.
To better describe the evolution of lane formation in bidirectional pedestrian flow,Yamori’s band index[34]is employed in this study. Its value ranges from 0 to 1,representing a transformation of highly ordered into a disorganized state of the bidirectional flow at timet. It is computed as follows.
(i) The corridor is segmented into several rows with the same widthb0as suggested in Ref.[20],we useb0=0.3 m.
(ii)For each rowjin the corridor,calculated is the number of pedestrians moving in each of the directions (that is,moving down the corridor from left to right and from right to left)within rowj. The numbr of pedestrians moving from left to right and that from right to left are denoted asnj1andnj2,respectively. Then the band index for rowjis computed from Eq.(12). If there is no pedestrian in rowj,Yj(t)is set to be 0.

(iii) The band index for the entire corridor is then given by the average value ofYj(t), that is,Y(t)=∑Kj=1Yj(t)/K,whereKis the total number of rows of the corridor.

Fig. 12. Band index value of each row in the corridor of three simulation cases: (a) simulation A: ωe =1, ωp =0, and R=2 m; (b) simulation B:ωe=0.5,ωp=0.5,and R=3 m;and(c)simulation C:ωe=0.3,ωp=0.7,and R=8 m.
Our model reproduces a pedestrian lane formation behavior. Specifically, three simulation cases are used to simulate the bidirectional flow in a corridor with a width of 3 m and a length of 12 m,they being i)simulation A:ωe=1,ωp=0,andR=2 m; ii)simulation B:ωe=0.5,ωp=0.5,andR=3 m;iii)simulation C:ωe=0.3,ωp=0.7,andR=8 m. Figure 12 represents the band index value of each row in the corridor of the three simulation cases. At the beginning of the simulation,the pedestrians in two directions do not meet each other,small value of band index can be detected. Accordingly, period of 62 s-100 s after simulation is used to observe pedestrian lane formation pattern in the three simulation cases. The lane formation is weakened and unstable in simulation case A,thus high level of band index is rarely observed and its span is short. With the increase of pedestrian’s visual radius and the consideration of potential collision in simulation case B,more stable pedestrian lanes can be observed. Moreover,in simulation case C,the weight of potential collision resistance is further increased, and the pedestrian visual radius is the longest in the simulation cases. It is clear that two pedestrian lanes are formed.
Figure 13 shows the simulation snapshots of the three simulation cases. Figure 14 shows the collection of pedestrian movement trajectories in the three simulations. Pedestrians can successfully avoid other pedestrians and walls in all three simulation cases,and pedestrian moving lanes can be observed explicitly. In simulation case A, more lanes are formed dynamically, and the pedestrians change lanes more frequently.Furthermore,more stable pedestrian lanes can be observed in simulation case B, and hardly any pedestrian moves through the counterflow in simulation case C.

Fig. 13. Simulation snapshots of lane formation phenomenon in bidirectional pedestrian flows,red solid circles and green solid circles represent the pedestrians moving from left to right and pedestrians moving in the opposite direction,respectively. Pedestrians in three cases were generated with a rate of 3 p/s randomly at each end of the corridor from the beginning of the simulation and then walked down the corridor.

Fig.14. Trajectories of pedestrians moving from left to right(red lines)and from right to left(green lines)in three simulation cases of the bidirectional pedestrian flow: (a) simulation A: ωe =1, ωp =0, and R=2 m; (b) simulation B: ωe =0.5, ωp =0.5, and R=3 m; (c) simulation C: ωe=0.3,ωp=0.7,and R=8 m.
4.2. Density and velocity relationship in unidirectional flow
The fundamental diagram presents the basic relationship between density and speed or flow rate, which is frequently used in previous studies to evaluate the credibility of pedestrian simulation models. In this work,the unidirectional flow through a corridor is studied. As shown in Fig.15,the length and width of corridor areL=12 m andW=3 m,respectively,and there is a door with width d at the right end of the corridor;its value ranges from 1 m to 2 m. A measurement area of 2 m×2 m located in the central part of the corridor is used to extract the flow data.
A series of simulations is conducted, in which pedestrians walk down the corridor from left to right. Different density conditions can be achieved by adjusting the entering flow rate of pedestrians and door widthd. In addition,the general density and average of instantaneous movement velocity of all the pedestrians within the measurement area are recorded every 5 s. The model parameters areωe=0.5,ωp=0.5, andR=5 m.

Fig.15. Schematic diagram of experiment scene and measurement area.
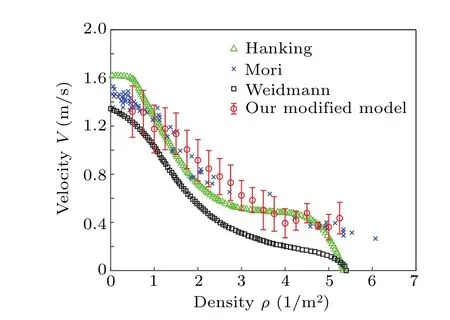
Fig. 16. Relationship between density and movement velocity in simulation of the unidirectional pedestrian flow in a corridor by our model and its comparison with published empirical data sets.
The results are plotted in Fig. 16, and compared with published empirical data sets.[35,36]The overall distribution of the simulation data points by our model is reasonably consistent with that of these observation results, especially according with the empirical data from the study of Mˆori and Tsukaguchi.[36]The data in this study are obtained by observing the pedestrian flow in sidewalks,which can represent pedestrian behavior under normal conditions. However, fluctuations in velocity can be observed at the same density levels(see the varied lengths of error bars in Fig. 16). The fluctuations may be due to the difference in initial moving speeds of pedestrians in different simulation cases.
5. Conclusions
A modified heuristics-based model is presented in this work to reproduce more realistic pedestrian movement behavior, especially in high-density scenarios where potential collision needs to be considered. Firstly, a modified heuristic is proposed and stated as follows: “A pedestrian chooses the direction that allows the most direct path to destination by considering both the presence of closer obstacles and potential collision caused by farther obstacles.” Based on this heuristic, the following modifications are made in our model: (I) a discrete choice model and a utility maximization approach are adopted to choose velocity direction at each time step;(II)new target direction vector is used to replace the one pointing to the destination point from the pedestrian’s mess center in certain scenarios(e.g.a corridor or a passageway),contributing to more realistic moving trajectories; (III)effective forward distance in the target direction is defined and used in the heuristics function, which focuses on the efficiency of approaching the target while avoiding the first collision;(IV)potential collision from far obstacles is taken into consideration in the velocity direction choice, and represented by a resistance force in the heuristics function.
The influences of the parameters in the modified model are analyzed by conducting a series of simulations in some typical scenarios. Realistic avoidance behavior when encountering a wide obstacle in a corridor can be reproduced by our modified model. It is found that the larger the visual radius,the earlier the pedestrian starts to make a detour. In the second simulation scenario, a pedestrian observes a group of pedestrians moving toward him. In our modified model,the subject pedestrian makes a detour and moved in the flow with the uniform direction, but not moving through the crowd with the opposite moving direction.
The model is also validated by comparing the simulation results with published empirical data about density-speed relationship of pedestrian crowds and modeling lane formation pedestrian flow phenomena in a relatively high-density situation. The pedestrian lanes can dynamically be formulated in the bidirectional flow. With the increase of pedestrian visual radius and the weight of potential collision resistance,more stable pedestrian lanes and less moving-through-thecounterflow pedestrians can be observed. In addition,the distribution of density-velocity in simulations accords well with that of the empirical data. The results show that the current model can overcome the deficiency of the original heuristicsbased model, demonstrating a remarkable ability to reproduce realistic pedestrian movement behavior. Further studies should be carried out to characterize the pedestrians’adaptive behavior to future collisions,and the empirical data can further refine our modified model.
Acknowledgements
Project supported by the National Natural Science Foundation of China(Grant No.71904116)and the Fund from the Shanghai Science and Technology Commission,China(Grant No.19DZ1209600).
猜你喜欢
杂志排行
Chinese Physics B的其它文章
- Characterizing entanglement in non-Hermitian chaotic systems via out-of-time ordered correlators
- Steering quantum nonlocalities of quantum dot system suffering from decoherence
- Probabilistic quantum teleportation of shared quantum secret
- Spin–orbit coupling adjusting topological superfluid of mass-imbalanced Fermi gas
- Improvement of a continuous-variable measurement-device-independent quantum key distribution system via quantum scissors
- An overview of quantum error mitigation formulas