Use of shear wave elastography for the diagnosis and follow-up of biliary atresia: A meta-analysis
2022-09-14EllenWagnerHussienAhmedAbdelgawadMeghanLandryBelalAsfourMarkSlidellRubaAzzam
Ellen S Wagner, Hussien Ahmed H Abdelgawad, Meghan Landry, Belal Asfour, Mark B Slidell, Ruba Azzam
Abstract
Key Words: Biliary atresia; Cholestasis; Hepatic portoenterostomy; Fibrosis; Esophageal and gastric varices;Elasticity imaging techniques
lNTRODUCTlON
Biliary atresia (BA) is a progressive, fibroinflammatory disease of the biliary system that exclusively affects infants. It accounts for about 30% of all cases of prolonged cholestasis in the first three months of life[1]. Its incidence is estimated to be approximately 1:10000-19000 live births, with increased prevalence in East Asian countries to up to 1:2700[2]. The initial clinical manifestations include progressive jaundice, deep-colored urine, light colored stools, and an increase in conjugated serum bilirubin levels.The similarity in clinical presentation and blood biochemistry results between patients with BA and those with other infantile cholestatic liver diseases represents a great challenge to clinicians in accurately establishing a final diagnosis in a timely fashion. Early identification of BA in an infant with cholestatic jaundice is crucial, as the Kasai portoenterostomy (KPE) procedure may help restore bile flow and prevent the otherwise rapid progression to biliary cirrhosis. A BA outcomes meta-analysis by Jimenez-Riveraet al[2] included fourteen studies that focused on native liver survival (NLS), all of which reported improved NLS when KPE was performed at an earlier age. Given its progressive nature,BA is the most common indication for liver transplantation in the pediatric population, with NLS ranging from 24.0% to 52.8% at ten years post-KPE[2]. Patients with BA who have undergone KPE need close clinical monitoring to assess for signs of chronic liver disease progression, particularly as they approach potential need for liver transplant. Currently, there are no widely accepted, validated noninvasive tests to pre-operatively diagnose BA nor to evaluate for progressive fibrosis after KPE.
While ultrasound findings, such as absence of a contractile gall bladder after feeding or the presence of a triangular cord sign, can be suggestive of BA, ultrasound alone is not diagnostic[3]. In order to diagnose BA, a liver biopsy is performed to assess for the histopathologic signs of biliary obstruction,portal edema, and fibrosis[4]. When performed at age 60 d or less, liver biopsy is 96.4% sensitive for the diagnosis of BA[3]. The progressive nature of the disease makes it imperative that a diagnosis is made as early as possible. The gold standard test to confirm BA is a formal cholangiogram. Assessment for progression of chronic liver disease post-KPE is usually achieved by the constellation of findings on laboratory and radiologic testing as well as consideration for repeat liver biopsy and/or upper gastrointestinal endoscopy, with no standardized guidelines for non-invasive staging of hepatic fibrosis nor timing for endoscopic evaluation for potential variceal evolution. Invasive procedures carry risks,both procedural as well as those related to sedation or anesthesia[4].Delays at each juncture, both in diagnosis and in post-KPE surveillance, can have a potentially detrimental impact on patient outcome.
Ultrasound elastography (UE) is an emerging imaging modality that uses applied forceviaultrasound probe to measure the elastic properties of tissue[5,6]. UE can be classified into strain imaging and shear wave imaging. Strain imaging relies on a normal external force (push) or intrinsic forces (i.e.,respiration or cardiovascular movement) within the body. For this reason, strain imaging is difficult to quantify and reproduce, particularly in deeper organs, leading to limited applicability in the liver. As a result, strain imaging was not the focus of this analysis[7,8].
Shear wave imaging, also called shear wave elastography (SWE) utilizes a dynamic stress and can be further classified into transient elastography (TE), point shear wave elastography (pSWE; also called VTQ or Virtual Touch Quantification on some platforms), and two-dimensional shear wave elastography (2D-SWE; also called VTIQ or Virtual Touch IQ on some platforms)[8,9]. TE, which is performed using the FibroScan (Echosens, Paris, France) system, utilizes a mechanical punch to generate forces and measure unidirectional pressure waves[5]. pSWE and 2D-SWE differ from TE in that they utilize B mode ultrasound imaging guidance, which enables direct visualization of tissue, as well as an acoustic radiation force impulse (ARFI) in order to measure tissue stress. pSWE enables the measurement of average shear wave speed within a region of interest while 2D-SWE uses multiple foci of tissue displacement along an axis to generate a quantitative map of shear wave speed[5].
SWE has been studied extensively in adult liver literature with studies in pediatric liver disease emerging only recently[6]. And yet, while multiple authors have addressed the utility of SWE for diagnosis and management in BA, there have been no large-scale studies nor meta-analyses on this modality. The aim of this meta-analysis is to evaluate the utility of SWE in: (1) the differentiation of BA from other cholestatic liver diseases of infancy, and (2) the assessment of fibrosis progression in post-KPE follow-up.
MATERlALS AND METHODS
This review was conducted in strict accordance with the Cochrane handbook of systematic reviews of interventions[10]. We followed the Preferred Reporting Items for Systematic Review and Meta-Analysis of Diagnostic Test Accuracy studies (PRISMA-DTA statement)[11]. The review was publicly registered with the Open Science Framework (OSF). The statistical analysis was performed by co-authors H.A.,who has over four years as a biostatistician in a clinical research organization, and M.L., who is a clinical research coordinator employed by the University of Chicago.
Search strategy and eligibility criteria
PubMed, Scopus, Web of Science, EBSCO, and Cochrane Central were searched for English language studies with information on BA and elastography from 2010 to 2021. Two of the authors performed the literature search using the keywords: “Elastography” AND “biliary atresia”.
Full texts were reviewed to select eligible studies for meta-analysis. Studies were included if the following criteria were met: (1) The study used SWE to differentiate BA from other cholestatic liver diseases of infancy; (2) the study used SWE in the follow-up of patients with BA for the development of fibrosis/cirrhosis post-KPE; and (3) the study assessed the accuracy of SWE for the diagnosis or followup of liver fibrosis based on the cut-off point for liver stiffness and/or spleen stiffness values.
Exclusion criteria were as follows: (1) Full text article was not available and/or abstract and article were not available in English; (2) the study was not specific to BA and/or did not utilize SWE (3) the study evaluated the accuracy of SWE combined with other diagnostic methods;(4)the study used SWE as a reference test to study novel biomarkers; and (5) the study was a review article, letter to the editor,case report, editorial, case series, or consensus statement. Only studies with reliable data for extraction and analysis were included in the meta-analysis.
Data extraction
Two authors independently reviewed and extracted the data from each included study. Data were extracted for study characteristics (e.g., first author and year of publication, study period, study setting,study design, and sample size), baseline characteristics of the included patients (e.g., age of patients,laboratory date, age at diagnosis), and diagnostic data (e.g., sensitivity, specificity, predictive values).
Risk of bias assessment
Two researchers assessed the risk of bias of studies included using version 2 of the Quality Assessment of Diagnostic Test Accuracy Studies (QUADAS-2) tool[12]. QUADAS-2 examines seven items on the representation of patient spectrum, selection criteria, reference standard, verification bias, timing, and study withdrawals. Both reviewers scored the tool independently; all disagreements were discussed and consensus was reached.
Data analysis
Heterogeneity was assessed by visual inspection of the forest plots and measured by I-square and Chi-Square tests. In case of significant heterogeneity (P< 0.1), a random effect model was used. Continuous data were pooled as standardized mean difference (SMD) in a meta-analysis model using inverse variance method with the respective 95% confidence intervals. We used Comprehensive Meta Analysis(CMA, United States) software version 3.3.070 for windows. Methods described in reference[13] were utilized to compute missing standard deviations. The diagnostic accuracy indicators of each test were pooled as sensitivity, specificity, and diagnostic odds ratio (DOR) with the corresponding 95%confidence intervals by the DerSimonian-Laird random effect model using MetaDiSc Beta-1.4 software.In addition, the Summary Receiver Operating Characteristic (SROC) curve was used for the evaluation of diagnostic tests and represents the relationship between true positive and negative rates considering the varying diagnostic thresholds among studies. The summary of the test performance was represented with an AUC of 1.0 (100%) indicating perfect discriminatory ability to distinguish BA from non-BA.
Seven studies used SWE machinery that reported results in units of m/s as opposed to kPa, with four being evaluated for diagnostic test accuracy[14-18] and two for utility of SWE for follow-up[19,20].Values reported in m/s were converted to kPa as per reference[8] (Supplementary material).
RESULTS
Electronic search yielded 243 studies with 42 identified as potentially meeting inclusion criteria(Figure 1). Full text articles were retrieved and assessed for final eligibility. After the review of all full text articles, 22 were excluded due to study design and unreliable data for extraction, the use of SWE as an adjunct to the primary study of a novel biomarker, and subject comparison to healthy controls (as opposed to other cholestatic infants). Eleven studies on the utility of SWE in accurately differentiating BA from other cholestatic liver diseases of infancy met criteria for inclusion, as well as nine studies that evaluated the utility of SWE in assessing and monitoring the development of hepatic fibrosis/cirrhosis post-KPE. The studies included were mostly single center, retrospective analyses conducted in infants and children (age 0-18 years) and published in peer-reviewed journals between 2010 and 2021. Detailed individual study characteristics are presented in Table 1.
The overall quality of the included studies assessed by the QUADAS-2 (Figure 2), was moderate to high. All analyzed studies were found to have low risk of bias in five or more of the seven items, with the exception of[21], which showed unclear risk of bias in two of seven items and high risk of bias in patient selection. Unclear risk of bias was reported in patient selection due to lack of clear selection criteria in several studies. Potential risk of bias in the index test was recorded in several studies due to lack of reporting on blinding relative to reference standard results. Potential bias in reference standards emerged due to the use of multiple different reference standards (surgical exploration, intraoperative cholangiography, liver biopsy) with possibility for incorrect classification of BA. Finally, bias in the flow and timing was primarily due to a lack of reported details in some of the included studies.
SWE for the diagnosis of BA
Data on SWE for distinguishing BA from other cholestatic neonatal liver diseases were collected from 11 studies with 1307 total patients (560 with BA and 747 without BA). The mean liver stiffness value was significantly higher in the BA group compared to the non-BA group (overall SMD = 2.30 kPa, 95%CI:1.69, 2.90,P< 0.0001). Pooled studies were heterogeneous (P< 0.01,I2= 94%) (Figure 3). Of the 11 studies included, five reported on performing diagnostic test analysis using liver biopsy as the reference test, one study[22] used surgical exploration or cholangiography, and the reference was not specified in another[16].
The forest plot of sensitivity and specificity for the diagnostic performance of the liver stiffness value measured by SWE for differentiating BA from other etiologies of neonatal cholestasis is shown in Figure 4A. The pooled sensitivity was 83% (95%CI: 80%, 86%) and specificity was 79%, (95%CI: 76%,82%). The SROC curves of SWE for the diagnosis of BA are illustrated in Figure 4B. The SROC curve was symmetric, and the AUC was 0.91, Q was 0.84 (SE = 0.02). The DOR was 24.61, (95%CI: 12.74, 47.53,I2= 72.4%) as shown in Figure 4C. Two of the 11 articles did not report a cut-off value for differentiating between BA and non-BA[14,15] and were excluded from this analysis.
SWE for the follow-up of patients with BA
Data on SWE to assess liver disease progression in post-KPE follow-up were collected from nine studies including 327 total patients [101 patients with varices, 124 patients without varices, 41 patients with fibrosis (F0-F2), and 61 patients with fibrosis (F3-F4)]. Fibrosis stage is reportedviaMETAVIR standards,a scale from F0 to F4 where F0 shows no signs of histologic fibrosis, F2 represents moderate fibrosis with few bridges/septa, F3 is numerous septa without cirrhosis, and F4 signifies cirrhosis.
The mean liver stiffness value was significantly higher in patients with varices in comparison to patients without varices (overall SMD 1.38 kPa, 95%CI: 1.02, 1.74,P< 0.00001). Pooled studies were homogenous (P= 0.29,I2= 19%) (Figure 5A). Only three studies reported data on the diagnosticperformance of spleen stiffness measured by SWE for predicting the presence of varices in patients with BA post-KPE. The mean spleen stiffness value was significantly higher in patients with varices when compared to patients without varices (overall SMD 1.66 kPa, 95%CI: 1.19, 2.14,P< 0.00001). Pooled studies were homogenous (P= 0.42,I2= 0%) (Figure 5B).

Table 1 Main characteristics of studies included in the meta-analysis
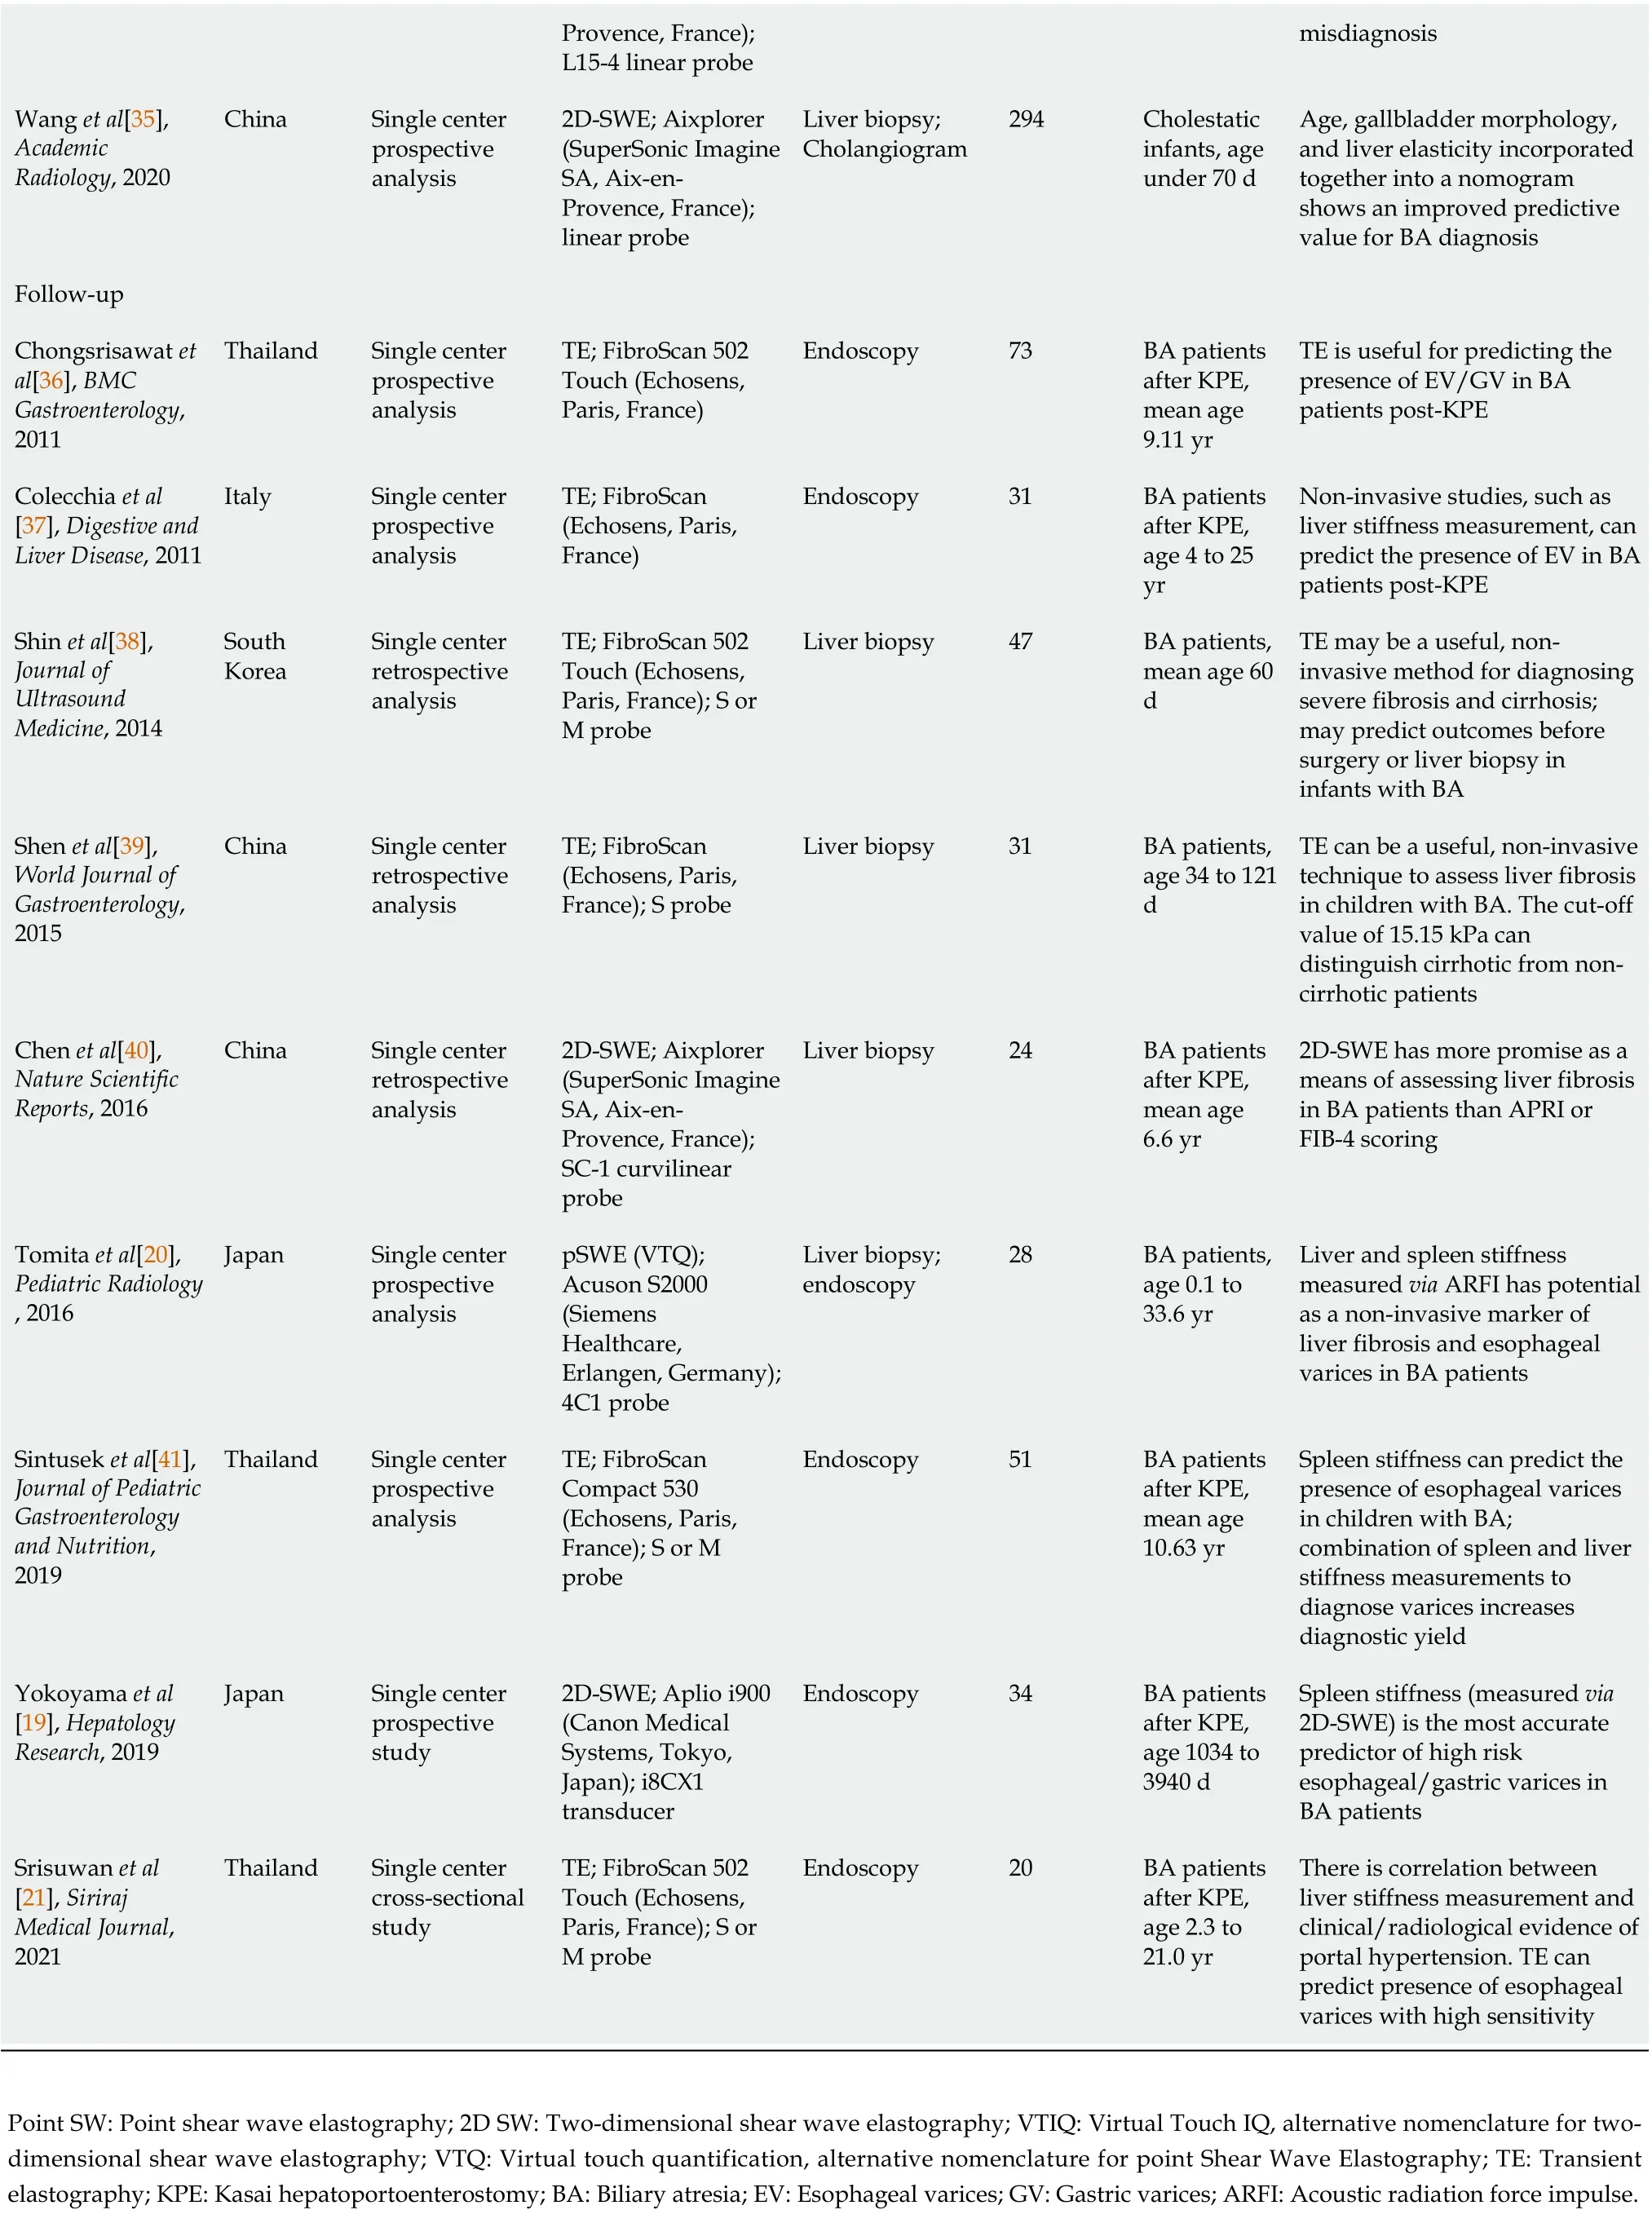
Provence, France);L15-4 linear probe misdiagnosis Wang et al[35],Academic Radiology, 2020 China Single center prospective analysis 2D-SWE; Aixplorer(SuperSonic Imagine SA, Aix-en-Provence, France);linear probe Liver biopsy;Cholangiogram 294 Cholestatic infants, age under 70 d Age, gallbladder morphology,and liver elasticity incorporated together into a nomogram shows an improved predictive value for BA diagnosis Follow-up Chongsrisawat et al[36], BMC Gastroenterology,2011 Thailand Single center prospective analysis TE; FibroScan 502 Touch (Echosens,Paris, France)Endoscopy 73 BA patients after KPE,mean age 9.11 yr TE is useful for predicting the presence of EV/GV in BA patients post-KPE Colecchia et al[37], Digestive and Liver Disease, 2011 Italy Single center prospective analysis TE; FibroScan(Echosens, Paris,France)Endoscopy 31 BA patients after KPE,age 4 to 25 yr Non-invasive studies, such as liver stiffness measurement, can predict the presence of EV in BA patients post-KPE Shin et al[38],Journal of Ultrasound Medicine, 2014 South Korea Single center retrospective analysis TE; FibroScan 502 Touch (Echosens,Paris, France); S or M probe Liver biopsy 47 BA patients,mean age 60 d TE may be a useful, noninvasive method for diagnosing severe fibrosis and cirrhosis;may predict outcomes before surgery or liver biopsy in infants with BA Shen et al[39],World Journal of Gastroenterology,2015 China Single center retrospective analysis TE; FibroScan(Echosens, Paris,France); S probe Liver biopsy 31 BA patients,age 34 to 121 d TE can be a useful, non-invasive technique to assess liver fibrosis in children with BA. The cut-off value of 15.15 kPa can distinguish cirrhotic from noncirrhotic patients Chen et al[40],Nature Scientific Reports, 2016 China Single center retrospective analysis 2D-SWE; Aixplorer(SuperSonic Imagine SA, Aix-en-Provence, France);SC-1 curvilinear probe Liver biopsy 24 BA patients after KPE,mean age 6.6 yr 2D-SWE has more promise as a means of assessing liver fibrosis in BA patients than APRI or FIB-4 scoring Tomita et al[20],Pediatric Radiology, 2016 Japan Single center prospective analysis pSWE (VTQ);Acuson S2000(Siemens Healthcare,Erlangen, Germany);4C1 probe Liver biopsy;endoscopy 28 BA patients,age 0.1 to 33.6 yr Liver and spleen stiffness measured via ARFI has potential as a non-invasive marker of liver fibrosis and esophageal varices in BA patients Sintusek et al[41],Journal of Pediatric Gastroenterology and Nutrition,2019 Thailand Single center prospective analysis TE; FibroScan Compact 530(Echosens, Paris,France); S or M probe Endoscopy 51 BA patients after KPE,mean age 10.63 yr Spleen stiffness can predict the presence of esophageal varices in children with BA;combination of spleen and liver stiffness measurements to diagnose varices increases diagnostic yield Yokoyama et al[19], Hepatology Research, 2019 Japan Single center prospective study 2D-SWE; Aplio i900(Canon Medical Systems, Tokyo,Japan); i8CX1 transducer Endoscopy 34 BA patients after KPE,age 1034 to 3940 d Spleen stiffness (measured via 2D-SWE) is the most accurate predictor of high risk esophageal/gastric varices in BA patients Srisuwan et al[21], Siriraj Medical Journal,2021 Thailand Single center cross-sectional study TE; FibroScan 502 Touch (Echosens,Paris, France); S or M probe Endoscopy 20 BA patients after KPE,age 2.3 to 21.0 yr There is correlation between liver stiffness measurement and clinical/radiological evidence of portal hypertension. TE can predict presence of esophageal varices with high sensitivity Point SW: Point shear wave elastography; 2D SW: Two-dimensional shear wave elastography; VTIQ: Virtual Touch IQ, alternative nomenclature for twodimensional shear wave elastography; VTQ: Virtual touch quantification, alternative nomenclature for point Shear Wave Elastography; TE: Transient elastography; KPE: Kasai hepatoportoenterostomy; BA: Biliary atresia; EV: Esophageal varices; GV: Gastric varices; ARFI: Acoustic radiation force impulse.
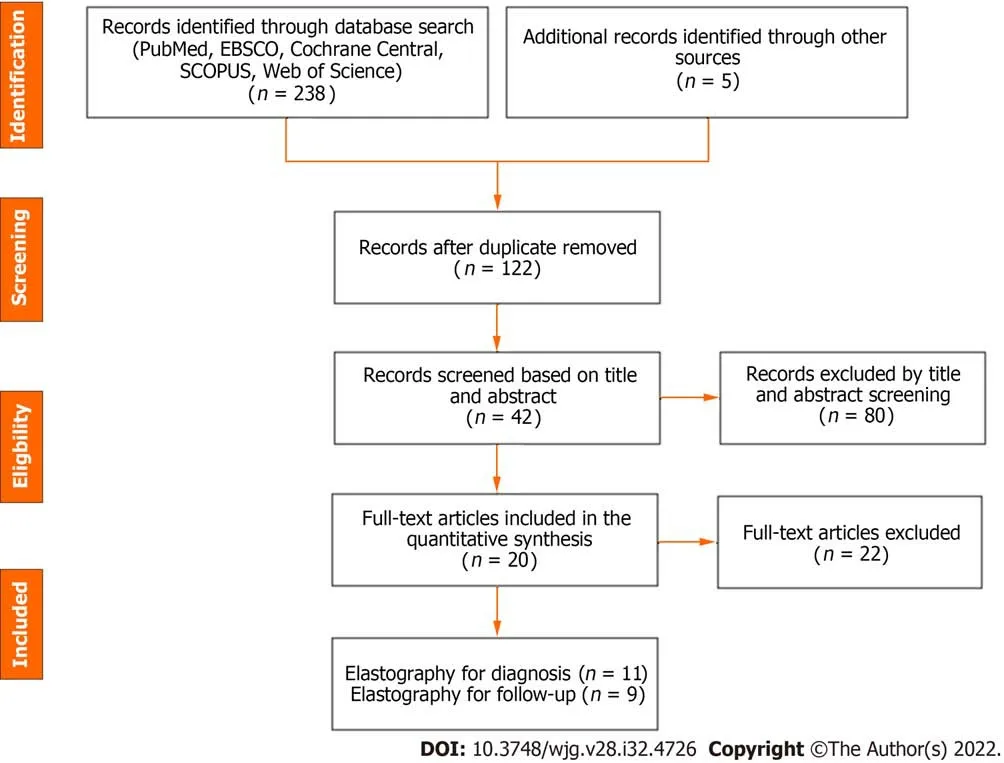
Figure 1 Preferred Reporting ltems for Systematic Review and Meta-Analysis flow diagram of the meta-analysis.
The forest plot of the sensitivity and specificity for the diagnostic performance of liver stiffness value measured by SWE to predict the presence of varices is shown in Figure 6A. The pooled sensitivity was 85% (95%CI: 77%, 91%), while the specificity was 76%, 95%CI (67%, 83%). Illustrated in Figure 6B, the SROC curve was symmetric and the AUC was 0.86 withQvalue of 0.80 (SE = 0.05). The DOR was 16.36,95%CI (8.18, 32.70),I2= 0%, showing no heterogeneity among the pooled studies (Figure 6C).
Three studies utilized spleen stiffness measured by SWE to predict the presence of varices with endoscopy as a reference test. The pooled sensitivity was 84% (95%CI: 69%, 94%), while the specificity was 84%, 95%CI (73%, 92%). The AUC of the SROC curve was 0.91, withQvalue of 0.85 (SE = 0.403).The DOR was 28.93, 95%CI (8.99, 93.14),I2= 0%, showing no heterogeneity among the pooled studies(Supplementary Figure 1).
Four studies used liver stiffness value measured by SWE to predict the presence of liver fibrosis F4(vs F0-3) when liver biopsy was the reference test. The forest plot for the sensitivity and specificity of the diagnostic performance of liver stiffness value measured by SWE to predict the presence of liver fibrosis F4 is shown in Figure 7A. The pooled sensitivity was 96% (95%CI: 79%, 100%), while the specificity was 89%, (95%CI: 81%, 94%). The SROC curves of liver stiffness value measured by SWE are illustrated in Figure 7B. The AUC of the SROC curve was 0.95, with Q value of 0.89 (SE = 0.04). The DOR was 70.04,(95%CI: 16.06, 305.40),I2= 0%, showing no heterogeneity among the pooled studies (Figure 7C).
Three studies used the liver stiffness value measured by SWE to predict the presence of liver fibrosis F3-4 (vsF0-2) when liver biopsy was the reference test. The pooled sensitivity was 85% (95%CI: 71%,94%), and specificity 81%, 95%CI (67%, 91%). The AUC of the SROC curve was 0.91, withQvalue of 0.84(SE = 0.04). The DOR was 24.68, 95%CI (7.43, 82.01),I2= 0%, showing no heterogeneity among the pooled studies (Supplementary Figure 2).
DlSCUSSlON
Early diagnosis of BA is crucial to patient outcomes. At present, diagnosis depends on invasive liver biopsy and intraoperative cholangiogram. The present meta-analysis is the first to our knowledge to assess the potential utility of preoperative SWE in establishing the diagnosis of BA. In our metaanalysis, we observed that liver stiffness value measured by SWE had high diagnostic accuracy for differentiating BA from other neonatal cholestasis (AUC = 0.91) with high summary sensitivity of 83%as well as summary specificity of 79% and DOR of 24.61. Notably, several of the studies used different reference standards (five utilized liver biopsy, one utilized surgical exploration or cholangiography, and one did not specify its reference standard). When interpreted within the context of pathophysiology of BA, with fibrosis beginning at bile duct obliteration, in comparison to non-BA cholestasis which has variable degrees of fibrosis, these results reflect the potential for SWE to aid in the diagnostic process.
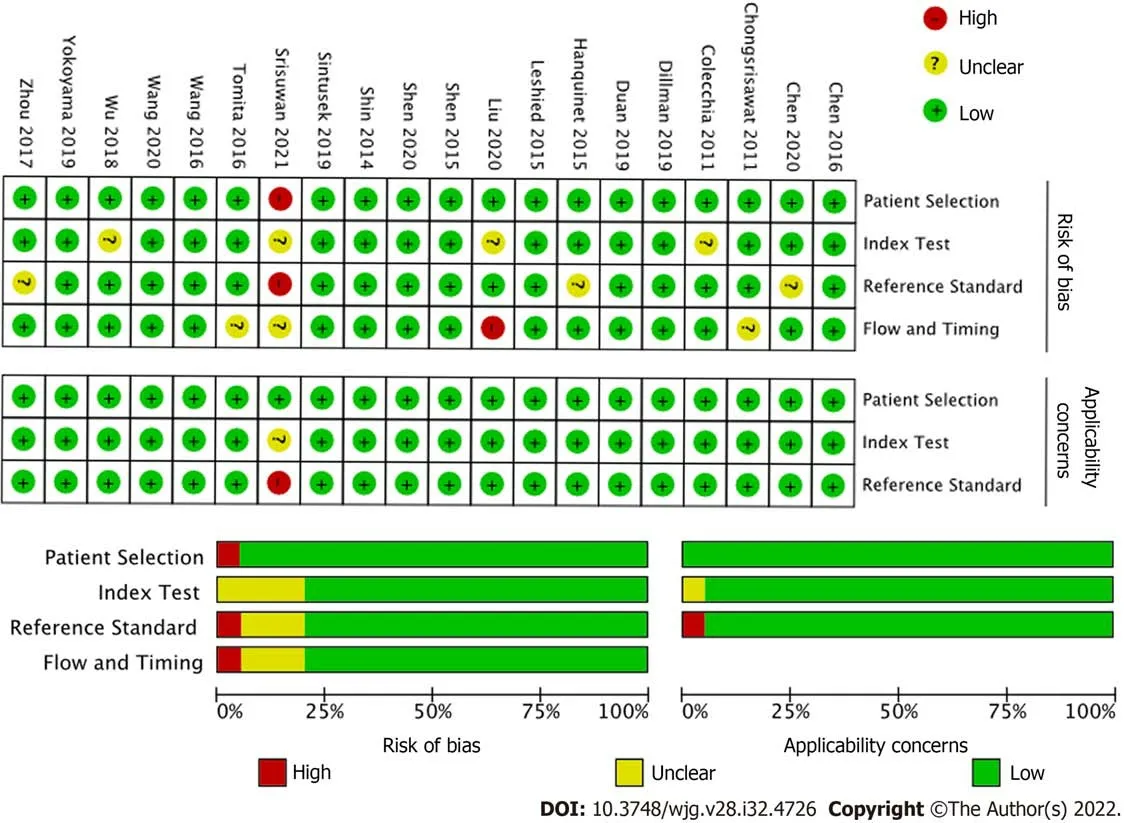
Figure 2 Quality assessment by Quality Assessment of Diagnostic Test Accuracy Studies (QUADAS-2) of the included studies.
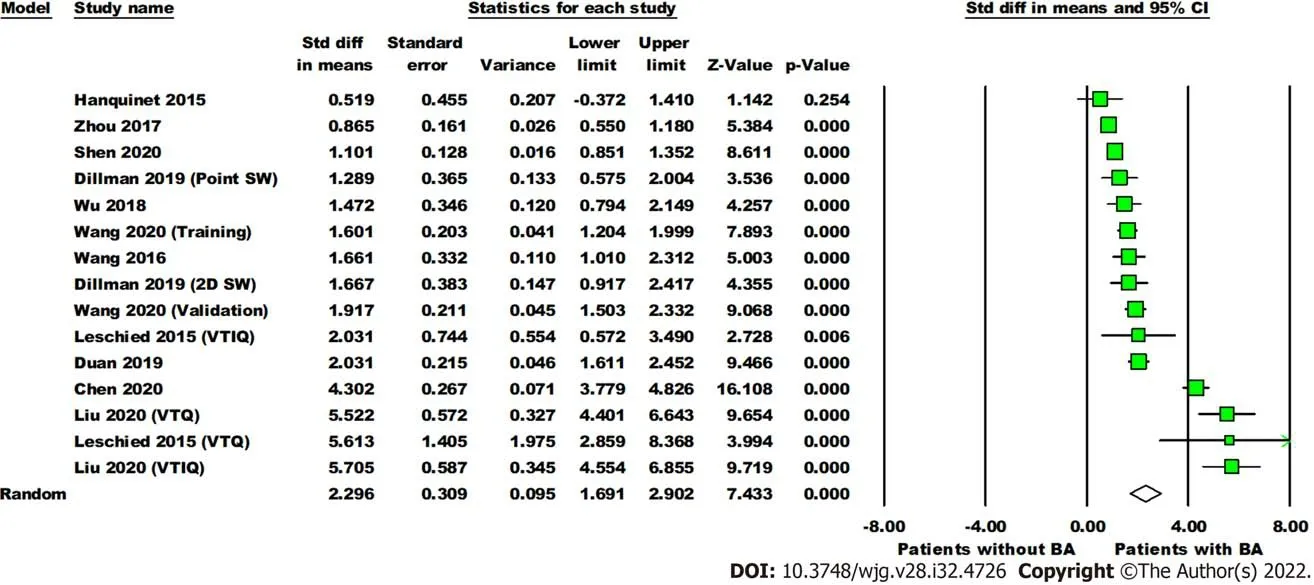
Figure 3 Forest plot comparing the liver stiffness value (Kpa) between the patients with and without biliary atresia. Dillman, Wang (2020),Leschied, and Liu each have multiple analyses due to different shear wave elastography modes and/or phases of study (training, validation). Point SW: Point shear wave elastography; 2D SW: Two-dimensional shear wave elastography; VTIQ: Virtual touch IQ, alternative nomenclature for two-dimensional shear wave elastography; VTQ: Virtual touch quantification, alternative nomenclature for point shear wave elastography.
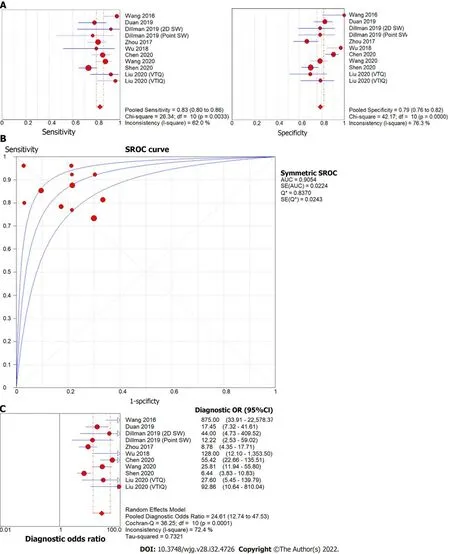
Figure 4 Forest plot of liver stiffness value measured by shear wave elastography to differentiate biliary atresia from other neonatal cholestasis. A: Diagnostic sensitivity and specificity; B: Summary receiver operating characteristic curve; C: Diagnostic odds ratio. Point SW: Point shear wave elastography; 2D SW: Two-dimensional shear wave elastography; VTIQ: Virtual touch IQ, alternative nomenclature for two-dimensional shear wave elastography;VTQ: Virtual touch quantification, alternative nomenclature for point shear wave elastography.
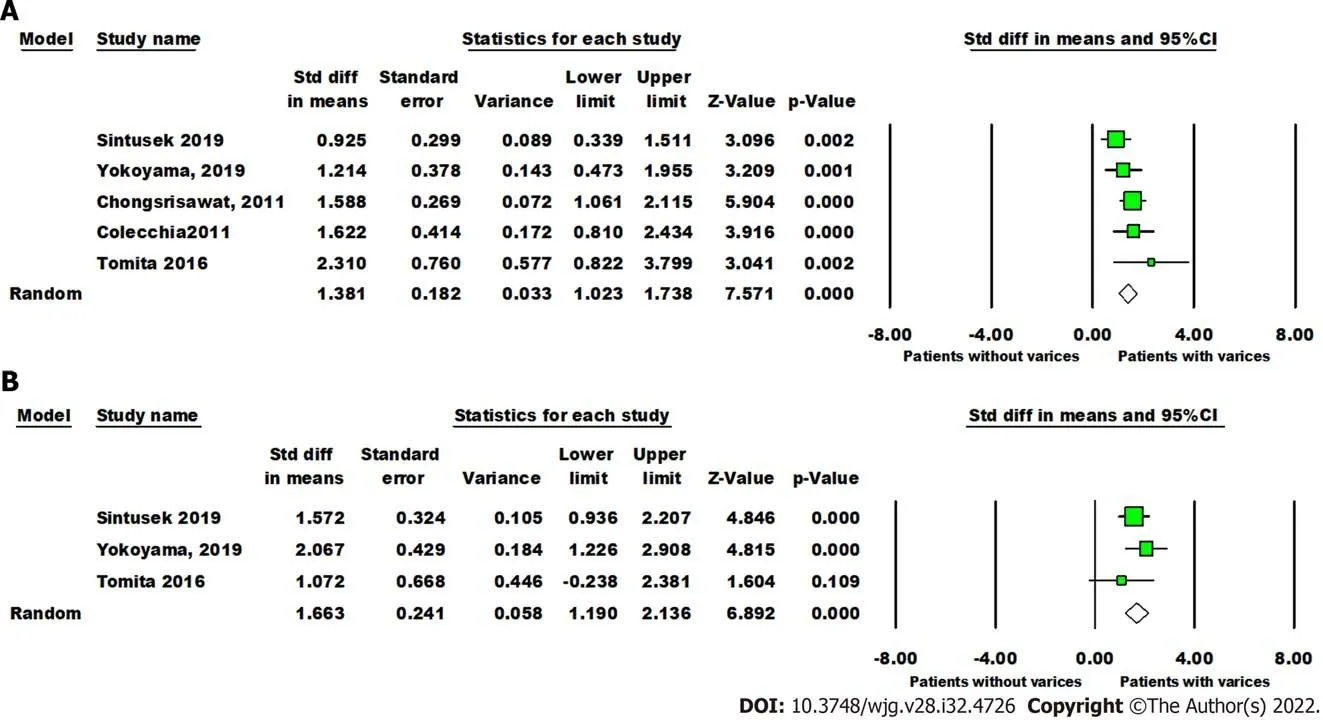
Figure 5 Forest plot comparing liver and spleen stiffness value between post-Kasai patients with or without varices. A: The liver stiffness value (Kpa); B: Spleen stiffness value (Kpa).
Post-KPE, a significant number of patients develop persistent cholestasis, portal hypertension, and progressive fibrosis. Risk stratification for these patients continues to be a clinical challenge for hepatologists. The second portion of this analysis explored the potential utility of SWE for accurately assessing the progression of hepatic fibrosis post-KPE. We observed significant differences in liver and spleen stiffness in patients with varices. The diagnostic accuracy of liver stiffness value measured by SWE was similar to spleen stiffness value to predict the presence of varices post-KPE (AUC = 0.86 and 0.92,respectively). The pooled sensitivity was comparable between liver stiffness and spleen stiffness (85%vs84%), but the pooled specificity of spleen stiffness was higher than liver stiffness (84%vs76%). Notably,only three studies investigated spleen stiffness and five investigated liver stiffness to predict the presence of post-KPE varices.
This analysis also demonstrated significant predictive efficacy for the presence and severity of biopsyproven liver fibrosis in four studies. Liver stiffness value measured by SWE to determine advanced liver fibrosis (F4vsF0-3) has high diagnostic accuracy (AUC = 0.95), sensitivity (96%) and specificity (89%).Liver stiffness value measured by SWE to differentiate between F3-4 and F0-2 fibrosis has a lower diagnostic accuracy (AUC = 0.91), with sensitivity (85%) and specificity (81%). This is in line with studies in the adult literature, which have found increased accuracy of SWE for high grade (stage F3-4)fibrosis in comparison to F0-F2[23].
Although the findings from this meta-analysis are compelling, there are notable limitations to the analysis. The studies included in this analysis were mostly small and single-center, which limits generalizability across large, non-homogenous populations. Furthermore, each study analyzed for BA diagnosis was performed on infants of different average age (with ranges from two to 140 d of life);given the rapid evolution of fibrosis in BA, the variety of ages analyzed may influence the results.
In addition to the use of different reference standards (liver biopsyvssurgical exploration or cholangiogram), there were notable differences in methodology from study to study, in particular regarding patients’ fasting status and sedation, sonographer characteristics (blindedvsnon-blinded, level of expertise,etc.), number of measurements obtained, and measurement quality standards. Previous analyses of SWE technology have highlighted significant differences in results obtained depending on sedation and fasting status, operator dependence, and probe choice[5,24-27]. This demonstrates the importance of methodological unity in comparison between data sets. While our results are promising,this is an important implication in terms of broad applicability of our meta-analysis and the need for further, well-designed trials to address the potential utility of SWE in BA.
Patient factors aside, several study centers utilized different SWE platforms (TEvspSWEvs2D-SWE)and machines (detailed in Table 1), each of which reported results in either kPa or m/s. As such,analysis relied upon interconversion of results from Young’s modulus to shear modulus (kPa to m/s)[7]. While there is a well-documented mathematical proof enabling this interconversion, the proof relies upon assumptions about tissue characteristics, notably that the tissue has constant density and homogeneity, displays isotropic and elastic characteristics, and is linear under compressible stress (Supplementary material)[7,8]. The inherent characteristics of an inflamed, potentially fibrotic liver do not fit well into this description, which is important to mention given an analysis that relies heavily on interconversion between results[28,29]. In a similar vein, a recent study by Darweeshet al[30] found that cholestasis itself can increase liver stiffness measurements in adult patients, separate to histologic findings of fibrosis; future studies must take this potential confounder into account. This meta-analysis must be interpreted within the context of these limitations, with future studies taking important steps to address potential limitations and barriers to interpretation during the study design, data collection and analysis phases of work.
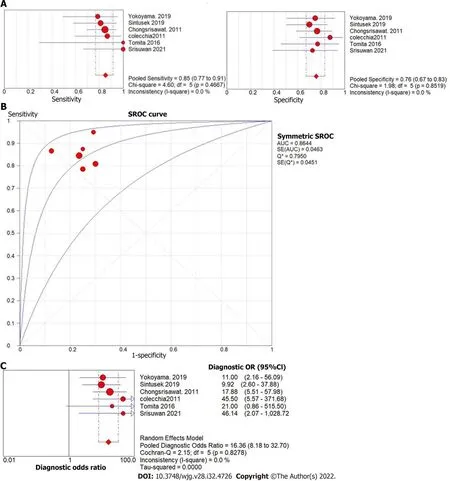
Figure 6 Forest plot of liver stiffness value measured by shear wave elastography to predict the presence of varices in post-Kasai patients. A: Diagnostic sensitivity and specificity; B: Summary receiver operating characteristic curve; C: Diagnostic odds ratio.
CONCLUSlON
Despite non-standardized methodology across analyzed articles as well as reliance upon data interconversion, this meta-analysis highlights the potential of SWE as a non-invasive method to assist in both the diagnosis as well as post-KPE follow-up of BA. Further standardized, multi-center studies are needed in order to better elucidate this potential. By applying uniform methods, machinery, and data reporting (in either kPa or m/s), further studies may be able to identify SWE as a non-invasive tool with utility both in diagnosis of BA as well as post-KPE prediction of outcomes.

Figure 7 Forest plot of liver stiffness value measured by shear wave elastography to predict the presence of liver fibrosis F4 (vs F0-3) in post-Kasai patients. A: Diagnostic sensitivity and specificity; B: Summary receiver operating characteristic curve; C: Diagnostic odds ratio.
ARTlCLE HlGHLlGHTS
Research background
Biliary atresia (BA) is a progressive infantile cholestatic disease. Diagnosis is confirmed by intraoperative cholangiogram; any delays to diagnosis and palliating Kasai hepatoportoenterostomy can increase the odds of needing liver transplant. Following Kasai, patients will need surveillance for progression of liver disease, which often requires liver biopsy.
Research motivation
Because the diagnosis and surveillance of BA both involve invasive procedures, there are risks for delay and/or adverse outcomes at each stage. By using non-invasive shear wave elastography (SWE), which measures changes in tissue stiffness, to identify liver stiffness thresholds for BA diagnosis and evolution of fibrosis post-Kasai, clinicians may be able to accurately diagnose and surveil BA without invasive procedures.
Research objectives
The authors performed a meta-analysis on studies into the utility of SWE for BA diagnosis and post-Kasai surveillance in order to determine whether existing literature could help identify liver stiffness thresholds for BA diagnosis and development of fibrosis post-Kasai.
Research methods
A literature search yielded twenty studies, eleven for diagnosis and nine for follow-up post-Kasai.Diagnostic odds ratio (DOR), sensitivity, and specificity of elastography were calculated through a random-effects model.
Research results
Mean liver stiffness in BA infants was higher than in cholestatic infants without BA with DOR 24.61,sensitivity 83%, specificity 79%. Mean liver stiffness post-Kasai was significantly higher in patients with varices than those without (DOR 16.36, sensitivity 85%, specificity 76%). SWE differentiated METAVIR F4 fibrosis from F0-F3 (DOR 70.03, sensitivity 96%, specificity 89%) as well as F3-F4 fibrosis from F0-F2(DOR 24.68, sensitivity 85%, specificity 81%).
Research conclusions
SWE may be a useful, non-invasive modality for the diagnosis and post-Kasai surveillance in BA. The analysis is limited by methodological heterogeneity between studies as well as small sample sizes.
Research perspectives
In order for SWE to be useful for future BA cases, larger, standardized, multi-center studies are recommended to establish appropriate protocols.
FOOTNOTES
Author contributions:Wagner ES performed literature search, data acquisition and interpretation, manuscript drafting, and final approval; Abdelgawad HAH performed data acquisition, statistical analysis and interpretation,manuscript structure, drafting, and revisions; Landry M performed statistical analysis and interpretation, manuscript structure and revisions; Asfour B performed figure compilation and manuscript revisions; Slidell MB performed manuscript compilation, revisions, and final approval; Azzam R performed project structure, data acquisition and interpretation, manuscript revisions, and final approval.
Conflict-of-interest statement:There are no conflicts of interest to report.
PRlSMA 2009 Checklist statement:The authors have read the PRISMA 2009 Checklist, and the manuscript was prepared and revised according to the PRISMA 2009 Checklist.
Open-Access:This article is an open-access article that was selected by an in-house editor and fully peer-reviewed by external reviewers. It is distributed in accordance with the Creative Commons Attribution NonCommercial (CC BYNC 4.0) license, which permits others to distribute, remix, adapt, build upon this work non-commercially, and license their derivative works on different terms, provided the original work is properly cited and the use is noncommercial. See: https://creativecommons.org/Licenses/by-nc/4.0/
Country/Territory of origin:United States
ORClD number:Ellen S Wagner 0000-0003-2013-5255; Hussien Ahmed H Abdelgawad 0000-0001-7101-837X; Meghan Landry 0000-0001-9822-5117; Belal Asfour 0000-0002-6562-6229; Mark B Slidell 0000-0002-9551-5888; Ruba Azzam 0000-0003-0151-2123.
S-Editor:Chen YL
L-Editor:A
P-Editor:Cai YX
杂志排行

World Journal of Gastroenterology的其它文章
- The mechanism of Yinchenhao decoction in treating obstructivejaundice-induced liver injury based on Nrf2 signaling pathway
- Anoctamin 5 regulates the cell cycle and affects prognosis in gastric cancer
- Effects of Granule Dendrobii on chronic atrophic gastritis induced by N-methyl-N'-nitro-N-nitrosoguanidine in rats
- Machine learning predicts portal vein thrombosis after splenectomy in patients with portal hypertension: Comparative analysis of three practical models
- Sirolimus increases the anti-cancer effect of Huai Er by regulating hypoxia inducible factor-1α-mediated glycolysis in hepatocellular carcinoma
- lnternational patterns in incidence and mortality trends of pancreatic cancer in the last three decades: A joinpoint regression analysis