Fast identification of mural pigments at Mogao Grottoes using a LIBS-based spectral matching algorithm
2022-09-14YimingZHANG张一鸣DuixiongSUN孙对兄YaopengYIN殷耀鹏ZongrenYU于宗仁BominSU苏伯民ChenzhongDONG董晨钟andMaogenSU苏茂根
Yiming ZHANG(张一鸣),Duixiong SUN(孙对兄),∗,Yaopeng YIN(殷耀鹏),Zongren YU(于宗仁),Bomin SU(苏伯民),Chenzhong DONG(董晨钟) and Maogen SU (苏茂根),∗
1 Key Laboratory of Atomic and Molecular Physics&Functional Materials of Gansu Province,College of Physics and Electronic Engineering,Northwest Normal University,Lanzhou 730070,People’s Republic of China
2 National Research Centre for Conservation of Ancient Wall Paintings and Earthen Sites,Dunhuang 736200,People’s Republic of China
Abstract To quickly identify the mineral pigments in the Dunhuang murals,a spectral matching algorithm(SMA) based on four methods was combined with laser-induced breakdown spectroscopy(LIBS) for the first time.The optimal range of LIBS spectrum for mineral pigments was determined using the similarity value between two different types of samples of the same pigment.A mineral pigment LIBS database was established by comparing the spectral similarities of tablets and simulated samples,and this database was successfully used to identify unknown pigments on tablet,simulated,and real mural debris samples.The results show that the SMA method coupled with the LIBS technique has great potential for identifying mineral pigments.
Keywords: mural pigments,laser-induced breakdown spectroscopy,fast identification and classification,spectral matching algorithm,spectral database
1.Introduction
The Dunhuang Mogao Grottoes,first constructed in the Former Qin period(366 CE),form one of the largest and best-preserved sites of Buddhist art in the world.This site contains 492 decorated caves and temples excavated into 1.6 km of cliff face,housing approximately 45,000 m2of mural [1].The essence of these murals lies in their painted layers,and hence the identification of the types of pigment in them is an important task in the conservation of these cultural relics.However,the pigments used in the painted layers of the mural surfaces cannot easily be distinguished,because the same or similar colors are presented by different kinds of pigment [2].This is generally because of color fading or discoloration in different areas of the murals.For example,both cinnabar and terra rossa display the same color in the red areas of the mural,but research has shown that these areas were created using different pigments [3].In addition,different shades of green can be found in different areas,depending on the contents of the murals,but they were all created using the same pigment[4].Moreover,the records of the pigments used in most of the murals and the painting production process cannot be verified.Therefore,from the perspective of mural protection,the fast identification of pigments is a crucial step in any conservation process[5],which not only helps us to trace the composition and production processes of the pigments in ancient murals,but also provides an important reference for mural protection,restoration,and material identification.
In recent years,a very promising method,the spectral matching algorithm (SMA),has been widely used in many fields.Rao et al [6]used space-borne hyperspectral imaging to develop a crop-specific spectral library and automatic identification and classification for four cultivars of rice,chili,sugarcane,and cotton crops were investigated.Wang et al[7]developed a method based on cross-correlogram spectral matching and used a time-series normalized difference vegetation index to identify interannual land cover changes.Xu et al[8]used the SMA to effectively classify and identify the terahertz spectrum data of Caulis Spatholobi and Caulis Sargentodoxae.
However,the application of SMA to pigment analysis of murals has been limited.In 2017,Chai et al[9]constructed a standard multispectral image database of the painting materials used in murals,and this database was successfully applied to real murals.In 2019,Fan et al [10]used hyperspectral technology combined with the SMA to effectively classify all the mineral pigments in an experiment.It can be seen from the above that this method is usually combined with multispectral and hyperspectral image analysis to measure the spectral similarity between material characteristics in sample identification.In fact,these applications have many limitations in analyzing ancient mural materials,because they are affected by ambient brightness,pigment particle size,mural surface restoration,and other factors [11–13]which cause the spectral signal to become unstable and lead to a degree of error between the characteristic measured spectrum of the sample and the standard spectrum in the database[14].
Laser-induced breakdown spectroscopy (LIBS) is a mature surface analysis technology [15,16],which has the advantages of high resolution,a wide detection range,and high sensitivity.In particular,the characteristic elements in LIBS spectra are obvious and less affected by the environment;high-quality LIBS spectra can be obtained,which overcomes the main shortcomings of the instability of the spectral signals obtained using hyperspectral and multispectral technologies.The development of portable LIBS has provided greater flexibility for in situ analysis in caves[17,18]and enabled this technology to be widely used in research on cultural relics such as murals,oil paintings,and clay sculptures [19–21].In addition,although the mural surface is ablated by the laser,generating ablation pits,the ablation range has been reduced to a fully acceptable level according to our previous work [22].Therefore,the combination of LIBS technology and the SMA has clear potential for use in the analysis and identification of mural paint.
This work,to the best of our knowledge,is the first to combine the LIBS technique with the SMA to identify and classify the mineral pigments in painted layers on real mural debris.The range of the spectrum was selected using the calculation results of the SMA.Through a systematic analysis of the measured spectra,a LIBS standard database of common pigments in the murals of the Mogao Grottoes was established.The feasibility of this approach was tested and the results were positive.Finally,the SMA was used to compare the spectral similarity between the spectra in the LIBS standard database and the spectra of the obtained sample.This proposed model was successfully applied to identify and classify unknown pigments on the surfaces of tablet samples,simulated mural samples and real mural debris.
2.Experimental details and methods
2.1.Experimental setup
A schematic of the experimental setup is presented in figure 1.The LIBS experiments were carried out with a laser (Dawa-100,Beamtech Co.,Ltd.) at 1064 nm with a laser pulse energy up to 100 mJ,and a laser beam 5 mm in diameter with 1–20 Hz frequency.The laser beam was focused on the surface of the mural sample through a convergent lens with a 25 mm diameter and a 100 mm focal length to generate a laser spot approximately 100 μm in diameter on the sample’s surface.The laser pulse energy irradiating the mural’s surface was monitored using an energy meter and adjusted using a polarizer.The sample was fixed to an XYZ 3D linear stage,so that the laser was able to ablate different positions.
After a plasma was induced on the sample,a convergent lens was placed at a 45°angle with respect to the laser beam’s direction to focus the plasma emission signal.The signal was then collected by an echelle grating spectrometer (LTB,ARYELLE200) using an optical fiber and detected using an ICCD detector.In line with a previous work [22],the ICCD delay time was 1800 ns,and the laser energy was set to 10 mJ.
2.2.Experimental samples
In this work,three types of pigment sample were selected:tablet samples of powders,simulated mural samples,and real mural debris.The pigment powders used in the simulation experiment were manufactured according to traditional mineral pigment processing methods in Lhasa,Tibet.To ensure that these pigments were consistent with those used in the real murals,the compositions of these mineral pigments were tested using X-ray diffraction (XRD,D/MAX2500,Rigaku).We present the results for malachite as an example in figure 2,which confirmed that the composition of these green powders was the same as those in the real murals.
Nine pigments were selected for the mineral pigment tablet samples.For each pigment,3 g was prepared and put into a mold.A pressure machine was used to apply a pressure of 20 MPa.This process was maintained for 30 min.The finished product is a round tablet with a diameter of 30 mm and a thickness of 2 mm,as shown in figure 3(a).
To reproduce the secco technique used in the Mogao Grottoes,the painted layers of the simulated samples were created using pigment powders uniformly mixed with a gelatin solution as the binding medium covering the support material[23].As shown in figure 3(b),nine pigments were used in the simulated samples.During the preparation of the simulated samples,layers approximately 10-mm thick were painted;these relatively thick painted layers ensured that the LIBS spectral data contained only information from each painted layer.The experimental samples were 2 × 2 cm2in size.
Investigations of three pigments of the painted layers on real mural debris were also performed.The mural debris,as shown in figure 3(c),was collected from a collapsed Buddha statue in a cave,which dates back to the Yuan Dynasty.At present,this debris is conserved in the laboratory of Dunhuang Academy.
2.3.Theoretical method
The core of the proposed classification method is the SMA,which includes algorithms for the Euclidean distance (ED),a spectral angle mapper (SAM),a spectral correlation mapper(SCM),and spectral information divergence (SID) [24].The classification method for the characteristic spectra is based on a comparison of the unknown spectra with the reference spectra (from a spectral library) [8].The comparison is accomplished using a similarity criterion.
The ED algorithm calculates the Euclidean distance between two samples [25,26].Two samples with more similarity yield a lower value.By contrast,a higher value indicates less similarity.However,the distance measure suffers from a high sensitivity to even small deformations.Therefore,other methods are needed for comprehensive analysis.The ED is mathematically expressed as follows:

Here,SxandSyrepresent the known spectral vector and the unknown spectral vector,respectively.
The aim of SAM is to obtain the angle formed between the reference and image spectra.The degree of similarity between the two spectra is judged using the angle [27,28].Two samples with more similarity have a lower value.The SAM is sensitive to differences in the intensity value of the spectrum.It is mathematically expressed as follows:

SCM is a spectral similarity matching method based on statistical features [29,30].In this algorithm,the similarity between two spectra is measured using a correlation coefficient.Two samples with more similarity have a lower value.The SCM is mathematically expressed as follows:

SID is derived from the concept of divergence used in information theory and can be used to describe the statistics of a spectrum[31,32].SID considers each pixel to be a random variable and uses its spectral histogram to define a probability of distribution.The spectral similarity between two pixels is measured using the discrepancy of probabilistic behaviors between their spectra.Two samples with more similarity yield a lower value.SID is mathematically expressed as follows.

3.Results and discussion
3.1.Establishment of the LIBS spectral database
First,200 spectra were measured for the paint layers of each tablet sample and simulated mural sample.Moreover,to enhance the stability of the spectral data of the pigment layer,all LIBS spectral data was normalized using the min-max method.
The elements of the mineral pigments in the mural are complex,and the characteristic elements of the various mineral pigments are different.Taking malachite and realgar as an example,figure 4 shows their typical LIBS spectra.The spectra were shown to be dominated by several elements: the main elements of malachite are Cu,Mg,Fe,and Ca,while the main elements of realgar are As,Mg,and Ca according to spectroscopic data from the National Institute of Standards and Technology (NIST) Atomic Spectra Database (ASD) [33].
Figure 5 presents the LIBS spectra for different types of malachite,showing that the LIBS spectra of these two types are slightly different.Although the characteristic elements in the spectrum of the tablet sample are consistent with those of the simulated mural sample,the overall spectral intensity obtained from the simulated mural sample of malachite is stronger than the spectral intensity obtained from the tablet sample.
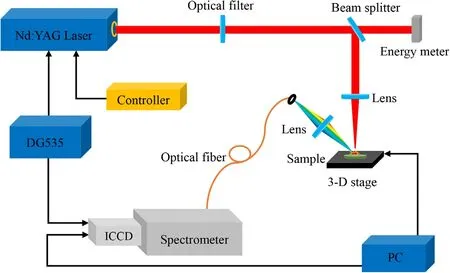
Figure 1.Schematic diagram of the LIBS experimental setup.
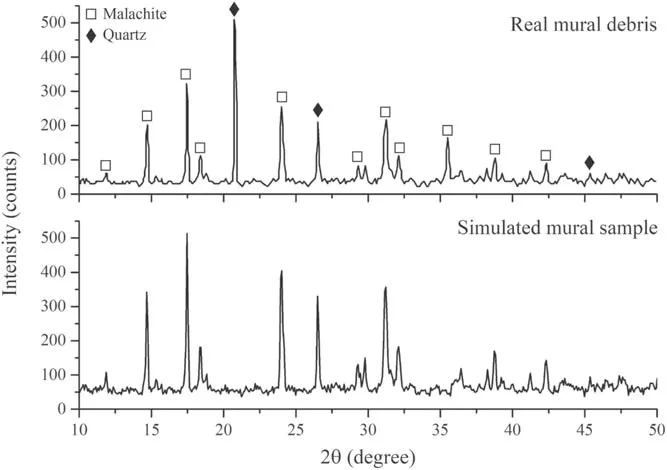
Figure 2.XRD patterns of malachite for real mural debris and a simulated mural sample.
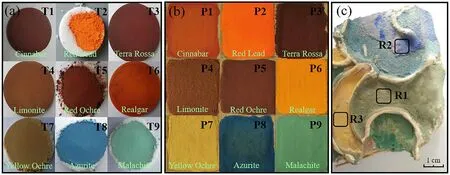
Figure 3.(a) Tablet samples,(b) simulated mural samples of mineral pigment,(c) real mural debris from the Mogao Grottoes.
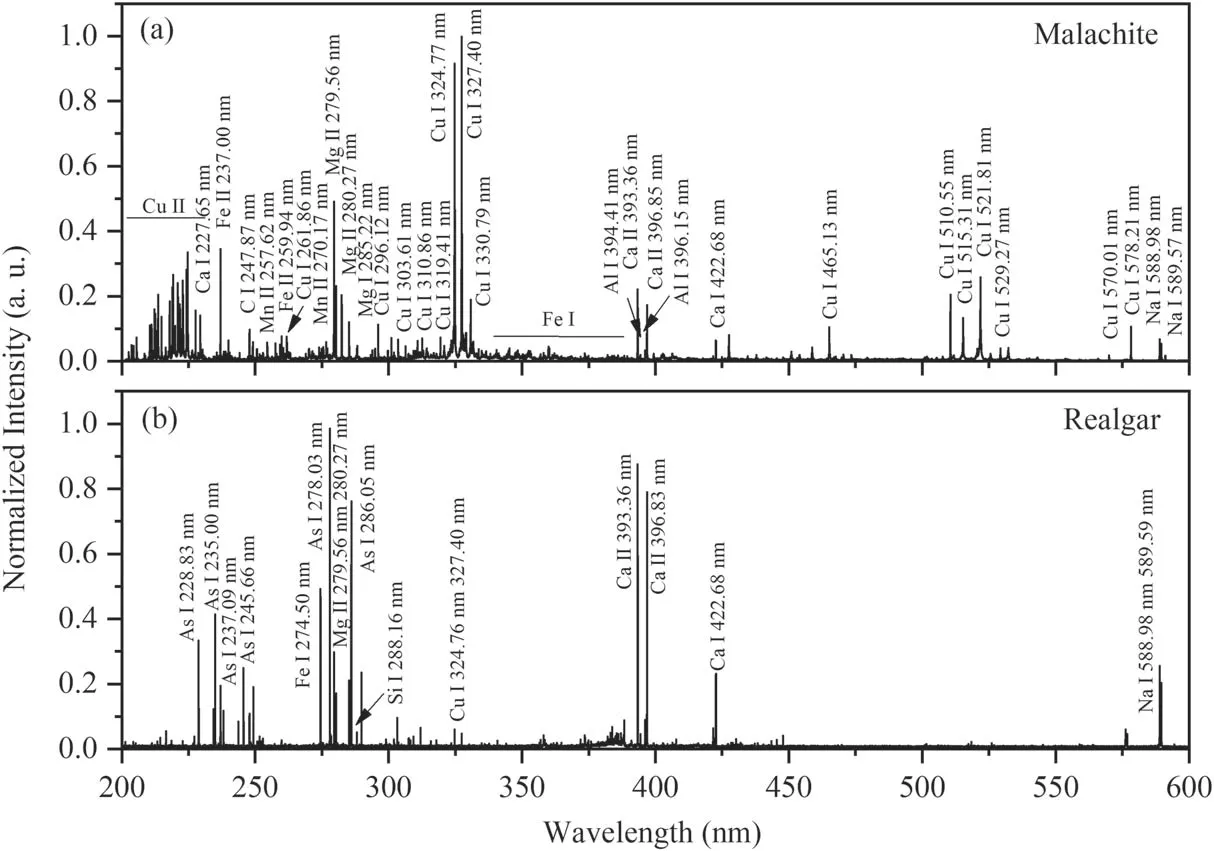
Figure 4.LIBS spectra of (a) malachite and (b) realgar obtained from the mural simulation sample.
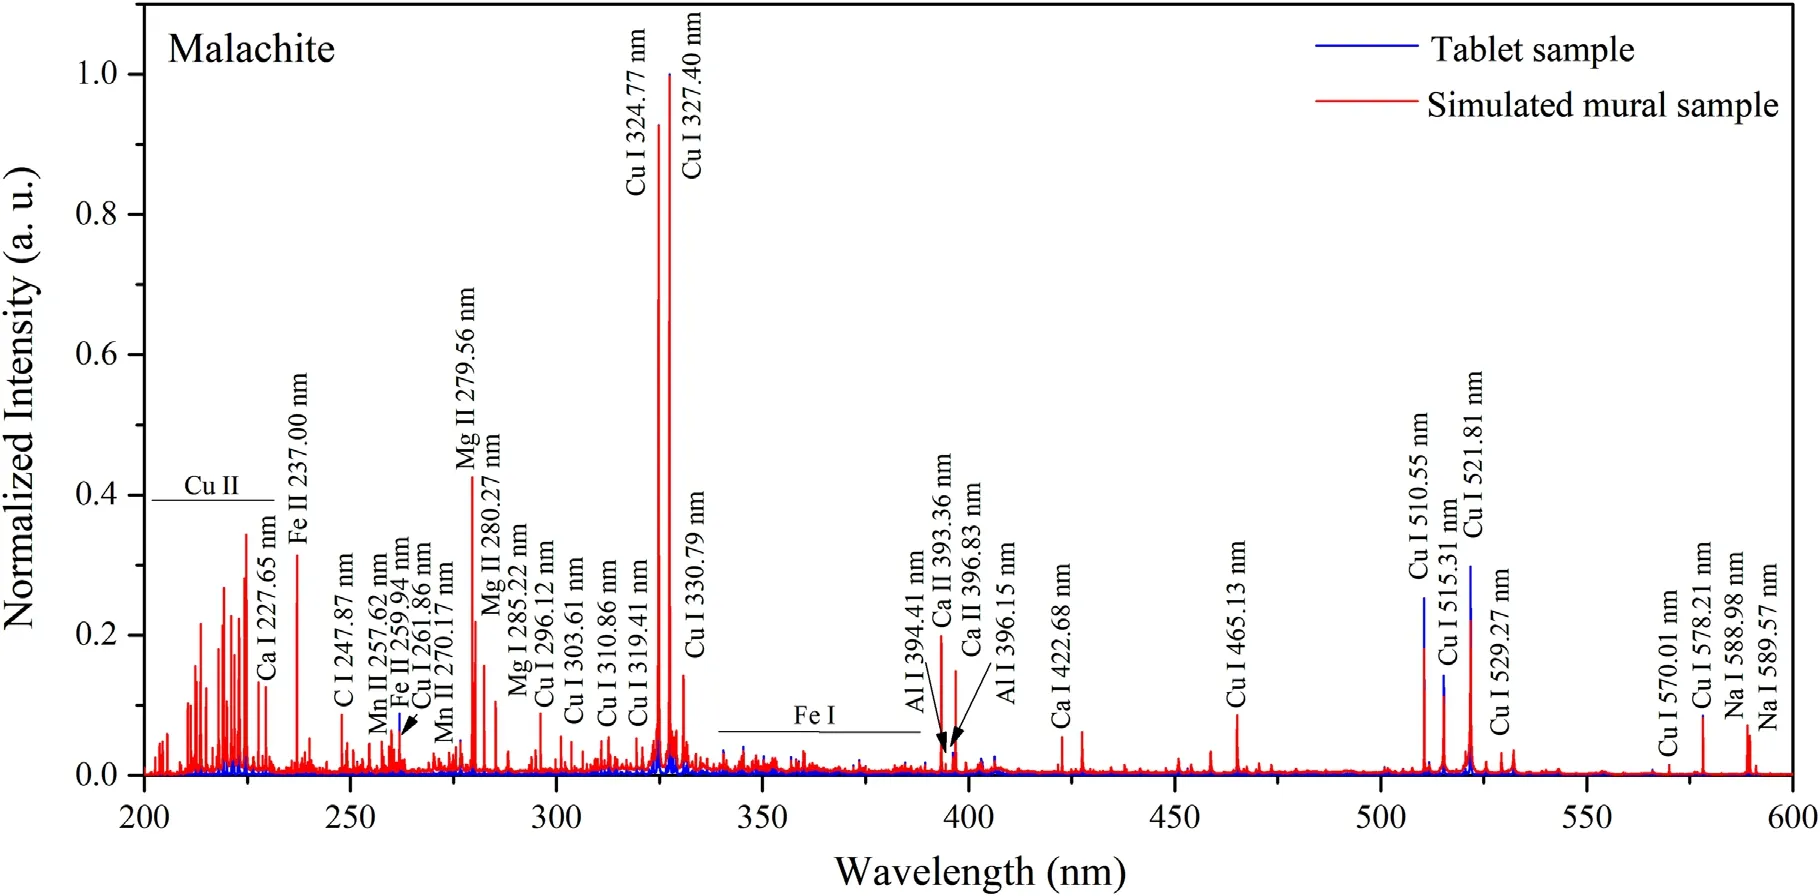
Figure 5.LIBS spectra of malachite showing the major identified lines.
To obtain more accurate similarity coefficients,the SMA was used to calculate the similarity coefficients of various pigments in different spectral ranges,as shown in table 1.The optimal range is determined by the similarity of different types of sample of the same pigment.The results show that as the spectral range is decreased,the results of the SMA improve.Its performance is best at a range of 220–420 nm.The reason for this result is that the measured spectra differ because of the different structures of the painted layers of the simulated mural and the tablet sample.The calculated results reveal that the similarity coefficient between the spectra of the two types of samples of each mineral pigment is reduced by changing the range of the spectra.This means that the selection of the spectral range can more effectively reflect the correlation between the two types of sample.Moreover,the improvement in the accuracy of this correlation improves the accuracy of identification of unknown pigments.
To verify the above conclusions,we further analyzed this issue from the perspective of the difference in spectra.In addition to their characteristic elements,the mineral pigments also contain some trace elements.The spectra recorded by the LIBS instrument covered the spectral range of 200–800 nm.Table 2 shows the distribution of the characteristic elements of various pigments,and figure 6(a)shows an example of the spectrum of malachite from the simulated mural sample.The figure shows two results of random detection of the painted layer of the simulated mural sample,and the LIBS spectrum reveals that the main elements of malachite include Cu,Mg,Fe,and Ca.In the range of 200–800 nm,we found that no obvious characteristic lines appeared after 600 nm.In a range of 200–600 nm,we observed that there are only a few characteristic spectral lines with obvious intensity in the range of 420–600 nm,including Cu I at 465.13 nm,Cu I at 510.55 nm,and Na I at 589.59 nm,among others.The characteristic spectral lines of the principal elements are distributed in the range of 220–420 nm.At the same time,we observed that the spectral backgrounds of the two detection results are different,as shown in figure 6(b).The above two points combined with the principle of the SMA explain why changes in the spectral range can improve the accuracy of the calculation results[34].Therefore,the wavelength range of all LIBS spectral data was selected to be 220–420 nm in this work.
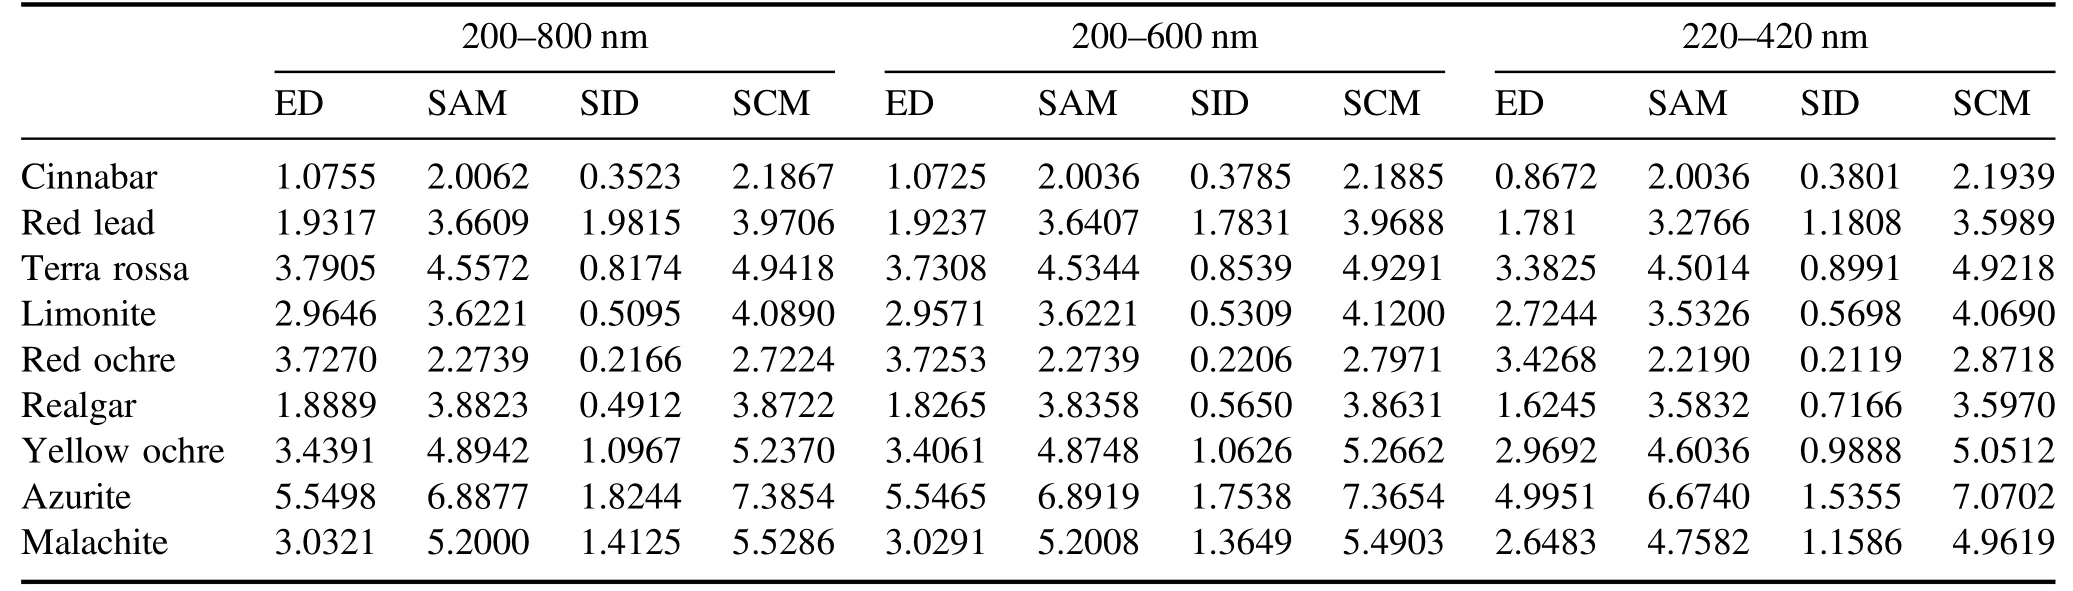
Table 1.Results of SMA for the simulated mural sample and the powder tablet sample for nine mineral pigments.

Table 2.Characteristic elements and characteristic spectral lines in common mineral pigments.
The pigments used in the painted layer of the murals are hand-ground inorganic mineral pigments,and they have a low adhesive force.To solve this problem,a certain amount of binding media was added by the ancients.However,this has a large impact on the spectra of the mineral pigments,because the composition of the binding media is complex.Therefore,we preliminarily investigated the effect of the adhesive on a pigment spectrum.
Figure 7 shows the results of the spectral similarity analysis between the pigment powder tablet sample and the simulated mural sample.The values of spectral similarity calculated for two sample types are plotted in a symmetric matrix.Four grids represent a unit,and each grid represents the result of an algorithm: SCM,SID,ED,and SAM (in that order).The final comparison is based on the sum of the four values,which are indicated by yellow and green circles.Because the correlation coefficients of the four algorithms are all inversely related to the spectral similarity,a smaller result means that the similarity between the two spectra is high.This matrix also displays the corresponding value through a color scale: a smaller result corresponds to a darker color.In this work,all symmetric matrices use the same format.On the whole,it can be seen that the similarity between different pigments is very small.Taking T1 and P2 as examples,the final calculated result is 40.22,and these two spectra are considered to be data for different materials.This shows that samples of different pigments can be classified and identified using the SMA.The results on the diagonal show that the degree of similarity between samples containing the same pigment is quite large,especially for T1 and P1,T2 and P2,T5 and P5,and T6 and P6.It can be considered that the LIBS spectra of these four pigments are less affected by the binding media.The spectral similarity of the other pigments is extremely low,especially for T8 and P8.There are large differences between the spectra of the two types of sample,which means that the use of the binding media has a substantial influence on their spectra.The results indicate that the spectra of different types cannot be mixed.Therefore,both types of sample need to be included in the database.
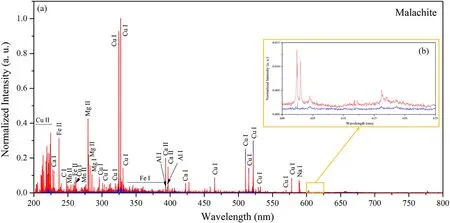
Figure 6.(a) LIBS spectrum of malachite from the simulated mural sample in the range of 200–800 nm,(b) difference in the background signals of two spectra in the range of 600–625 nm.
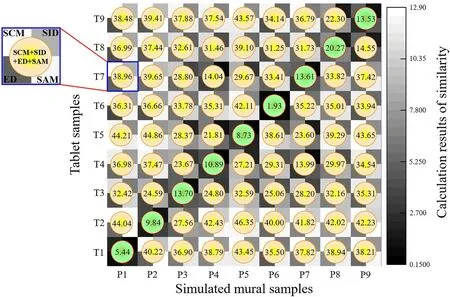
Figure 7.Similarity results for the same pigments of different sample types.
Half of the 200 measured spectra of each sample were used to establish the LIBS mineral pigment spectral database.In the following figures,the labels ‘ST’ or ‘SP’ represent the standard spectrum in the database.The other half of the spectra were used to check the database.In figure 8(a),looking along the diagonal,the degree of similarity between two powder tablet samples belonging to the same pigment is quite large.Taking T1 and ST1 as an example,the final result is zero,and the color scales of the four algorithms are all black.In contrast,in T1 and the other standard samples,the final values are very high and the color scales are all light.The results for each algorithm and the final value indicate that samples belonging to T1 can be clearly differentiated from ST2,ST3,and others.This indicates that it is feasible to combine LIBS with SMA to distinguish tablet samples of unknown pigments.It can be noted that two groups of pigment (azurite and malachite,limonite and yellow ochre) are special,and their similarities are confusing.For instance,azurite and malachite are different mineral pigments: azurite is blue and malachite is green.However,their similarities are extremely high.This phenomenon can be explained by an analysis of the chemical composition of the two pigments.The chemical composition of azurite is Cu3(CO3)2(OH)2,and the chemical composition of malachite is Cu2CO3(OH)2.The difference in their chemical composition is very small,and the main element obtained by laser ablation is Cu for both pigments,because LIBS only reflects the elemental composition.This contributes to the high similarity of the LIBS spectra of azurite and malachite.Limonite and yellow ochre also have similar spectra for the same reason.
Figure 8(b) shows the degree of similarity among the simulated mural samples containing the same pigment.The same conclusions were reached as for the tablet sample,further showing that this method can be used to identify unknown types of mural paint layer.
3.2.Classification of mineral pigments in murals
As mentioned above,the sample types selected are mainly divided into pigment power tablet samples and mural samples containing the binding media.Therefore,we need to apply the spectral database and the SMA to both sample types for identification.First,spectral acquisition was carried out for the pure pigment powders,and 100 spectra were measured for each sample.The data was processed using the method mentioned above.These spectra were compared one by one with the data of the mineral pigment powder samples in the pigment spectral database.Figure 9(a) shows that the similarities between samples T2–T7 and ST2–ST7 are very high.Although the results of ED and SAM declined slightly for T1 and ST1,T8 and ST8,and T9 and ST9,the overall results are still sufficient for accurate identification.For example,the calculated result for T1 and ST1 is 16.46,whereas the other results are more than 39.The similarity between T1 and ST1 is substantially higher than the similarity between T1 and the other standard spectra.Therefore,sample T1 is considered to belong to the same mineral pigment as sample ST1.The recognition results for T1–T9 are as follows: cinnabar,red lead,terra rossa,limonite,red ochre,realgar,yellow ochre,azurite,and malachite.
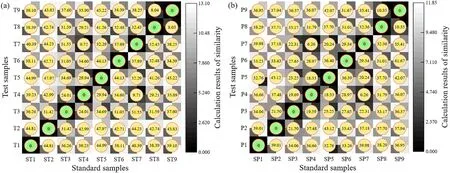
Figure 8.(a)Values calculated for each tablet sample spectrum(T1–T9)and standard database spectrum(ST1–ST9),(b)values calculated for each simulated mural sample spectrum (P1–P9) and standard database spectrum (SP1–SP9).

Figure 9.(a) Spectral similarity results for unknown powder tablet samples (T1–T9) and the standard database (ST1–ST9),(b) spectral similarity results of an unknown simulated mural sample (P1–P9) and the standard database (SP1–SP9).
For the simulated mural samples,nine mineral pigments were collected for the LIBS spectra under optimum conditions.For each sample,100 spectra were measured,and the data was processed using the method mentioned above.As shown in figure 9(b),the color scales and the calculated values indicate that samples P3–P7 correspond to samples SP3–SP7,respectively.Although the results for P1 and SP1,P2 and SP2 are slightly lower,their similarities are still the highest in the same series of comparisons.The inhomogeneity of the experimental samples is one of the reasons for the inconsistent results.It should be noted that the identification results for samples P8 and P9 are incorrect,but the reason for this error has been explained above.The recognition results for P1–P7 are as follows: cinnabar,red lead,terra rossa,limonite,red ochre,realgar,and yellow ochre.The recognition results for the other samples were not excellent.The performance of the proposed method on the simulated mural samples was worse than its performance on the tablet samples.The reason for this might be that the tablet sample consists of pure mineral pigment,but the simulated mural sample contains binding media.In addition,the simulated mural sample has a rough and uneven surface.These factors can substantially affect the spectrum.
Furthermore,in contrast to the surface of a material measured in a laboratory environment,the surface of a real mural is substantially more complex,as the murals have suffered various forms of damage.To achieve the aim of fast,in situ identification,the model was used to identify and classify unknown pigments on real mural debris.Because the real murals are precious and vulnerable,only 20 spectra were collected.The data was processed using the method described above.R1,R2,and R3 are different areas on the real mural debris,as shown in figure 3(c).Figure 10 presents the results of the recognition,which indicate that the matching results for R1,R2,and R3 are malachite,azurite,and realgar,respectively.The results of the classification method based on the combination of LIBS and SMA are consistent with the XRD analysis results obtained in our previous work [19].
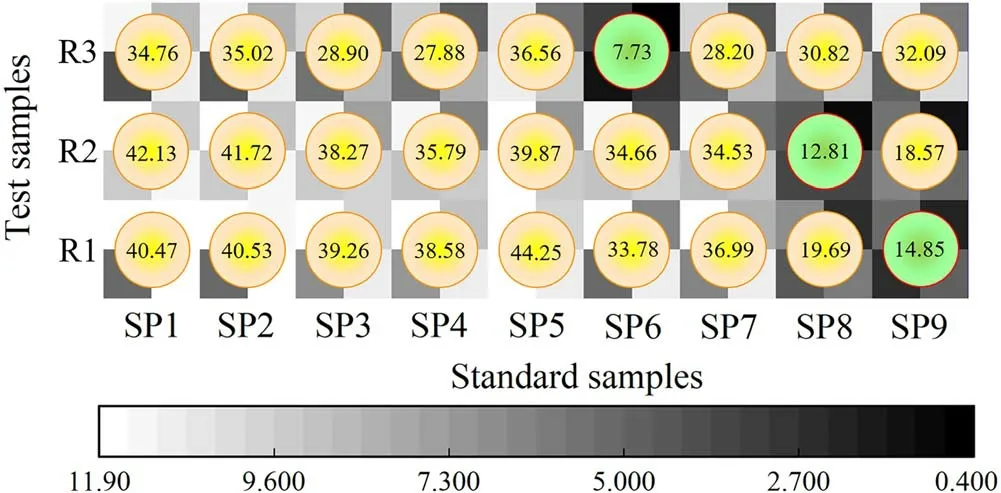
Figure 10.Spectral similarity results for the mural debris (R1–R3)and the standard database (SP1–SP9).
In summary,this work on the three types of sample using the SMA found that the SMA approach has a variable ability to identify different pigments,but its overall recognition results are relatively good.These results are sufficient to show that this approach is a potential method for identifying unknown pigments in the paint layer of murals,which will help the selection of suitable methods and materials for conservation.
4.Conclusion
In our study,a LIBS spectral database and the SMA were used to classify and identify mural pigments.The optimal wavelength range to maximize the accuracy of the similarity values was determined to be 220–420 nm.Considering the influence of the binding media on the LIBS spectrum and the similarity values between spectra,a LIBS spectrum database was established for different types of sample.
Moreover,the ability of this method to identify unknown pigments was confirmed using the spectral database and the SMA to identify pigments in powder tablet samples and simulated mural samples.Therefore,this method was further applied to real murals.It was found that this method can also successfully classify and identify unknown pigments on real mural debris.
The above investigation reveals that this method will be significant for the study of murals in the Mogao Grottoes.It is an efficient approach that quickly identifies mineral pigments.
Acknowledgments
This work was supported by the National Key Research and Development Program of China (No.2019YFC1520701),National Natural Science Foundation of China(Nos.61965015,61741513),the 2020 Industry Support Plan Project in University of Gansu Province (No.2020C-17),the Young Teachers Scientific Research Ability Promotion Plan of Northwest Normal University Province (No.NWNW-LKQN2019-1),and the Funds for Innovative Fundamental Research Group Project of Gansu Province (No.21JR7RA131).
杂志排行

Plasma Science and Technology的其它文章
- Image-based plasma morphology determination and LIBS spectra correction in combustion environments
- Rapid identification of volatile organic compounds and their isomers in the atmosphere
- Aqueous ruthenium detection by microwaveassisted laser-induced breakdown spectroscopy
- Effect of lens-to-sample distance on spatial uniformity and emission spectrum of flat-top laser-induced plasma
- Quantitative analysis of the main components in ceramic raw materials based on the desktop LIBS analyzer
- Elemental and proximate analysis of coal by x-ray fluorescence assisted laser-induced breakdown spectroscopy