Space Environment Measurements and Applications on the Tianhe Core Module of China Space Station
2022-08-18LIUSiqingSUNYueqiangZHONGQiuzhenWEIFeiLINRuilinLIZhitaoRENTinglingLIYongpingZHANGXianguoZHANGShenyiLUOBingxianCHANGZhenWANGChunqinPENGSongwuAIJiangzhao
LIU Siqing SUN Yueqiang ZHONG Qiuzhen WEI Fei LIN Ruilin LI Zhitao REN Tingling LI Yongping ZHANG Xianguo ZHANG Shenyi LUO Bingxian CHANG Zhen WANG Chunqin PENG Songwu AI Jiangzhao
1(State Key Laboratory of Space Weather, National Space Science Center, Chinese Academy of Sciences, Beijing 100190)
2(Key Laboratory of Science and Technology on Environmental Space Situation Awareness,Chinese Academy of Sciences, Beijing 100190)
3(University of Chinese Academy of Sciences, Beijing 100049)
Abstract Tianhe Core Module of China Space Station (CSS) equips a set of instruments consisting of a Particle Fluxes and Solar Activity Detector (PFSAD) and two Atmospheric Density Multi-directional Detectors (ADMDs).The PFSAD is to measure X-rays from the Sun and energetic particles in the low-latitude and low altitude regions,including electrons,protons,and helium ions.The ADMDs are to measure thermospheric atmospheric density.The instruments provide real-time data of the orbital space environment,including solar flares,energetic particle variation and thermospheric density enhancement.All the data contribute to the CSS space weather service for mission control and astronaut’s safety.The paper gives preliminary analyses of the space environment measurements from the PFSAD and the ADMDs.By further analysis,the 1024-channel fine spectra of the solar X-ray can be used to study the mechanism of solar flares and their impacts on the Earth’s atmosphere.Data accumulation will be helpful for analyzing mid-term and long-term variations of the South Atlantic Anomaly and atmosphere density.Furthermore,the data are useful to calibrate previous empirical models and establish new models to study the space environment.
Key words Space environment,Tianhe core module,China Space Station (CSS)
1 Introduction
The radiation environment of Low Earth Orbit (LEO) is dependent on altitude and inclination of the spacecraft’s orbit and changes with the solar activity.Tianhe,the core module of China Space Station (CSS),was launched into an orbit with 350–400 km altitude and about 42° inclination on 29 April 2021.The radiation particles from Galactic Cosmic Radiation (GCR),the Earth’s inner radiation belts and occasional Solar Particle Events (SPEs),as well as secondary particles,are capable of entering Tianhe.As a result,the exposure the crew receives during an extended spaceflight significantly exceeds exposure limits for terrestrial radiation workers[1].Since the early times of human spaceflight,space radiation,especially its heavy ion component,has been recognized as a main health concern for human space missions[2–3].Usually several astronauts reside in Tianhe for a few months,and carry out the extravehicular activities (EVAs) missions.Thus the need for radiation monitoring on the CSS for purposes of crew safety has been apparent.
In LEO the air drag force is considered to be the predominant perturbing force[4].The uncertainties in the upper atmosphere modeling may significantly degrade the mission performance in many LEO activities,such as satellite and debris impact risk evaluation,collision avoidance maneuver planning,spacecraft lifetime and re-entry time evaluation[5].The drag force on satellites increases when the Sun is active.For the CSS,the precise estimate of thermospheric atmosphere density is vital to the mission control.
Tianhe equips a Particle Fluxes and Solar Activity Detector (PFSAD) and two Atmospheric Density Multidirectional Detectors (ADMDs) which provide in-situ measurements of radiation particles,solar X-ray flux and thermospheric atmosphere density.CSS will be in orbit for 10 to 15 years,therefore in-situ measurements can describe space environment disturbances in both shortand mid-term scales,and even variations in long-scale spanning over one solar cycle.The observations are key to CSS orbital space weather forecast,and moreover can effectively improve the accuracy of the thermospheric density models and radiation belt models.
2 Space Environment Detectors
2.1 Particle Flux and Solar Activity Detector
The PFSAD consists of three components.The unit of high-energy proton monitor is made of five pieces of silicon semiconductor sensors with 12 mm in diameter and 500 micron to 1 mm in thickness.The unit of high-energy electron monitor uses six pieces of silicon semiconductor sensors with 8 mm to 12 mm in diameter and 300 micron to 1 mm in thickness,and the unit of solar X-ray monitor uses two Silicon Drift Sensors (SDD).PFSAD is mounted outside the Tianhe Core Module.
The PFSAD measures solar X-ray and energetic particles in the low-latitude regions,including electrons,protons,and helium ions.It has 9 channels for electrons with 0.2–2.0 MeV and ≥2.0 MeV,6 channels for protons with 4.0–165 MeV and ≥165 MeV,and 3 channels for helium ions with 4.0–16.4 MeV and ≥16.4 MeV.The full-angle circular conical FOV (field-ofview) for electrons,protons and helium ions are 40°,60°and 60°,respectively.The PFSAD was turned on 2 days after launch and provides the data of particle count rates with 2 s resolution since 1 May 2021,which can be converted to particle unidirectional integral fluxes by geometry factors.The details of particle channels and X-ray channels of the PFSAD instrument are listed inTable 1andTable 2,respectively.

Table 1 Information of energetic particle channels of PFSAD

Table 2 Information of Solar X-ray channels of PFSAD
2.2 Atmospheric Density Multi-directional Detectors (ADMDs)
The Tianhe Core Module was equipped two same Atmospheric Density Multi-directional Detectors (ADMDs).The ADMD-1 and ADMD-2 are symmetrically mounted at the II–III and I–IV quadrant of the large column section outside the core module.The design can adapt to the different flight attitude of the CSS and achieve the full-direction atmospheric density data.The measurement atmospheric density is in the range of 5×10–15–5×10⁻¹⁰kg·m–3.Sampling chamber pressure and temperature are in the ranges of 5×10⁻⁷–1×10⁻³Pa and–20℃ to+70℃,respectively.
3 Data Processing
3.1 Energetic Particle Flux Data Processing
Data processing requires the physical quantity conversion and orbital position matching to generate the energetic particle fluxes including the electrons,protons and heavy ions from the original count rates.
The energetic particle flux conversion function is as follows:

Here the flux unit is cm–2·s–1·sr–1,RCrepresents count rate,andGirepresents the geometric factors of various channels which are listed inTable 3.

Table 3 Geometric factors of various channels of different particles
3.2 Solar X-ray Flux Data Processing
The data processing of solar X-ray flux mainly includes three steps:the first is to remove background noise,the second is to calculate the X-ray effective area and the transmission efficiency,and the third is to transform the X-ray flux into the standard unit (in unit of W·m–2or J·s–1·m–2).
Environmental background noise mainly comes from the cosmic X-ray and energetic particles in the South Atlantic Anomaly (SAA).The temperature of the PFSAD in operation can change the background noise level as well,which should be calibrated according to the temperature,and be deducted in the data processing.When the PFSAD passes through the SAA,energetic particles may directly enter the sensor or interact with collimator and materials surrounding the detector,producing the background counts.The noise level caused by the SAA is generally less than a C2-level solar flare.In the current data processing,the data of X-ray flux will be marked when the PFSAD flies through the SAA.
The effective area and transmission efficiency of the solar X-ray mainly depend on the incidence angle and the transmission path of the X-ray into the SDD sensors.After unifying the PFSAD and the sun in the same coordinate system,we could determine whether the Xray irradiation is in the observing FOV and the SDD number and the irradiation area according to the angle between the solar X-ray incident direction and the normal directions of the two SDD sensors.The solar X-ray is first penetrating the 1 mm Be window,then reaching the SDD sensor and penetrating 20 μm Be film,and finally be absorbed by the 450 μm Si sensor.According to the solar X-ray incidence angle and the actual path,the total X-ray transmission efficiency is calculated.
The integration time of data is 1 s in normal mode,when in event mode the integration time of each data packet is 5 s.Eq.(2) gives the conversion between X-ray proton counts and flux value.

Here,Nis the photon counts after removing X-ray channel noise;Erepresents photon energy in unit eV;Aeffis the effective irradiation area of X-ray on the SDD sen-sor in unit of m2;tis the integral time in unit of s;ηtotalis the total transmission efficiency of X-ray;andCis equal to 1.602×10⁻¹⁹J,corresponding to the energy of 1 eV.
3.3 Thermospheric Atmosphere Density Data Processing
According to the gas molecular dynamics theory,the thermospheric atmosphere density can be directly obtained by the pressure and temperature measurements in the sampling chamber.Therefore,when the gas molecules (atoms) enter the sampling chamber with the regulating plate through the standard measuring hole,the incoming gas molecules (atoms) undergo collision with the sampling chamber wall and the regulating plate,and its temperature is adjusted to approximate the wall temperature.The thermospheric atmosphere mass density is calculated by Eq.(3) and Eq.(4).

Here,ρis the free atmospheric mass density in unit of kg·m–3;Nais the number density of free atmosphere in unit of counts·m–3;Pgis the gas atmospheric pressure in the sensor in unit of Pa;Tgis the gas temperature in the sensor in unit of K;m1is the average mass of gas molecules in the sensor in unit of kg;m2is the average molecular mass outside the sensor gas in unit of kg;kis the Boltzmann constant(dimensionless);Vis the speed of core module or assembly in unit of m·s–1;θis the angle between the outside normal vector of sampling hole and core module velocity vector,called the angle of attack in unit of degree.
Data processing steps are as follows.
(1) Determine the working situation of the main filament or backup filament by detecting the voltage value of the sensor filament,and then convert the L1 level scientific data (pressure voltage value and temperature voltage value from sampling chamber) into the corresponding physical quantity through the ground calibration data.
(2) Solve the speed and angle of attack of the core module,and select the sensor on the windward side according to the calculated angle of attack.
(3) Calculate the orbital atmospheric density by Eqs.(3) and (4) using the pressue and temperature obtained from the sensor on the windward side selected in Step 2.
4 Data analysis and Applications
4.1 Solar X-ray Flux Data Analysis and Application
Solar X-Ray Sensors (SRS) measure the full-disk total solar flux in two main channels,ten fine channels and 1024 fine channels in flare mode with flux threshold of C5-X30 flare.The Tianhe Core Module orbits the Earth every 90 min passing through the insolation zone and the earth shadow zone periodically.The effective X-ray flux observation window is 40–60 min in inertial attitude,and 20–40 min in 3-axis stabilized attitude within one orbital period.The lifetime of solar flares is usually less than one hour.Thus solar flares are fully visible or partially visible,even invisible to the solar X-ray sensor due to the discontinuity of the observed FOV.
Usually PFSAD provides solar X-ray flux of two main channels and ten fine channels.It also provides 1024 channels X-ray flux when solar flares erupt.To evaluate the data detected by PFSAD,GOES-16 satellite was selected to make a comparison with solar X-ray flux.Fig.1gives the solar X-ray flux from two main channels of PFSAD (solid lines) and from GOES-16 satellite (dotted lines) on 28 October 2021.PFSAD observed peak flux with 1.02×10⁻⁴W·m–2in the 1–8 Å and with 1.78×10⁻⁵W·m–2in the 0.5–4 Å at 15:32 UTC.GOES-16 observed peak flux with 1.0×10⁻⁴W·m–2in the 1–8 Å and with 1.66×10⁻⁵W·m–2in the 0.5–4 Å at 15:34 UTC.The values of peak flux from both satellites are very close.However,in the early and late stages of the flare,the X-ray flux monitored by PFSAD is slightly lower than that by GOES-16 satellite.The possible reason was the deviations in the low-energy channels of PFSAD.

Fig.1 X-ray flux (1-minute data) on 28 October 2021
GOES-16 satellite screens the stray light through multilayer filters,thus the low energy X-ray,especially below 1.5 keV,also can be monitored and collected.The hardware condition of PFSAD determines that X-ray below 1.5 keV will be cut off.Meanwhile,the X-ray flux in the lower energy channels is higher,so the X-ray flux in the flare early outbreak and decline phase is relatively low.Fig.2gives X-ray flux in the ten fine passbands of the same X1.0 flare.It can be seen as the energy passbands rise,the peak flux gradually decreases.X-ray flux in high energy passbands rises and decreases more steeply than that in lower energy passbands.

Fig.2 X-ray flux in ten fine passbands of X1.0 flare on 28 October 2021
Due to the discontinuity of the FOV,part of the flares can be detected by PFSAD.From 1 May 2021 to 18 April 2022,PFSAD observed 20 M-class flares and 2 X-scale flares whose peaks were fully visible among total 61 M-class and 4 X-class flares which were monitored by GOES-16 satellite.Table 4shows the X-ray peak flux of these 22 flare events.The absolute deviation of solar X-ray peak flux between PFSAD and GOES satellite is from 1.00×10⁻⁷to 2.4×10⁻⁵W·m–2,and the average value is 4.0×10⁻⁶W·m–2.The peak flux of solar X-ray flares from two satellites are very close.

Table 4 Peak flux of 22 X-ray flares from May 2021 to April 2022 (1–8 Å)
The solar X-ray flux observed by Tianhe Core Module reflects the solar activity and provide effectively warning of solar erupting,such as solar proton events and coronal mass ejections.The fine channels data can help to study the solar X-ray flare bursts and their mechanisms.
4.2 Energetic Particle Flux Data Analysis and Application
The China’s space station passes through the SAA several times each day.The PFSAD onboard it detects the energetic electrons,protons,and helium ions in the most regions of SAA in these altitudes,except for some highlatitude regions,and monitors the variations of energetic particle intensities and the boundary of SAA in real time.For strong solar proton events,some solar protons can be detected by the PFSAD when the magnetic latitudes of the CSS exceed a certain value.
Fig.3shows the unidirectional integral fluxes of 0.2–0.3 MeV electrons,4–9 MeV protons and 4–12.5 MeV/u helium ions from the PFSAD and the orbit altitudes between 1 May 2021 and 8 May 2022.The data ofKpindex inFig.3(e) are from GFZ German Research Centre.The upper bounds inFig.3(a),3(b) and3(c)roughly represent the peak intensities of energetic electrons,protons,and helium ions in the SAA,respectively.It is shown that the data of energetic particles are basically continuous from 1 May 2021,the peak intensities of energetic electrons vary obviously and sometimes change by more than 2 orders of magnitude on time scales ranging from minutes to days,especially when geomagnetic storms occur,and the peak intensities of energetic protons and helium ions are relatively stable,only several fold variation at most.

Fig.3 Unidirectional integral fluxes of 0.2–0.3 MeV electrons,4–9 MeV protons and 4–12.5 MeV/u helium ions from CSS and the orbit altitudes between 1 May 2021 and 8 May 2022
In order to get the whole shape and distribution of SAA at the altitudes of CSS,the data from PFSAD between 1 January 2022 and 8 May 2022 are used to create the dataset of latitude and longitude grids with 0.5 degree intervals.The average unidirectional integral fluxes of electrons,protons,helium ions in each grid are plotted in the longitude-latitude coordinates,shown inFigs.4and5,and the SAA of electron,proton and helium ion radiation belts are clearly outlined.Both figures illustrate that the proton and electron intensities of SAA changes with energy,and their boundaries are also related to the particle energy.

Fig.4 Distribution of 0.2–1.0 MeV electrons with 6 channels measured by China Space Station between 1 January 2022 and 8 May 2022
When the electron energies are less than 1.0 MeV,the electron intensities and the area of SAA decrease with increasing energy.The results are the same as the protons of SAA.However,the results are just the opposite when the electron energies are larger than 1.0 MeV.According the result of Liet al.[6]and Fennellet al.[7],there are no significant fluxes of MeV electrons in the inner radiation zone,so the E7,E8 and E9 channels of the PFSAD are likely polluted by the unforgiving penetration of the highly energetic protons (tens of MeV to GeV).In the E1 and E2 channels,a small amount of electrons polluted by the cosmic rays are detected near the 40° north and south latitudes outside the SAA.For these polluted data of electrons,further data processing is required.InFig.5(h) and5(i),there are no significant fluxes of helium ions.It proves that the integral fluxes of≥12.5 MeV/u helium ions are less than 1 cm–1·s–1·sr–1,below the lower detection limit of the PFSAD.
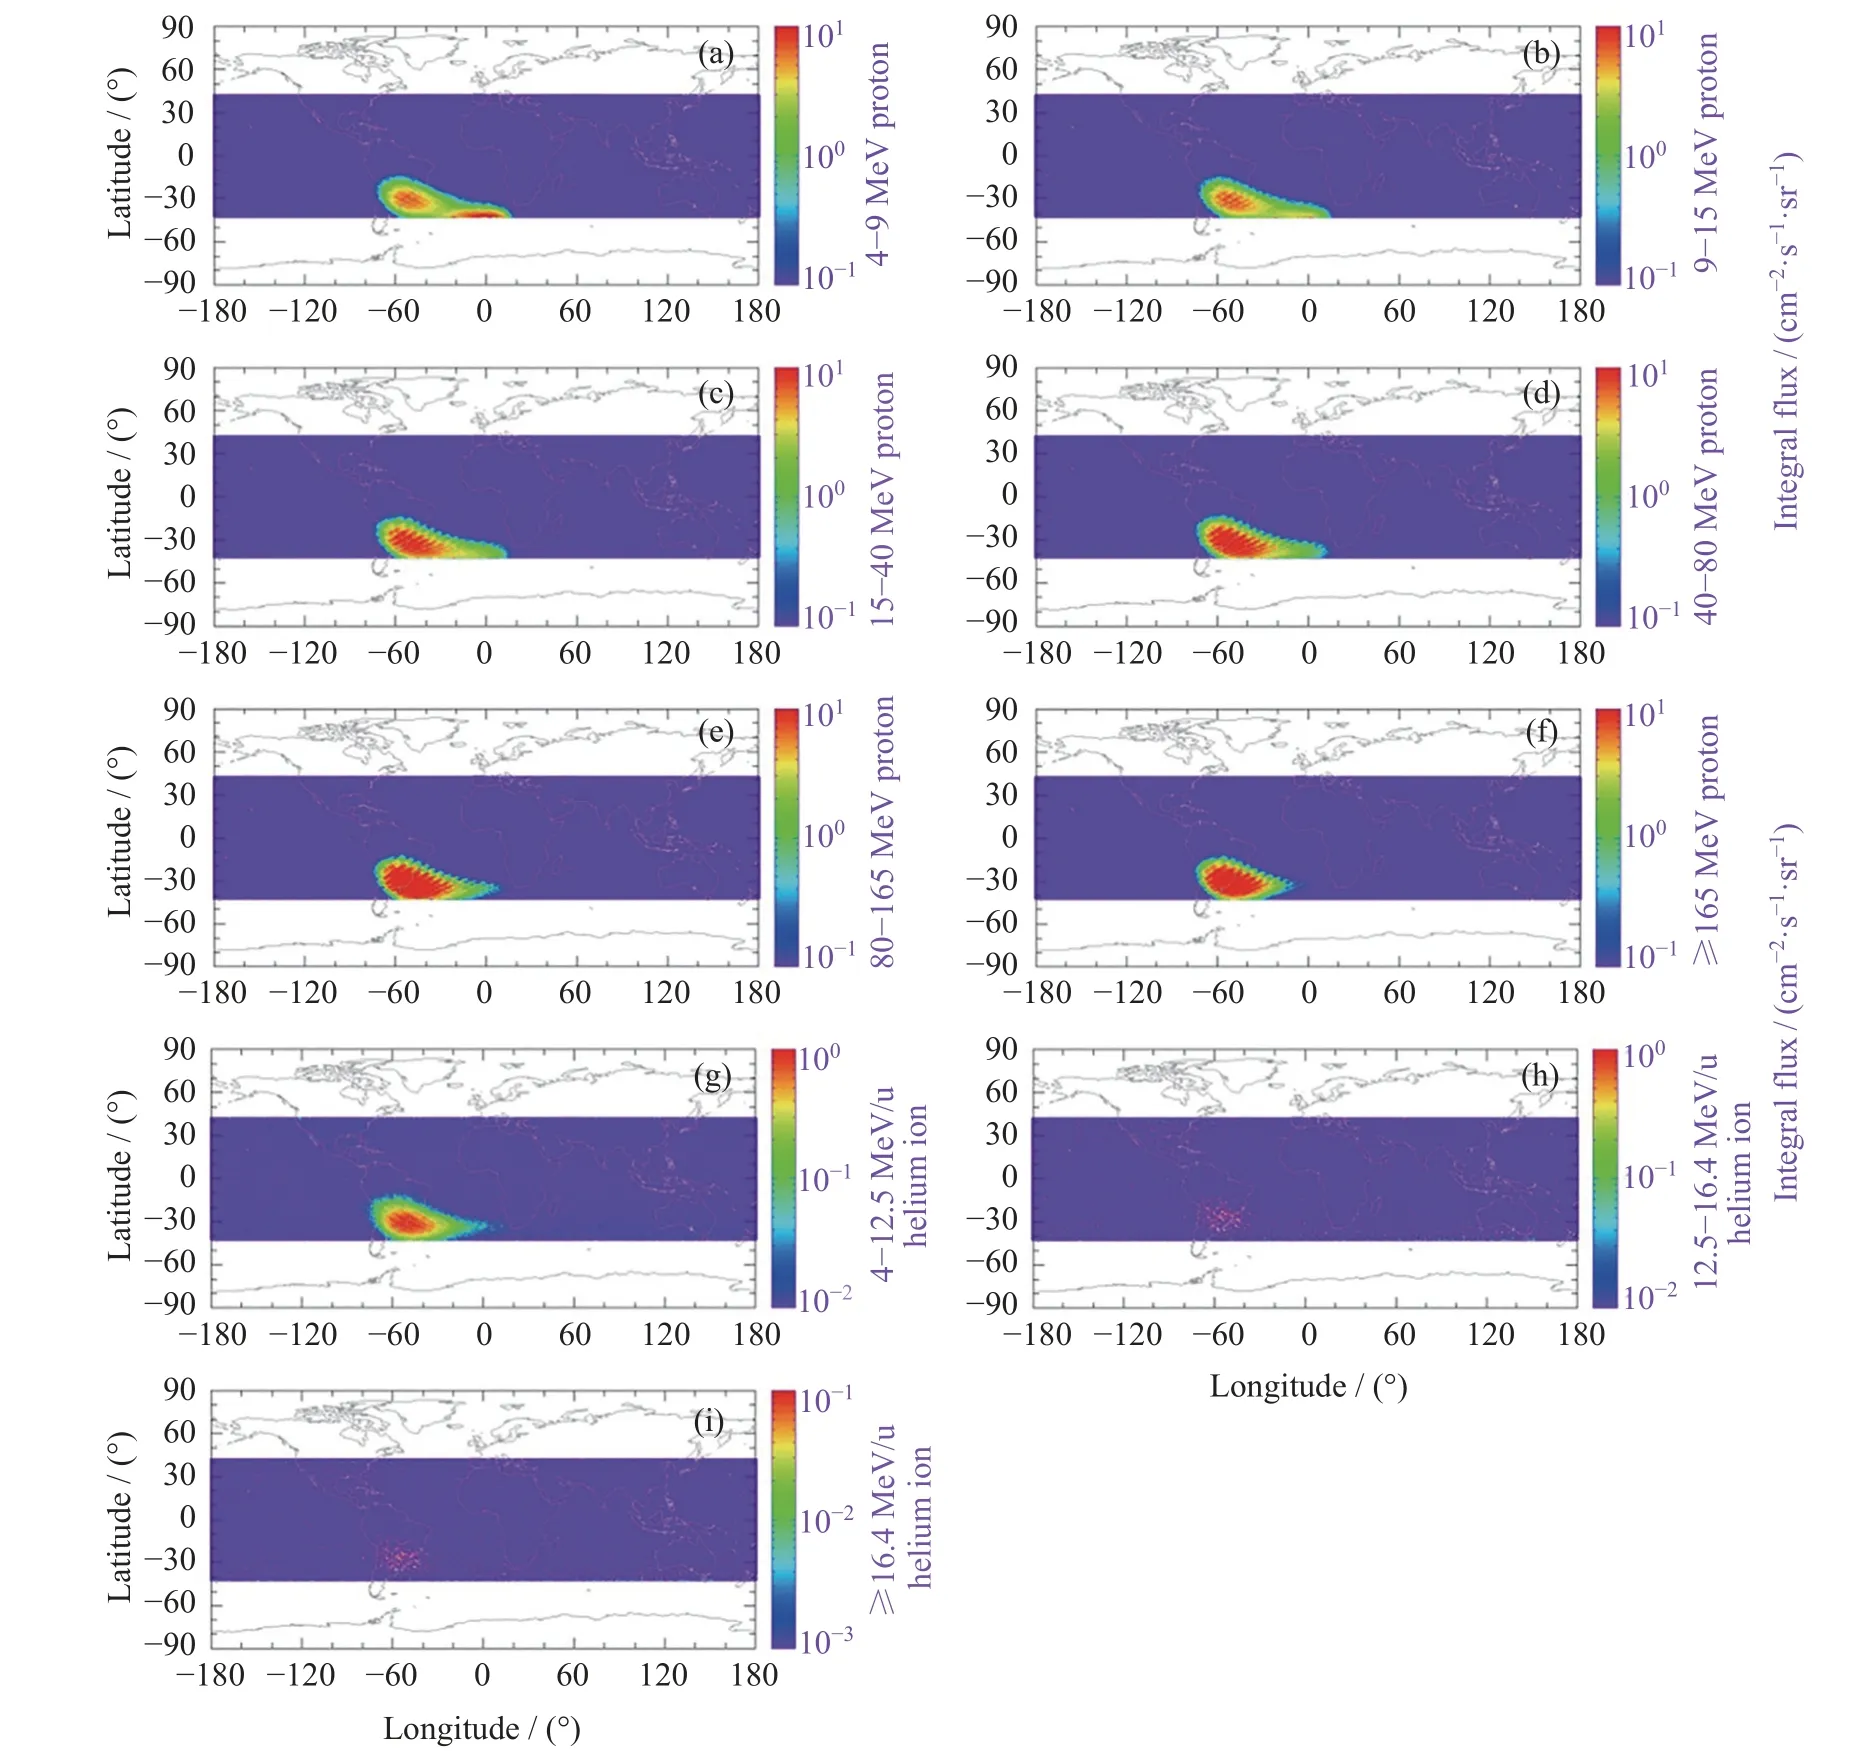
Fig.5 Distribution of ≥4.0 MeV protons with 6 channels and ≥4.0 MeV/u helium ions with 3 channels measured by China Space Station between 1 January 2022 and 8 May 2022
In summary,the data of energetic particles from CSS can be used to alert the SAA crossings of satellites with altitudes about 400 km,and to analyze the influence of radiation belts particles on spacecraft or astronauts.The data can also participate in the radiation belts modeling to improve the prediction in the low altitude region.
4.3 Atmospheric Density Data Analysis and Application
The observed densities were recorded with a high temporal resolution of 2 s,and they were mostly consecutive except on some occasions such as orbital maneuvers,spacecraft dockings and extravehicular activities,when the ADMDs were powered off for instrument protection purpose.In the past year,several geomagnetic storm cases had happened,and this made it applicable to evaluate the performance of these observed density under different geomagnetic conditions.NRLMSISE-00 was selected as the baseline model to make the comparison,and both geomagnetic quiet and storm event cases were considered.
Fig.6gives the comparison of results on 2–3 March 2022,when the geomagnetic condition is mostly quiet(Kp<3) except the last segment of 3 h for unsettled(Kp=3).The thin red and black curves in the top panel represent NRLMSISE-00 and observed densities,respectively.The bold curves represent the mean density values averaged over two orbit circles.GeomagneticKpindex values are shown in the bottom panel.It’s evident that the outline and magnitude of both of the thin and bold curves conform well,implying that the observed values could give a reasonable description of the atmospheric densities under geomagnetic quiet conditions.

Fig.6 Comparison between observed (black line) and NRLMSISE-00 model (red line) densities (top panel) on 2–3 March 2022.The bold lines represent the mean values averaged over two orbit circles.Geomagnetic Kp index values were also given in the bottom panel
Fig.7gives the comparison results on 13–14 March 2022.A consecutive geomagnetic storm periods including moderate storm levels (Kp=6) for 12 h and minor storm levels (Kp=5) for 3 h were recorded.It indicates that the observed and model densities conform well either.However,there are some apparent differences between the observed and model densities.For example,result shows that the observed densities increased about 48% during the intensified geomagnetic activities while the model densities increased about 31%.Meanwhile,when geomagnetic storm happened,the mean observed densities increased with a higher rate than the mean model densities,and it decreased also more quickly after the geomagnetic conditions recovered to quiet levels.
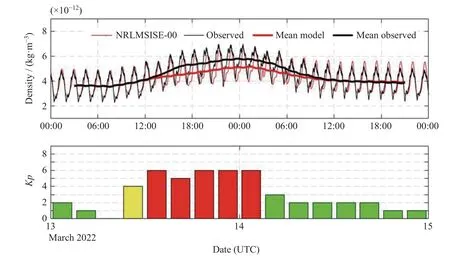
Fig.7 Comparison between observed (black line) and NRLMSISE-00 model (red line)densities (top panel) on 13–14 March 2022
Fig.8gives another example for geomagnetic storm event on 4–6 March 2022.The geomagnetic field was quiet to unsettled on the first day,followed by isolated minor storm and active levels for 12 h,respectively,throughout the last two days.The observed and model densities conform well,the same as results on 2–3 March 2022,but the mean observed densities increased with an apparent higher rate than the mean model densities.To be specific,the density increased about 49% for the observed value,while about 36% for NRLMSISE-00 model.

Fig.8 Comparison between observed (black line) and NRLMSISE-00 model (red line)densities (top panel) on 4–6 March 2022
The result of the two geomagnetic storm cases implied that the observed densities may react more sensitive with the geomagnetic conditions than those from NRLMSISE-00 model.However,it should be note that more storm cases should be added in the following studies to make the result robust.With the intensifying of the 25th solar cycle,more geomagnetic storm events will be expected to occur,the analyzation and evaluation of the performance of the observed densities could become much more comprehensive.
The CSS is supposed to be in orbit for more than 10 years,this indicates that a large amount of observed density data will be available throughout the whole mission,and it will be undoubtedly helpful to the studies on upper atmosphere.For example,thesein-situobserved densities could be used to analyze the accuracy of other data sources and make calibrations on the existing models such as NRLMSISE-00.What’s more,they will contribute to the establishment of a new empirical model.
5 Conclusion and Outlook
The instruments onboard Tianhe provide real-time data of the orbital space environment,including solar flares,energetic particle variation and thermospheric atmospheric density enhancement,which contribute to the CSS space weather service for mission control and astronauts safety.
Comparing the Solar X-ray flux from PFSAD and GOES-16 satellite the peak flux were close.However,in the early and late stages of the flare,the X-ray flux monitored by Tianhe Core Module is slightly lower than that of GOES-16 satellite.Due to the CSS orbit,the solar Xray flux observation was discontinuous.
The data of energetic particles from PFSAD can be used to alert the SAA crossings of low-latitude satellites with altitudes about 400 km,and to analyze the influence of radiation belts particles on spacecraft or astronauts.In the future,the data can also contribute to construct the radiation belts model to improve the prediction in the low altitude region.
From the geomagnetic storm cases,the observed densities of ADMDs may react more sensitive with the geomagnetic conditions than those from NRLMSISE-00 model.In the future,more storm cases should be analyzed to make the result robust.Meanwhile,as the atmospheric density data increase,it could be used to calibrate and improve the accuracy of the existing models,or establish a new empirical model.
The paper gives preliminary analysis of the space environment measurements from the PFSAD and the ADMDs.By further analysis,the 1024-channel fine spectra of the solar X-ray can be used to study the mechanism of solar flares and their impacts on the Earth’s atmosphere.Data accumulation will be helpful for analyzing mid-term and long-term variation of the SAA and atmosphere density.Furthermore the data is useful to make calibrations to the empirical models and establish new models to study the space environment.
杂志排行

空间科学学报的其它文章
- Recent Progress in Space Science and Applications of China’s Space Station in 2020–2022
- Overview of the Latest Scientific Achievements of Chang’E-4 Mission of China’s Lunar Exploration Project*
- Recent Status of Taiji Program in China*
- Construction Progress of Chinese Meridian Project Phase II*
- Introduction to the Chinese Hα Solar Explorer (CHASE) Mission
- Current Status and Main Scientific Outcomes of the CSES Mission*