Ionospheric Investigations Conducted by Chinese Mainland Scientists in 2020–2021*
2022-08-18LIULiboLEIJiuhouLIUJing
LIU Libo LEI Jiuhou LIU Jing
1(Key Laboratory of Earth and Planetary Physics, Institute of Geology and Geophysics,Chinese Academy of Sciences, Beijing 100029)
2(Heilongjiang Mohe National Observatory of Geophysics, Institute of Geology and Geophysics,Chinese Academy of Sciences, Beijing 100029)
3(College of Earth and Planetary Sciences, University of the Chinese Academy of Sciences, Beijing 100049)
4(Chinese Academy of Sciences Key Laboratory of Geospace Environment, School of Earth and Space Sciences,University of Science and Technology of China, Hefei 230022)
5(School of Space Science and Physics, Shandong Key Laboratory of Optical Astronomy and Solar-Terrestrial Environment, Institute of Space Sciences, Shandong University, Weihai 264209)
Abstract In this report,we outline works done by scientists from the Mainland of China on various ionospheric topics after the release of the National Report of China in 2020 on ionospheric research[1] to the Committee on Space Research (COSPAR).More than 170 papers were published in 2020–2021.The current report covers the following topics:ionospheric space weather,ionospheric structures and climatology,ionospheric dynamics and couplings,ionospheric irregularity and scintillation,modeling and data assimilation,and ionosphere and sounding techniques.Planetary ionospheres are included for the first time.
Key words Ionospheric,Space weather,Planetary ionospheres
1 Ionospheric Space Weather
1.1 Transient Solar Irradiation Events
A solar eclipse transiently shields the solar ionizing radiation falling into the atmosphere of the Earth,providing a natural experiment to study the ionospheric disturbances due to the rapid solar input reduction.Zhanget al.[2]investigated the ionospheric responses to the 21 June 2020 solar eclipse using multi-instrument observations.During the eclipse,total Electron Content (TEC)decreased slightly in the morning at 20°E–70°E and largely in the afternoon at 80°E–150°E.However,TEC depletion did not peak at the maximum obscuration but was close to the southern or northern edges of the running totality.Swarm observations recorded a drop in the electron temperature both in the eclipse region and in the conjugate hemisphere.The combined effect from the electric field,neutral wind,thermal conduction,and interhemispheric photoelectron transport might result in the complicated space and time variations of ionospheric responses to the eclipse (seeFig.1[2]).

Fig.1 Related physical processes during the eclipse,including the photochemistry,interhemispheric photoelectron transport,thermal conduction,neutral wind,and electrodynamics
Both simulations of Leet al.[3]and Danget al.[4]studied the responses in the eclipse region and its conjugated region on 21 June 2020,when a solar eclipse passes East Asia.Leet al.[3]reported that the TEC responses are not limited to the eclipse region,they also occur in the non-eclipse hemisphere.The variations in the conjugate region were considered to be mainly affected by heat conduction along the geomagnetic field lines,with the modulation of the trans-hemisphere photoelectron heating and global thermospheric wind change.Danget al.[4]found a prominent TEC enhancement occurring in the Equatorial Ionization Anomaly (EIA) region,even still in the eclipse shadow.Further control simulations by Danget al.[4]indicate the abnormal TEC increase results from eclipse-induced wind perturbations.The ionosphere-thermosphere system is nonlinear and transient in an eclipse,it is dynamically and energetically coupled.
Huanget al.[5]further investigated the low-latitude ionospheric responses to the annular solar eclipse.They found that the TEC evidently decreases with the obscuration and in the EIA region in the conjugate hemisphere.The low latitude TEC changes during the eclipse are attributed to the obscuration rate and transport processes.
Solar eclipses can induce large-scale ionospheric and thermospheric disturbances.Sunet al.[6]reported a large-scale perturbation of TEC with a wavelength of about 2700 km and a period of about 3.5 h propagating northwestward over East China after sunset.It is beyond expectation that the perturbation persists to midnight.As the 21 August 2017 solar eclipse supersonically approaches the American west coast,Sunet al.[7]found that the pre-existing traveling ionospheric disturbance (period about 40 min) gets shorter (period about 10 min),steepening,and breaking eventually.The wave becomes steep and propagates east-southward over Oregon and California.Yanet al.[8]investigated the characteristics of atmospheric perturbations triggered by solar eclipses.They found that the perturbations in neutral winds and temperature are superimposed on previously excited waves.As the eclipse progresses,the perturbations evolve from high-speed “bow waves” into freely propagating traveling atmospheric disturbances.
Solar flare is another typical type of transient solar irradiation event.Reduced daytime upwardE×Bdrifts and weakened fountain effects in the equatorial ionosphere have been frequently observed during the initial stage of solar flares.Liuet al.[9]explored the origin of this response by simulations of the coupled whole geospace model.They showed that both Prompt Penetration Electric Fields (PPEFs) and internal changes in the wind dynamo are responsible for the reduced upward ion drifts.PPEFs are caused by reduction in the high-latitude potential as a result of flare-enhanced ionospheric conductance.The reduction of the dynamo-driven electric field was suggested to be a response to the flare enhancement of low-latitude Cowling conductance.Furthermore,Chenet al.[10]conducted controlled numerical simulations and found that the wind-dynamo electric field reduction is primarily associated with the decrease of the ratio of the field line-integrated wind-driven currents to the conductance.Besides reducing daytime eastward electric fields,solar flares also increase global daytime currents,inducing westward equatorial electric fields and equatorial counter electrojets in the early morning.
The solar wind has major impacts on the whole geospace,but it is unclear whether the same holds for the transient solar irradiation events,such as solar flares and eclipses.The responses of the ionosphere,thermosphere,and even magnetosphere were investigated.
Liuet al.[11]used a recently developed whole geospace model combined with observations during an X9.3 solar flare event to reveal solar flare effects on magnetospheric dynamics and on the coupling between the magnetosphere and ionosphere (seeFig.2[9]).A rapid and large increase in flare-induced photoionization of the polar ionospheric E-region reduces the efficiency of mechanical energy conversion in the dayside solar wind–magnetosphere interaction,resulting in less Joule heating of the upper atmosphere,a reconfiguration of magnetosphere convection,and changes in auroral precipitation.They revealed that solar flare effects extend throughout the geospaceviaelectrodynamic coupling.

Fig.2 Comparison of 50 min averages from the coupled geospase model simulations of magnetospheric and ionospheric states with and without the solar flare effects.Projections in GSM coordinates of the simulated magnetospheric convection velocity in the equatorial plane with (a) and without (b) the solar flare effects and their difference (c).High-latitude electric potential in the ionosphere with (d) and without (e) solar flare effects and their difference (f)
For the eclipse in the polar region,Chenet al.[12]showed that the solar eclipse across the arctic introduced significant disturbances in the high-latitudes currents,convections,and auroral activity.Surprisingly,the north polar eclipse impacts the whole geospace system,causing significant auroral disturbances in the unobscured Southern Hemisphere through the electrodynamic coupling of the magnetosphere-ionosphere system.
1.2 Geomagnetic Storms or Substorms
Geomagnetic storm effect on the ionosphere is always an active research topic in the space physics.Renet al.[13]used multiple observations to study the possible contributions from the High-Speed Solar wind (HSS) to the ionosphere during the recovery phase of the August 2018 geomagnetic storm.They found that the HSS could result in about 2-TECU enhancement of TEC at the auroral oval and low latitude.Therefore,the HSS was a possible driver of the ionospheric positive storm during the recovery phase,but the causes for the more than 10 TECU enhancement at low and middle latitudes during the recovery phase are still unknown.
In contrast to the common phenomenon of dayside plasma depletions during the storm recovery phase,Liet al.[14]reported that the daytime TECs displayed large enhancements at multiple longitude sectors (seeFig.3[14])during the recovery phase.They revealed that the enhanced upward vertical plasma drifts make an important contribution to the TEC responses,while the drifts could not be driven by the common storm-induced source(PPEF or ionospheric disturbance dynamo).

Fig.3 Differential TEC (DTEC) provided by the Beidou GEO satellite and MIT Haystack Observatory at longitudes of 110°E (a),70°W (c) and 40°E (e).The Equatorial Electrojet (EEJ) strength was calculated from differential geomagnetic horizontal component (ΔH) near 110°E and 70°W
The F3layer occurs frequently in the daytime equatorial and low latitude ionosphere in summer.Jinet al.[15]found the inhibition of F3layer event and narrowing differences of virtual heights between the F3and F2layers in the recovery phase of 14 geomagnetic storms in 2012–2015.The inhibition of the F3layer can be an indicator to show how the magnetosphere-ionospheric coupling affects the low and equatorial ionosphere.
Wanet al.[16]used Swarm and DMSP satellites to reveal a strip-like plasma density bulge at lower-middle latitudes during the 8–9 September 2017 geomagnetic storm.The strip-like bulge spanned over 150° in longitude but only 1°–5° in latitude.The structure can be identified at all local time sectors and last for more than 48 h.The dominant ion composition is H+/He+,rather than O+.It is suggested that the combined effects from the plasmaspheric downwelling and disturbance neutral wind were responsible for the formation of strip-like bulges.Jianget al.[17]and Weiet al.[18]investigated ionospheric irregularities associated with Spread F and spread Es at low and middle latitudes by ionosonde,GNSS Receiver Network,and Swarm during the September 2017 storm event.
Zhaiet al.[19]investigated high-m Ultralow Frequency (ULF) waves during the recovery phase of a geomagnetic storm by using GPS TEC measurements.ULF wave signals in TEC data show high coherence and significant common power in the wavelet coherence and cross wavelet transform analyses with magnetic field radial component data from GOES-15.An automatic identification procedure is developed to identify ULF wave signatures in TEC data.The waves were mainly distributed on the dayside and post dusk sector from 64° to 71° magnetic latitudes.
Wanget al.[20]explored the spatial and temporal distributions of ionospheric Electromagnetic Ion Cyclotron (EMIC) waves during magnetic storms from 2014 to 2018.There are obvious Magnetic Local Time(MLT) differences in the peak occurrence frequency of EMIC waves during storm phases.The enhanced solar wind dynamic pressure was favorable for dusk side EMIC waves.With an increased substorm activity,the wave occurrence rate peak shifted from the morning side to the dusk-pre midnight sector.The storm time EMIC waves occur highest in the South Atlantic Anomaly region,which might be related to the drift shell splitting and the wave propagation effect in the weak magnetic field region.
2 Ionospheric Structures and Climatology
2.1 Spatial Structure
The ionospheric climatology was studied in EIA and mid-latitude trough regions[21–25].With ground-based TEC data in eastern Asian and American sectors from 2000 to 2011,Liuet al.[23]statistically studied the morphological difference of the EIA in these two sectors.The latitudinal location (Lc) of EIA in the American sector shows an annual variation that is more poleward in summer and more equatorward in winter,whileLcin the eastern Asian sector shows a semiannual variation that is more poleward around equinoxes and more equatorward around solstices.Additionally,in order to reveal the effect of the zonal electric field on the EIA morphological variation,the time delay between the EIA and the EEJ in these sectors is studied using TEC and magnetometer data during 2008–2018[22].The prevailing seasonal pattern of the occurrence time of the delay most developed northern EIA crest is generally consistent in the two sectors.The solar cycle and longitudinal dependencies are probably due to the combined effects of the electric field,meridional wind,and geomagnetic field configuration.Maet al.[26]investigated the longitudinal difference of electron temperature (Te) at mid-latitudes in the topside ionosphere.The estimation of contributions to the longitudinal difference ofTeindicated that the magnetic declination modulation effect of neutral winds at mid-latitudes changed electron density (Ne),which indirectly changes the longitudinal difference inTe.
Except for F2layer,the EIA and latitudinal structures in the topside ionosphere are also studied.Liet al.[27]used the DMSP F12-F15 measurements to examine EIA occurrence rate at about 840 km altitude in the dusk sector during solar maximum years 2000–2002.The results indicated that EIA can still be observed at DMSP heights.The EIA occurrence rate can reach 30%at specific longitudes in equinox.The PRE of eastward electric field plays a significant role in the EIA formation at 840 km just after sunset,but the occurrence does not exactly represent the characteristics of the PRE of eastward electric field.Tianet al.[28]investigated the latitudinal profile of the ionospheric plasma density,using the Planar Langmuir Probe observations of CHAMP.The occurrence of deep equatorial trough is attributed tohmF2uplifted by the neutral winds at later local time.The neutral winds around the magnetic equator are particularly important,especially when the electric field forcing is weak or absent.
By utilizing CHAMP magnetic field measurements during the years 2001–2009,Zhouet al.[29]found the night-time zonal ionospheric currents at F-region altitude exhibit an averaged height-integrated current density up to 10 mA·m–1.The amplitude varies quasi-linearly withF10.7.During equinoxes,symmetric current systems at F-region altitude are found in the two hemispheres.After sunset,eastward currents dominate at low latitudes,fading away towards midnight.After midnight regions of eastward currents are observed at mid-latitude.
The ionosphere in the polar region also owns complex structures.Xionget al.[30,31]derived Field-Aligned Currents (FACs) from magnetometers onboard the DMSP satellites and GRACE Follow-On (GRACE-FO).They found that the largest displacement is found between the downward R1 current and ion flux peak at the dawn side.The auroral FACs can be classified into two groups:the small-scale ones,shorter than some tens of kilometers,dominated by kinetic Alfven waves,are quite dynamic;and the large-scale ones,typically larger than 150 km,can be considered as quasi-static and persist longer than 1 min.
2.2 Temporal Variation (Enhancement/Bite-out)
Ionospheric electron density bite-out at noontime often occurs in the equatorial F2layer.Chenet al.[32]used ionosonde measurements to investigate the climatology of noontime bite-out.Noontime bite-out ofNmF2(peak electron density of the F2-layer) appears in all months at the dip equator.There is evident north-south asymmetry of the bite-out.However,it does not occur in the northern summer (winter) months at the equatorial north(south),whereNmF2enhances continuously in the early morning till late afternoon.Chenet al.[33]further investigated the climatology of mid-latitude F2-layer bite-out,which was less investigated,using ionosonde measurements from EIA crest to mid-latitudes in the East Asia sector.The bite-out is more remarkable at solar minimum (maximum) than at solar maximum (minimum) at EIA latitudes (mid-latitudes).
Liuet al.[34]presented a case study of the electron density enhancements in the low latitude F region.Common features in the cases demonstrate thatNmF2increases at low latitudes are characterized by a descent of the peak height (hmF2).As the Qujing radar observed,the electron density shows an increase in the bottom ionosphere and a depression at topside altitudes.It provides evidence that the enhancements inNmF2are associated with a downwellinghmF2.Liuet al.[35]conducted a case study of the anomalous daytime enhancements in ionospheric electron density.The enhancements are found in the region around the northern EIA crest.During the anomalous enhancement,the increase in electron density over Qujing is stronger at higher altitudes.Strong longitudinal gradients are present in TEC in the regions during the course of the enhancements.
Kuaiet al.[36]investigated the geomagnetic quiet time variations of the ionosphere at middle and low latitudes.TEC has multiple prominent enhancements in the Asian-Australian and American sectors.TEC depletions also occur repeatedly in the Asian-Australian sector.A mid-latitude band structure appears continuously at all local times in the North American sector.The low-latitude electric fields vary significantly,attributed to the modulation of the notably changing tides.
Chenet al.[37]explored the physical mechanisms responsible for the sunrise enhancement of equatorial upward vertical drifts using model simulations.Numerical experiments reveal that the equatorial sunrise enhancement at solar minimum is primarily driven by the E region zonal wind dynamo at middle latitudes rather than by the local dynamo effect in the equatorial region (seeFig.4[37]).Chenet al.[38]further explored the physical processes by which the longitude-dependent geomagnetic field drives the longitudinal variations of the sunrise enhancement of the zonal electric fields at the dip equator near the June solstice.Simulations show the longitudinal differences of the sunrise equatorial zonal electric fields are mainly related to the longitudinal variations ofU×Band conductance,which are caused primarily by the direct influence of the longitudinal structures of magnetic field declination and strength.

Fig.4 A schematic diagram of the physical mechanism of eastward enhancement of magnetically zonal electric fields caused by the zonal wind dynamo at middle latitudes near sunrise
Wanget al.[39]investigated the ionospheric Diurnal Double-Maxima (DDM) patterns over the Asian-Australian sector during 2016–2018 by the TEC observations from the Beidou GEO satellites.The occurrence rate of DDM was higher around June solstice in both the northern and southern hemispheres and had an anti-correlation with the background TEC.
Yearly and monthly averaging are basic preprocessing methods of ionospheric data to smooth out the cyclic variations.Adopting the two methods,Huanget al.[5]constructed a linear regression model of the ionospheric dependence on the solar EUV flux,to examine the hysteresis phenomenon (differentNmF2EUV relation in the solar rising and declining phase) and long-term trends in the ionosphere.The fundamental cause is the ionospheric sensitivity to the solar EUV irradiance varying with the season.The monthly average method is then suggested to be a better choice for accurate estimation of the hysteresis and long-term trends in the ionosphere.
3 Ionospheric Dynamics and Couplings
3.1 Sudden Stratosphere Warming and Lower Atmospheric Forcing
Based on the observed ionospheric parameters,the ionospheric response to SSW or planetary and the ionospheric morphology were studied.These studies mainly focused on:(i) the coupling processes or mechanism from the troposphere to the ionosphere and from high latitude to low latitude or even interhemispheric coupling;(ii)the importance of the planetary wave,solar and lunar tides,and mean wind on the above coupling processes or mechanism;(iii) the morphology of the ionospheric variations,which parameters to control these changes.
Zhanget al.[40]used the Communication/Navigation Outage Forecasting System satellite measurements,for the first time,to present the responses of the fieldaligned drift during the 2009 Sudden Stratosphere Warming (SSW).The observations (seeFig.5[40]) show that the field-aligned drift presents a southward disturbance in the morning sector and a large northward disturbance in the afternoon sector and gradually shifts to later local time during the SSW.Further,this new finding of semidiurnal disturbance in field-aligned drift can well explain the hemispheric differences in the responses of the TEC to the SSW.
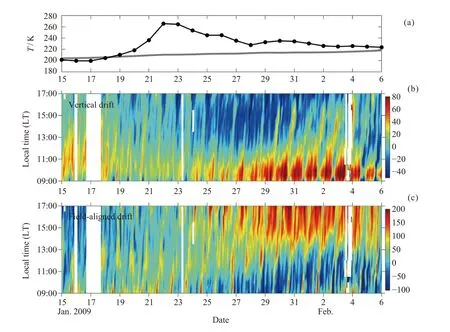
Fig.5 Stratospheric temperature at 90°N and 10 hPa and the C/NOFS observations of the vertical and field-aligned drifts from 15 January to 6 February 2009.Gray line indicates its 40-year mean
Huanget al.[41]reported remarkable enhancements in the TEC from the Beidou GEO satellites during the quiescent geophysical condition of January 2017 prior to the arrival of the SSW.The daytime TEC increased by 75%–160% around the EIA region and lasted for several days.The meteorological forcing is suggested as the source of the great ionospheric changes before the SSW arrival.
Recent studies showed that there are strong signatures of planetary waves or semidiurnal lunar tides during the SSW.Liuet al.[42],reported simultaneous variations with (about 14.5 days) periods detected in the parameters from the E region to the topside ionosphere.Liuet al.[43]focused on fundamental vertical coupling processes associated with the latitudinal extent and hemispheric asymmetry of the semilunar tide (M2) signatures using TECs from the American sector.Mo and Zhang[44,45]studied the perturbations in the EIA region during the SSWs,using the location of EIA crests derived from GNSS observations and the Equatorial Electrojet (EEJ) estimated by the geomagnetic field.They examined the variations of quasi-6-day and 10-day oscillations in the ionosphere.Tanget al.[46]found thatf0Esduring two SSW events exhibit noticeably enhanced 14.5-day modulations,which resembles the lunar semimonthly period.The observational evidence reveals that the semimonthly lunar period of 14.5-day can be a contributing factor to the disturbance of Es layers during SSW events.
Liet al.[47,48]investigated the responses of the ionosphere and the neutral winds in the mesospheric and lower thermospheric region to two SSWs,respectively.The amplitudes of solar and lunar semidiurnal tides in winds are greatly enhanced during the SSW.Tanget al.[49]reported a later lunar tide modulation in the summer hemisphere than that in the winter hemisphere,which can be explained by the planetary wave penetrating across the winter to summer hemisphere during SSW.
Yuet al.[50]and Yeet al.[51]investigated the F layer scintillation related to ionospheric irregularities during SSW events by using the Constellation Observing System for Meteorology,Ionosphere,and Climate Radio Occultation (COSMIC) data.They reported that the occurrence frequency and altitude of ionospheric F-layer scintillation were obviously suppressed over the American sector during SSW periods.Yeet al.[51]found that an SSW event under low solar activity can affect the generation of ionospheric irregularities.
In addition,other lower atmospheric activities can also introduce ionospheric disturbances.Liuet al.[52]explored the responses of ionosphere on quasi-6-day wave events from the lower atmosphere at low and middle latitudes during 2014–2015.Zhouet al.[53]investigated the responses of atmospheric carbon dioxide (CO2) density to geomagnetic secular variation using the WACCM-X.Their simulation results demonstrate that the impact of geomagnetic variation on atmospheric CO2distribution is noticeable on a time scale of decades.Based on the TEC data,Liuet al.[54]found some latitudinal and longitudinal characteristics of ionospheric terdiurnal tide,and suggested these variations are likely related to the nonlinear interaction between diurnal and semidiurnal tides.
3.2 Dynamics
The equatorial electrojet or zonal electric field occasionally becomes westward in the afternoon sector during quiet times.Zhanget al.[55]present the first analysis of the dependence of the afternoon downward plasma drifts on the season,longitude,solar activity,and lunar phase using the ROCSAT-1 observations during 1999–2004.There are about 20% of downward plasma drifts at 13:00–17:00 LT.The downward plasma drift occurs most frequently around the full moon in the afternoon sector.The geomagnetic declination induces the hemispheric differences in the dynamo current in the conjugate regions and controls the occurrence of the westward electric fields.
Wanget al.[56]investigated the diurnal and longitudinal patterns of EEJ using data from CHAMP satellite and simulations from TIEGCM.The tides were important in causing the later local time occurrence of the EEJ peak in the Peruvian sector,and they favored the occurrence of the morning Counter Electrojet (CEJ) in the frame of the IGRF.The difference in the EEJ peak intensity between the Peruvian and Indian stations was enhanced due to the tidal effect.
Liuet al.[57]performed a statistical study on the Ionospheric Nighttime Enhancement (INE) at the midlatitude using observation data from ionosondes,FPI,and the Jet Propulsion Laboratory TEC.Fig.6displays the distribution of INE events with differenthmF2variation pattern[57].It can be seen thathmF2could both rise and decline during winter INE.This feature is different from the summer INE whichhmF2mostly presents increased.Changes inhmF2had no significant effect on the amplitude and duration of winter INE.The downward transport of plasma causes electron density to accumulate near the peak height of F2layer,resulting in the thinning of ionospheric plate and the formation of INE.This downward transport could imply the importance of ionosphere-plasmasphere coupling to ionospheric nighttime behavior.

Fig.6 hmF2 as functions of Day of Year (DOY) and Local Time (LT) at Mohe and Beijing.The black solid (dashed) lines plot the sunset (sunrise) terminator at 400 km.The vertical red lines indicate the equinox and solstice days
Chenet al.[58]explored a strong anticorrelation between temporal variations of field-aligned upward plasma velocity (Vi‖) and field-perpendicular poleward plasma drift (Vi⊥N) in midlatitude F2region using numerical simulations.The anticorrelation between the diurnal variations ofVi‖andVi⊥Nis associated with the neutral wind dynamo.The anticorrelation between short-term temporal disturbances ofVi‖andVi⊥Nis mainly caused by ion drag,in response to high-latitude convection electric field force.Furthermore,ambipolar diffusion plays a significant role in modulating the relationship betweenVi||andVi⊥N.
Jianget al.[59]investigated midlatitude peaks in TEC using the model simulations to explore its possible mechanisms driving.They found that the latitudinal variations of the downwards-moving plasma ambipolar diffusive flux can play a significant role in forming nighttime midlatitude ionospheric peaks and their latitudinal structures.Caiet al.[60]reported the characteristics of the topside ionospheric O+diffusive flux using incoherent scatter radar observations at Millstone Hill for solar minimum from 1970 to 2018.The diffusive flux partially characterizes plasma mass exchange between the upper and lower part of the topside ionosphere through diffusion and sometimes serves as upper boundary conditions for ionosphere-thermosphere models.
To investigate day-to-day variability of equatorial vertical drift under quiet-time conditions,Zhouet al.[61]analyzed ROCSAT-1 observations and performed simulations using the WACCM-X model.The day-to-day variability of equatorial vertical drift had a strong dependence on local time,largest around dawn and dusk.Modeling results revealed that the day-to-day variability of dawn drift is larger during solar minimum than maximum condition.Short-term variability of E-region winds is found to be the primary driver to produce the day-today variability of dawn drift,and F-region winds play a secondary role.Ionospheric conductivities could modulate the drift variability response to E-region wind variability and thus affect the strength of day-to-day variability of dawn drift and determine its seasonal and longitudinal variations.
Zhouet al.[62]examined the day-to-day variability ofNmF2from both observational and modeling perspectives.The coupled whole atmospheric model reproduces the observed local-time dependence of the day-to-day variability ofNmF2in 2012,which was large by night and small by day,and favorably agrees with the daytime day-to-day variability in 2009.However,the stand-alone model without considering the lower atmospheric variability does not reproduce the observed features,especially under solar minimum conditions and during the nighttime,possibly due to the absence of day-to-day changes in the lower atmosphere in the simulations.The effects of lower atmospheric perturbations on the ionospheric day-to-day variability were proposed to be more important in solar minimum.
Wang and Lühr[63]investigated the effects of solar illumination and the substorm process on the auroral electrojets using 10 years of CHAMP high-resolution magnetic field data.The eastward electrojet was found to be proportional to the ionospheric conductance over the whole day.More notably,a stronger westward current was detected in times of lower flux tube-integrated conductance in both hemispheres.The results provide observational evidence of the increased efficiency of the Cowling channel in the nighttime during substorm periods and contribute to our understanding of the formation mechanism of the auroral electrojet.
By using 4 years of CHAMP zonal wind observations and model simulations,Wanget al.[64]investigated the longitudinal and seasonal variations of thermospheric superrotation at geomagnetic equator.The superrotation shows longitudinal structures.The superrotation is stronger in December than in June solstice,and stronger in March than in September equinox.
3.3 Lithosphere-ionosphere Coupling
The earthquakes could induce ionospheric electron density disturbance.Subsequently the electromagnetic field observed on the ground and Low Earth Orbit satellite could change due to the ionospheric disturbance.Zhaoet al.[65]constructed a full-wave model to simulate the influence of the ionospheric disturbance on the electromagnetic field.The result shows the electromagnetic field at the satellite altitude changes obviously when the wave encounters an ionospheric disturbance.The electromagnetic field increases with the amplitude and scale of the ionospheric disturbance.However,the influence of the ionospheric F layer disturbance just has a local effect on the electromagnetic field.
Chenet al.[66]reported a novel system for monitoring vibrations and perturbations (MVP) in the LAI(MVP-LAI)*http://geostation.top/.The MVP-LAI system was established in the countryside of Leshan City,Sichuan Province,China,at the end of 2021.Fourteen different types of instruments were set within an area of 50 m × 50 m.The VHF coherent scattering radar and Meteor radar were installed about 20 km away from the system to avoid interference. These instruments routinely monitor the changes in the geophysical parameters with short sampling intervals,available for capturing waves propagating from the subsurface to the ionosphere (seeFig.7[66]).

Fig.7 Filtered data associated with the arrival of seismic waves from 20:00 LT to 23:30 LT on 10 February 2021
Using the TEC data,Haoet al.[67],investigated the seismo-ionospheric disturbances after the 2011 Tohoku earthquake.The two-dimensional structure of large-scale TEC variations caused by far-field Rayleigh waves was revealed.The zonal band structures have wave fronts oriented in the northwest-southeast direction at mid-latitude,and then rotate to east-west at lower latitudes.The rotation is expected due to the neutral-ion coupling,which effectively drives plasma motion along geomagnetic field lines in favor of southward propagation of the ionospheric disturbances.
Tariqet al.[68]analyzed Pre-Earthquake Ionospheric Anomalies (PEIAs) with TEC data within seismogenic zones of three earthquakes from GPS stations in Pakistani regions.Zhaoet al.[69]studied how these ionospheric disturbances at different altitudes affect the VLF signals observed by ground and LEO satellites through joint observation from ground receivers and satellite.
The combination of the observations with the machine learning technique is widely applied to explore the earthquake effect on the ionosphere.Jointly with the Swarm satellite earthquake research team of INGV,Italy,the study proposes a deep learning model called SafeNet for identifying pre-earthquake electromagnetic anomaly signals based on the ESA Swarm satellite three-component magnetic field,Ne and other observations from April 2014 to April 2020[70,71].Xionget al.[72]proposed a deep learning framework called SeqNet-Quake,which combines one-dimensional convolutional layer and BiLSTM (bi-directional long and short-term memory layer) models to obtain classification results through fully connected layers and Softmax classifier,which improves the accuracy and reduces the false alarm rate of the system.
The linkage between the earthquake and VLF/ULF wave activity was also explored.For instance,Zhaoet al.[73]showed that SNR (Signal to Noise ratio) over the epicenter of the Yushu earthquake especially in the southwestern region decreased before the main shock,and a TEC anomaly accompanied,which implies that the decrease in SNR might be caused by the enhancement of TEC.Ouyanget al.[74]examined the relationship between earthquakes and ULF wave activity in the nighttime ionosphere based on the electric field data in the DC/ULF range observed by the DEMETER satellite over an about 5.5-year period from May 2005 to November 2010.Moreover,on the basis of CSES,the ionospheric perturbations in VLF transmitters were investigated around the 2018 Ms 6.9 Indonesia earthquake,combined with the multi parameters of the plasma and electromagnetic field[75].
There are plenty of the Quasiperiodic waves (QP)in the ELF/VLF range.Zhimaet al.[76]found the QP waves accompanied by simultaneous energetic electron precipitations in the high-latitude ionosphere from the observations of the Sun-synchronous circular orbit satellite CSES.The new features of QP waves observed by CSES are the well-pronounced rising-tone structures and very short repetition periods which are not often reported by previous studies.
3.4 Solar Wind-magnetosphere-polar Ionosphere Coupling
In low atmosphere,hurricanes are destructive due to their great size,strong spiral winds with shears,and intense rain/precipitation (seeFig.8[77]).However,disturbances resembling hurricanes have not been detected in the upper atmosphere.Zhanget al.[77]reported a longlasting space hurricane in the polar ionosphere and magnetosphere during low solar and otherwise low geomagnetic activity.This hurricane shows strong circular horizontal plasma flow with shears,a nearly zero-flow center,and a coincident cyclone-shaped aurora caused by strong electron precipitation associated with intense upward magnetic field-aligned currents.The hurricane imparted large energy and momentum deposition into the ionosphere despite otherwise extremely quiet conditions.

Fig.8 (a) Schematic of a space hurricane in the northern polar ionosphere.The magenta cyclone-shaped auroral spot with brown thick arrows of circular ionospheric flows represents the space hurricane.(b) The 3D magnetosphere when a space hurricane happened
A distinct class of aurora,called Transpolar Auroral Arc (TPA) appears in the extremely high-latitude ionosphere of the Earth when IMF is northward.Zhanget al.[78]report a mechanism identified from multiple-instrument observations of unusually bright,multiple TPAs and simulations from a high-resolution 3D global MHD model.The observations and simulations show an excellent agreement and reveal that these multiple TPAs were generated by precipitating energetic magnetospheric electrons within FAC sheets.These FAC sheets are generated by multiple-flow shear sheets in both the magnetospheric boundary produced by Kelvin-Helmholtz instability between supersonic solar wind flow and magnetosphere plasma,and the plasma sheet generated by the interactions between the enhanced earthward plasma flows from the distant tail (less than–100Re) and the enhanced tailward flows from the near tail (about–20Re).
Liuet al.[79]analyzed the evolution characteristics of the two auroras by using the observation data of the high-resolution All-Sky Imagers at the Yellow River Station,together with solar wind and IMF observations.PMAFs mainly occurred in the poleward of dayside auroral oval equatorial boundary,were distributed along the east-west direction,and extended to the high latitude after brightening.Throat auroras were distributed along the north-south direction,which extended to low latitude from equatorward of the discrete auroral oval and moved to the west after brightening,usually existed near the PMAFs.The formation processes of the two auroral events are relatively independent,and there may be no mutual triggering relationship.
Yanget al.[80]explored the responses of cross-polar cap potential (φpc) to the Solar Wind (SW) density under northward IMF by using the three-dimensional magnetohydrodynamic model.Simulation results show thatφpchas a complicated response to the SW density depending on the magnitude of IMF.For weak IMF,φpcincreases linearly due to the enhancement of the viscously-induced electric field in the equatorial magnetosphere.Theφpcmay be insensitive to SW density increasing at moderate or intense IMFBzunder large-density conditions.The different behavior of SW density in regulatingφpcis mainly due to the competing effects that originated from viscous interaction and magnetic reconnection.
The energy deposition or the momentum changes associated with geomagnetic activity can further alter the status of the upper atmosphere and the ionosphere.Maet al.[81]showed all-sky imager and Poker Flat Advanced Modular Incoherent Scatter Radar observations of two surge events to investigate the relationship between the surge and ionospheric flows that likely have polar cap origin.By using DMSP satellite observations from 2010–2013,Maet al.[82]performed a statistical study of ion upflow and FACs in the topside ionosphere of both hemispheres for magnetic quiet and disturbed times.Ion upflow occurrence shows a dawn-dusk asymmetry distribution that matches well with the Region 1 FACs.
Based on the observations from SuperDARN radar and DMSP satellites,Wanget al.[83]found that shortterm sunward ionospheric flow bursts in the poleward of the cusp showed one-to-one correspondence with the sudden increase of the IMFBz,and a cusp auroral spot,together with an inverse ion energy dispersion,was observed in association with one of the flow bursts.They suggest that the lobe reconnections can be triggered by a sudden increase of the IMFBzcomponent.
Yuanet al.[84]investigated the dynamic evolution of the double Tongue of Ionization (TOI) into a single TOI at 400 km altitude during the geomagnetic storm of 7 September 2015 by using DMSP observations and model simulations.The double TOIs occurred in the presence of increased southward IMFBzand weak positive IMFBy,and transit to single TOI due to both the northward turning of IMFBzand duskward turning of IMFBy.Further studies showed that the equatorial thermospheric wind jet can be formed in response to the temporal oscillation of IMFBzZhanget al.[85],and the nighttime poleward wind shows a remarkable UT variation during the Subauroral Polarization Streams (SAPS) period Zhanget al.[85].Also,the Disturbance Dynamo Electric Field (DDEF) induced by SAPS can modulate the variations of the EEJ and CEJ Zhanget al.[86].
4 Ionospheric Irregularity and Scintillation
Through the interactions between the magnetosphereionosphere/thermosphere,a large number of ionospheric plasma irregularities and waves are usually generated,which often produce the ionospheric scintillations and Geomagnetically Induced Current (GIC) and more.
4.1 Es
Based on comprehensive observation measurements,our understanding on the plasma irregularity of sporadic-E layer at the middle and high latitude has fruitfully extended.Sunet al.[87–89]investigated the occurrence,morphology and dynamics of large-scale strong Es structures in the East/Southeast Asian sector,and proposed a High temporal Resolution Rate-of-TEC Index (HRROTI) to characterize strong Es irregularity structures.The statistical results of large-scale strong Es structures are shown inFig.9[88].It is found that the large-scale strong Es structures mainly occur during summer months,with dominant horizontal azimuth in the eastwest and northwest-southeast directions and dimensions of 1000–3000 km along the elongation.They predominantly drift southwestward at the speed of 30–210 m·s–1.The main onset region for the large-scale Es structures is identified around 20°N–45°N and 100°E–125°E.It is surmised that gravity waves could play an important role in the generation of large-scale Es structures.

Fig.9 Occurrence of large-scale strong Es structures during 2017–2019 binned into (a) local time and month,(b) the elongation azimuth and dimension,and (c) the horizontal drifting direction and average velocity.(d) The onset locations of all the cases of large-scale Es structures observed during 2017–2019 on a map of topography elevation height.Each black solid line illustrates the location,dimension and elongating direction at the onset of each large-scale Es case
The climatology of the Es occurrence over China and its underlying mechanisms were recently revisited[90,91].It was demonstrated that planetary waves in the MLT region cannot fully explain the seasonal variations of the periodic disturbance of Es.Solar and geomagnetic activities can also result in periodic variations of the Es.Further numerical simulations suggested that the turbopause plays an important role in forming lowaltitude Es layer in the middle and low latitude region.
Xuet al.[92]presented a physical model of Es layers at middle latitudes based on wind shear theory to reexamine the influence of seismogenic electric fields on Es layers.The results show that zonal electric fields of several mV·m–1can influence the formation of higher Es layers.However,by comparing the altitude variation profiles of vertical ion convergence intensity derived from HWM14 model and Es-layer parameters obtained from COSMIC,Qiuet al.[93]showed that their maxima appeared at different altitudes.The Es traces and the wind shear nodes are not completely overlapped in the vertical direction[94].Further investigation is required on the formation of Es associated with wind shear.
It has been widely proposed that Es layers play an important role in the formation of Sporadic Sodium Layers (SSL),but detailed studies of their dynamic process and evolution are still lacking.To clarify the dynamic properties of Es/SSL,an SSL associated with a strong Es layer was studied by Chenet al.[95],based on measurements of sodium density,atmospheric wind field,and temperature from the three-frequency Sodium resonance fluorescence Doppler lidar at Zhongshan.The temporal/spatial sodium density variations strongly indicate that the formation and perturbation of SSLs are related to the evolution of Es layers due to varied electric fields and atmospheric gravity waves,while it is advected by the horizontal wind.
Wanget al.[96]analyzed the response of the Es to the annular solar eclipse over Eastern China on 21 June 2020.The Es can be multilayered during the solar eclipse,which is mainly distributed at much higher altitudes (130–190 km).Moreover,it is interesting to find that the Es layer is being uplifted significantly over the center path of the moon shadow near the maximum obscuration of the solar eclipse.The results suggested that the occurrence of the small-scaled Atmospheric Gravity Waves (AGWs) and the transport process mainly control the Es behaviors over eastern China during the 2020 annular solar eclipse.
Wanget al.[97]carried out a comprehensive study of the polar cap Es layer associated with GPS TEC variations and scintillations with multiple measurements at Resolute,Canada.According to the joint-observations,the polar cap Es layer is a thin patch-structure with variously high electron density,which is gradually developing into the lower E-region and horizontally extending>200 km.The TEC variations produced by the polar cap Es layer are pulse-like enhancements,followed by smaller but rapid TEC perturbations.
4.2 TID
MSTIDs at middle latitudes are widely studied,but their sources and their causes are not fully understood.Wanget al.[98]analyzed the far-field ionospheric disturbances related to the 2011 tsunamigenic earthquake using the oblique-incidence ionosonde detection network located in North China.ThMSTIDs induced by the tsunamigenic earthquake could transport more than 2000 km westward away from the epicenter and be captured by the network located in North China.The far-filed inland observations of the ionospheric disturbances illustrated how efficiently wave energy could be transported and suggested the remote sensing ability of the ionosonde network for the ionospheric disturbances.
Denget al.[99]investigated the mechanism of MSTID triggering Spread-F in the low latitude using ionosonde and GNSS-TEC measurements.Although it is widely acknowledged that MSTID is normally accompanied by polarization electric fields which can trigger Rayleigh-Taylor (RT) instability and consequently excite Spread-F,the statistical analysis of 13 months of MSTID and spread-F occurrence showed that there is an inverse seasonal occurrence rate between MSTID and spread-F.Thus,only MSTID with specific properties can trigger spread-F occurrence.The MSTID at night has a high possibility to trigger Spread-F.
Huanget al.[100]investigated the variations and relationships of ionospheric irregularities and MSTIDs simultaneously at mid-latitudes over central China based on high-fidelity observations of the TEC from a Beidou GEO satellite during 2016–2017.The ionospheric irregularities and MSTIDs both had evident seasonal and temporal variations.The nighttime ionospheric irregularities were generally associated with MSTIDs after sunset but the situations during the daytime were different.Using TEC data from a chain of GNSS receivers along about 110°E during 2016–2019,Huet al.[101]investigated the local time,seasonal and latitudinal occurrence characteristics of periodic TEC perturbation associated with MSTIDs.
Chenet al.[102]investigated the propagation features of three groups of multiple LSTIDs on 22 June 2015 over China using the TEC data.The observations imply that the propagation of mid-and low-latitude LSTIDs is more complicated than previously reported.
Whereas there have been many studies on the simultaneous occurrence of E region QP echoes and F region MSTIDs at middle latitudes,there are few events reported at low latitudes.Xieet al.[103]present simultaneous observations of nighttime E region QP echoes and Es layers from the VHF radar and digisonde collocated at Fuke,and MSTIDs derived from GNSS TEC measurements at low latitudes.The QP echoes in radar height-time intensity maps were clustered into groups,coinciding with the periods of MSTIDs and strong Es layer (seeFig.10[103]).The MSTIDs had phase fronts elongating in the northwest-southeast direction and propagated southwestward from middle to low latitudes.Similar to the propagation direction of MSTIDs,the low-latitude Es layers also propagated southwestward.For the QP echoing clusters,a westward drift was seen from the radar multi-beam observations.The Doppler velocities of QP echoes show beam dependence,with significantly enhanced positive values in the westernmost beam.When the MSTIDs coming from middle latitudes approach low latitudes,the polarization electric fields associated with the MSTIDs could modulate the E region plasma instability producing QP echoes at low latitudes through the E-F region electrodynamic coupling.

Fig.10 (a) Black solid lines show the Beidou TEC perturbations from fixed IPPs.Red dashed line shows the estimated TEC perturbations in the region connected with radar E region by field lines.(b) HTI map of backscatter echoes for beam 4 of the Fuke VHF radar
4.3 EPBs
As summarized in Liet al[104],the current knowledge of EPBs and ionospheric scintillations in the East and Southeast Asia,including their generation mechanism and occurrence morphology,has been greatly advanced.The current observing capabilities,future new facilities and campaign observations in the East and Southeast Asia provided a good opportunity to address the shortterm variability of EPBs and ionospheric scintillations.
Ionospheric F region bottom-type irregularity layers and plasma plumes observed by Sanya VHF radar during the equinoctial months of 2011–2018 show different occurrence pattern with that of magnetic equator.No clear correlation is found between the occurrences of bottom-type irregularity layer and plasma plume at low latitude.During the days when bottom-type irregularity layers occur,theh′Fwas relatively lower.It is surmised that besides gravity waves,the background F layer height could,oppositely,play a negative role in the generation of bottom-type irregularity layer at low latitude[87].
The occurrences of EPB irregularities over Asian and American sectors often show different behavior due to significantly different geometry of the geomagnetic field.By using the GPS TEC observations over equatorial and low latitudes sectors of Asia and America during 1997–2018,Zhaoet al.[105]presented a comparative study of long-term occurrences of EPB kilometer-scale irregularities over the two longitude sectors.Seasonal variations,solar activity dependencies,latitudinal variation,and magnetic activity dependencies of kilometer-scale irregularity occurrence rates were found to differ significantly between the two sectors.The results will help in designing experiments to understand better the generation of EPB irregularities under the future international meridian circle project.
Xieet al.[106]conducted experiments to observe Fregion echoes at daytime by using the Sanya VHF radar,showing that the daytime F-region echoing structures could appear at any time.Radar interferometry and ICON satellitein-situresults reveal that these daytime echoes were from field-aligned irregularities,which are shown as plume structures in the topside ionosphere.The results indicate that the EPBs could maintain their vertically elongated structures and meter-scale irregularities at F-region topside for much longer time than previously thought and have important implications for understanding their dynamics.
Ajithet al.[107]reported a case of intense and periodic EPBs that occurred during 8–9 April 2013 at Kototabang,Indonesia.The periodic EPBs separated by about 200–250 km were initiated before sunset.The presunset onset and development of these periodic EPBs were discussed in the light of the Gravity Waves (GWs)excited in connection with the deep convection due to the Tropical Cyclone (TC) Victoria.The GW signatures at ionospheric altitudes were also observed from the Ionosonde observations over magnetic equator,and medium-scale GWs were observed from the GPS-TEC data near to the magnetic equator and cyclone center.They surmised that the secondary GWs generated by the dissipation of primary GWs associated with TC Victoria could have served as a seeding source on the generation of periodic EPBs during the two consecutive days.
The EPB irregularities can be significantly modulated by geomagnetic activity.Huanget al.[108]showed that the sunrise EPBs and enhanced post-sunset EPBs were observed in the geomagnetic storm main phase,whereas they were absent throughout the recovery phase.The storm-induced electric field variations could be the primary causal factor that produced the different EPB variations during the storm.Sunet al.[88]compared the general ionospheric responses,as well as the nighttime Equatorial Plasma Irregularities (EPIs) activities between the two geomagnetic storms that happened on 7–8 September 2017 and 25–26 August 2018.It is found that the dusk side ionospheric response could be affected by the daytime ionospheric plasma density/TEC variations during the recovery phase of geomagnetic storms,which further modulates the vertical plasma drift and plasma gradient.As a result,the growth rate of post-sunset EPIs will be enhanced or inhibited.Liuet al.[79]revealed that the particle precipitation is the dominant mechanism for the dayside MIT region irregularities,while nightside MIT region irregularities are strongly related with the temperature gradient drift instability.
Liuet al.[109]investigated the nighttime ionospheric E-F coupling and interhemispheric coupling at middle latitudes from 2006–2018 using COSMIC Radio Occultation data.Significant increases in concurrence rate of ionospheric irregularities in E and F regions were shown during the summer hemisphere.The F region irregularity concurrence at the conjugate hemispheres reached a maximum during the winter hemisphere.Their analysis shows that the E-F coupling and inter-hemispheric coupling were proposed to play the important role in triggering nighttime ionospheric irregularity at middle latitudes.
4.4 Polar Cap Patches
Zhanget al.[110]summarized the recent new progress in the formation and evolution of patches as well as their impact on the M-I-T coupling processes and space weather.The dayside reconnection and bursty sunward return flows produced by the modulation of nightside reconnection are confirmed as the dominant mechanisms which separate the entering ionization into islands(patches).The patches evolve along streamlines of the Dungey convection cycle from the dayside to the nightside and exit the polar cap modulated by pulsed nightside reconnection.Rapidly moving patches are associated with clear ion upflows and the patches often produce significant scintillations at their edges.
Zhanget al.[111]statistically analyzed the polar cap patches in relation to solar and geomagnetic activity.The statistical results indicated that the occurrence of cold patches is clearly dependent on solar and geomagnetic activity,but hot patches do not show such dependence.Cold and hot patches preferably appear in winter.The spatial size of cold and hot patches decreases (increases) with solar (geomagnetic) activity.
Wanget al.[112]developed a new method named TEC keogram for continuous monitoring and studying of large-scale plasma irregularities in the polar ionosphere.The keogram is developed from a movie of TEC maps along various meridian lines from the dayside to the nightside across the magnetic pole.The identification and the motion speed of polar cap patches are confirmed by SuperDARN radar observations.The occurrences of fully-tracked patches on months and UT hours are consistent with previous reports.Besides,the dependence of the patch occurrences on IMFBzindicates that the magnetic reconnection is probably the main mechanism in the patch formation.
4.5 Scintillations
The ionospheric irregularities could cause scintillation at both high and lower latitudes.Wanget al.[113]reported a unique example that a polar cap arc producing clear amplitude and phase scintillations in GPS L-band signals,using observations from an all-sky imager and a GPS receiver at Resolute Bay and the SuperDARN Inuvik radar.During the southward Interplanetary Magnetic Field (IMF) condition,the polar cap arc moved quickly from the dusk-side to the midnight auroral oval at a speed of about 700 m·s–1,as revealed by all-sky 557.7 nm and 630.0 nm images.When it intersected the ray path of GPS signals,both amplitude and phase scintillations appeared,which is very different from previous results.They proposed that the strong TEC enhancement(about 6 TECU) and flow shears in association with the polar cap arc under the southward IMF condition were creating the scintillations.
Genget al.[114]produced the amplitude scintillation index maps in terms of GPS scintillation data in South China.The scintillation map can be used as a routine product for the now-casting and warning of scintillation events over Southern China.Genget al.[115]analyzed the temporal and spatial characteristics of cycle slip events using the data from Chinese 260 GPS observations during the period of the year 2015–2018.The cycle slips have dependence on the local time,seasons,solar activity,and latitude.The cycle slip occurrence has a strong correlation with solar activity and ionospheric scintillation.
Xionget al.[116]provided the comparison of the GPS signal amplitude degradations from receivers on board low Earth orbiting satellites at different altitudes.Intense carrier phase variations but almost no amplitude fades (less than 2 dB·Hz) are observed when the spaceborne receiver lies right inside the ionospheric plasma irregularities,like the case for the Swarm (seeFig.11[88])and CHAMP satellites flying at about 400–500 km.Zhaoet al.[117]presented the phenomenon of loss of lock of satellite signal at the middle latitude region by using a ground-based GNSS ionospheric TEC and scintillation receiver at Weihai,China,during a period of 2018–2019.
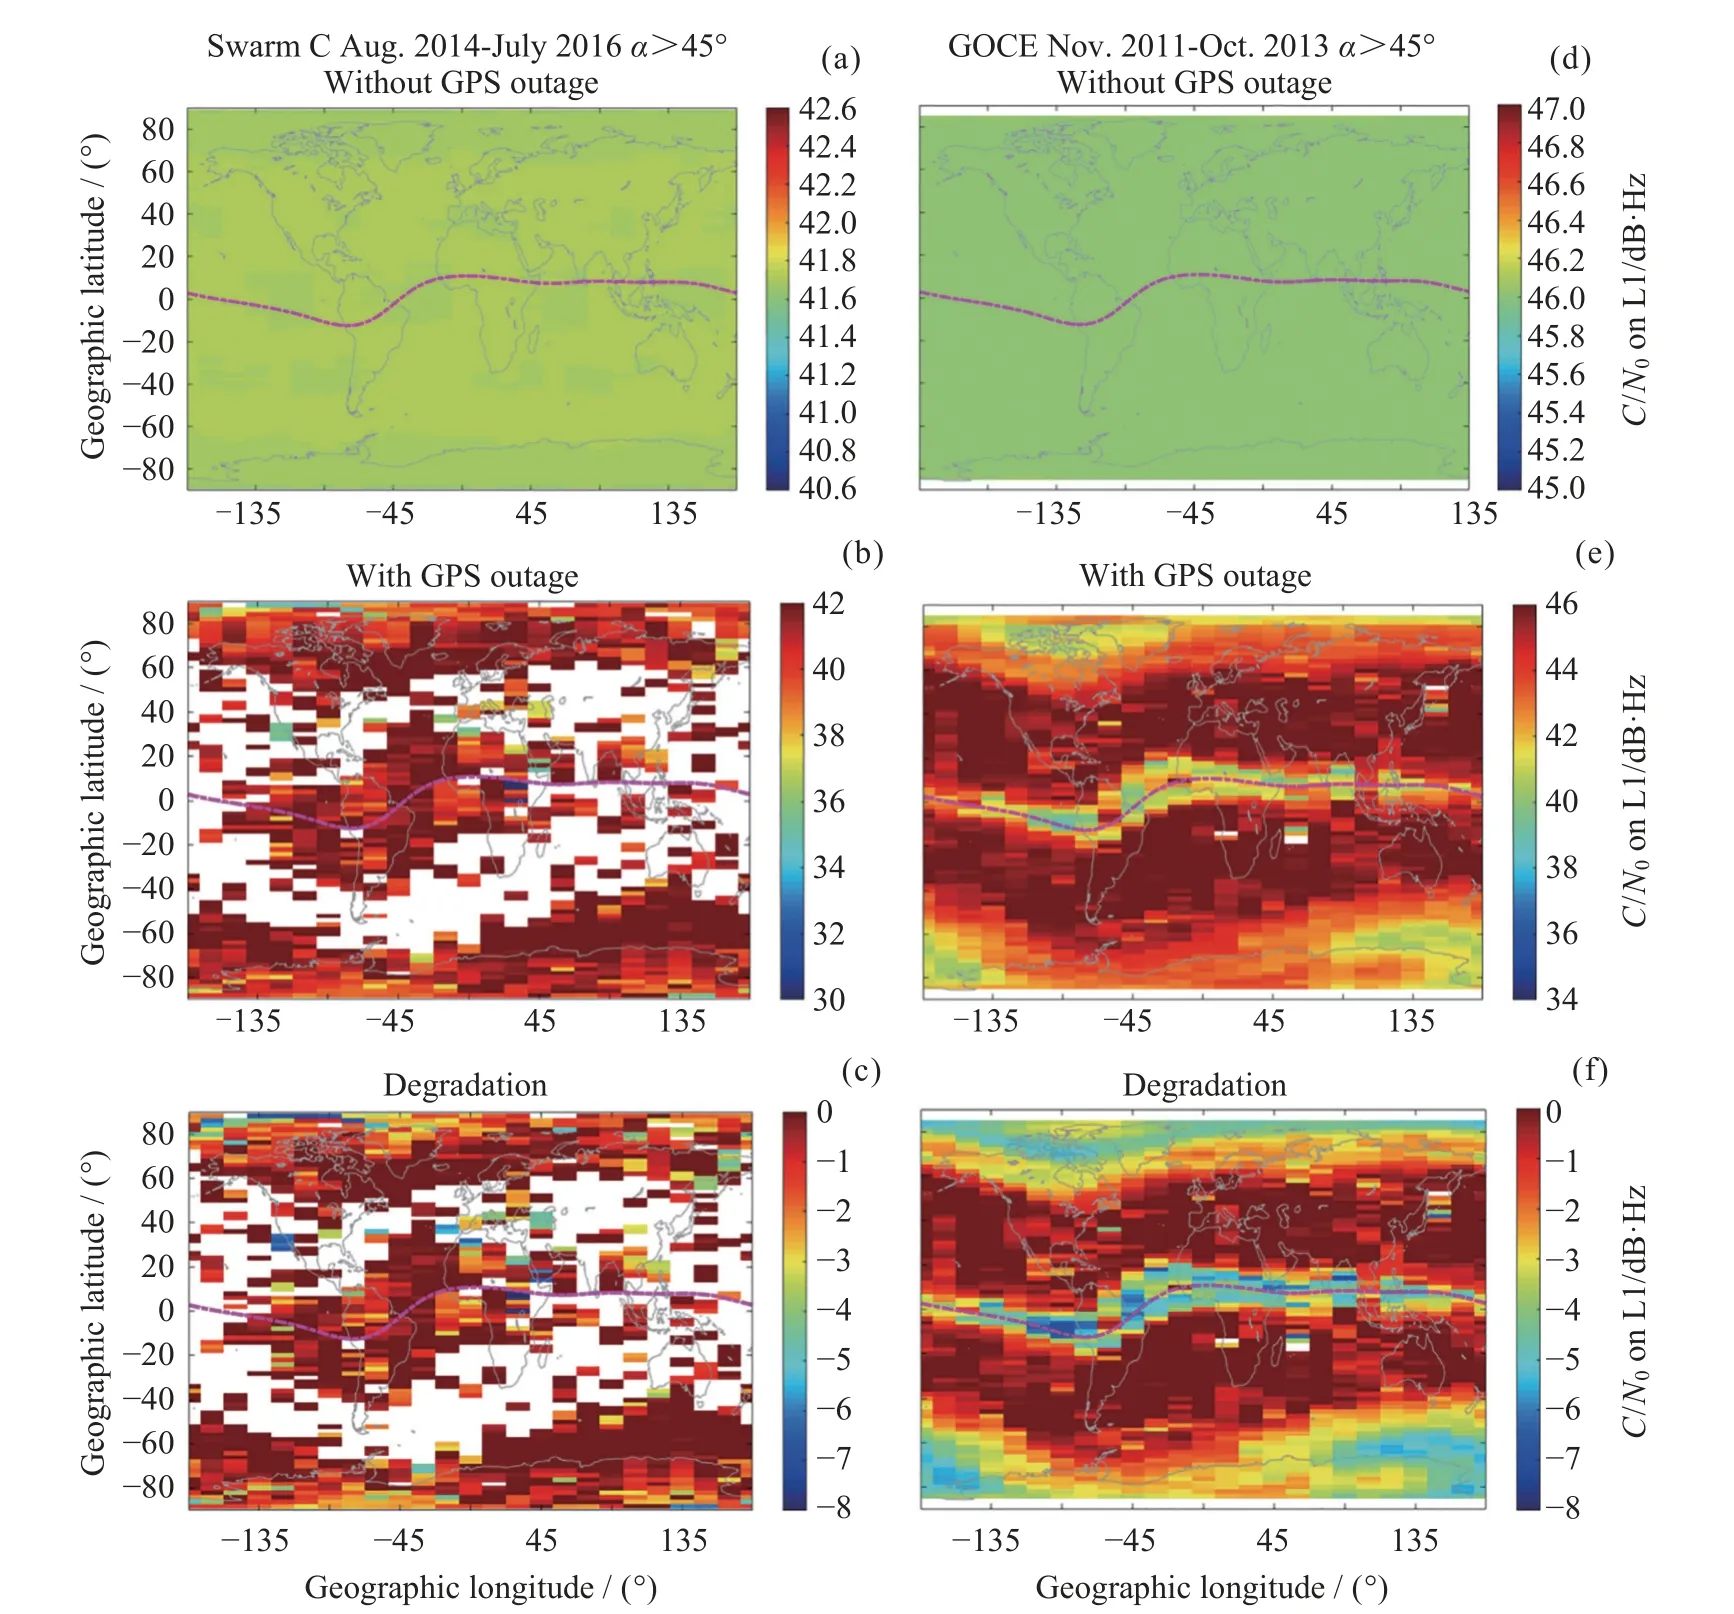
Fig.11 Global distributions of received GPS signal amplitude for Swarm C and GOCE satellite
Jianget al.[118]studied the effect of ionospheric irregularities on the propagation of radio waves and reproduced spread F on the ionograms when ionospheric irregularities occurred in the ionosphere.
Numerical simulations were also used to investigate the scintillation associated with artificial technique.Gaoet al.[119]presented the high-resolution numerical simulation of ionospheric instability triggered by chemical release.The upwelling,pinching,penetrating,and bifurcating processes of artificial instability are produced with electron density patterns generated by using this model.Zhaoet al.[120]presented a simulation model for the vaporized samarium release in the ionosphere and the redundancy reaction,inversion and the photochemical reactions were all taken into account.The model results were consistent with experimental observations.Due to the geomagnetic field and neutral wind,the shape of artificial plasma clouds changes significantly.The error of the spherically symmetric reflection model is large.According to the density distribution of plasma clouds,the Geometric Theory of Diffraction (GTD) is introduced here in dealing with the electromagnetic scattering.The GTD-based scattering model has been established and used to study the time-space evolution of the ground received power patterns in this paper.
5 Modeling and Data Assimilation
5.1 Theoretical and Empirical Models
Theoretical numerical model and empirical model as well are important tools in the study of the ionosphere and upper atmosphere variations.With regards to theoretical model,Danget al.[121]developed a post-processing technique with an averaging-reconstruction (ring average) algorithm to solve the singularity problem in a spherical coordinate with the finite-difference method(seeFig.12[121]).The algorithm is implemented in a community upper-atmospheric model,the TIEGCM,with a finer horizontal resolution in geographic longitude-latitude coordinates,which enables the capability of resolving critical mesoscale structures.Moreover,the ring average scheme has also been implemented in other community models to enable high-spatial-resolution selfconsistent simulations of the whole geospace from the ground to the magnetosphere.
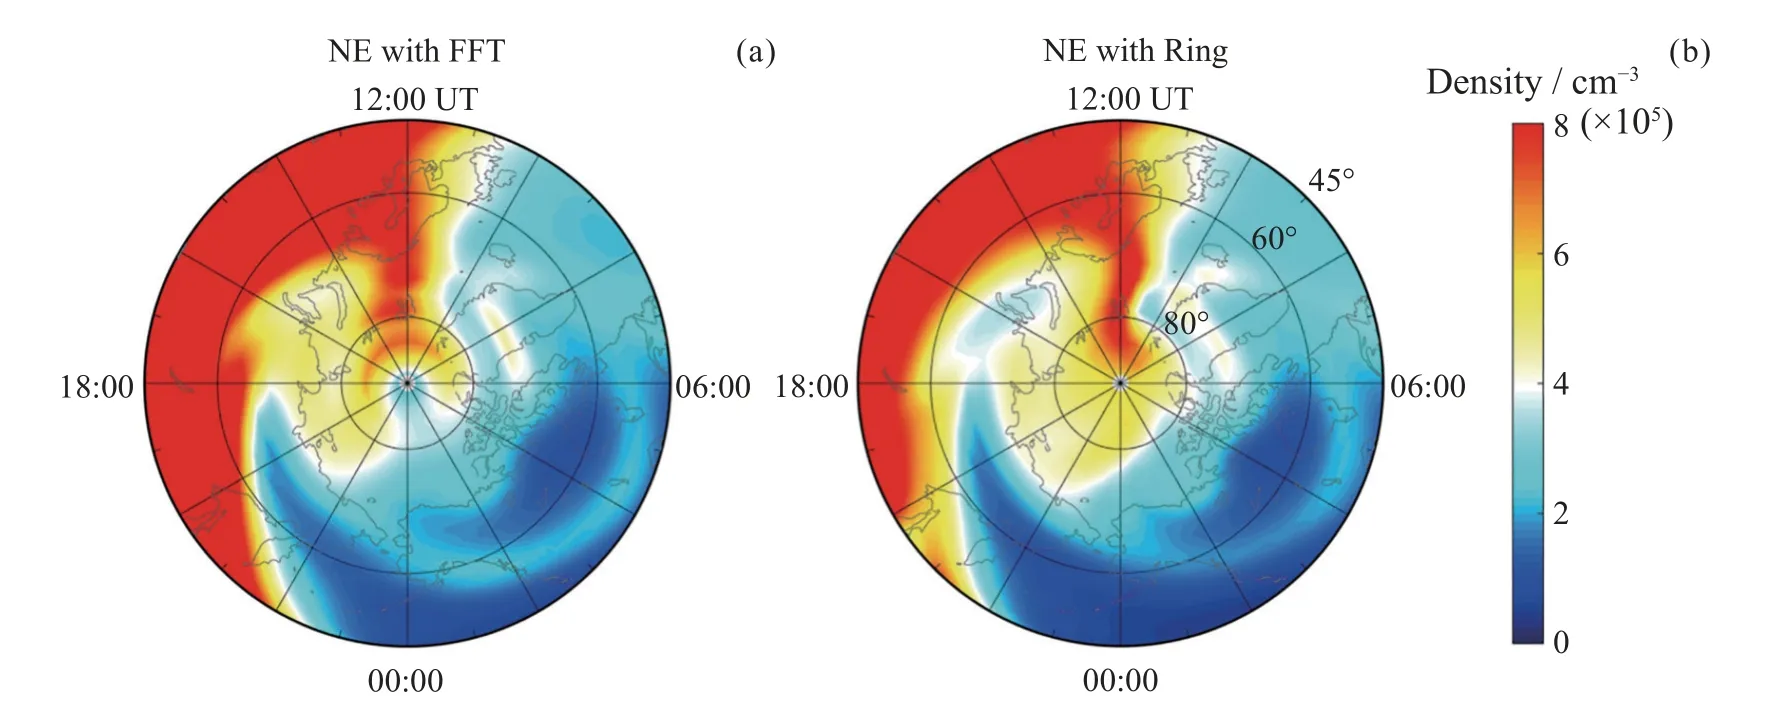
Fig.12 Simulated polar maps of electron densities using an FFT filter (a) and ring average (b) at 10:50 UT on 17 March 2013 as a function of geographic latitude and local time
Liet al.[122]developed an ESF model and presented an effective analysis on some key issues surrounding the modeling of ESF.The model includes flexible adjustments of advection schemes and resolutions,which provides the capability to examine the effects of grid resolution and numerical diffusion on ESF simulation.It was found that advection schemes with the total variation diminishing property are preferred for preventing spurious oscillations which occur near the steep density gradients in the ESF.On the other hand,schemes with low diffusion are also desirable to model complicated dynamic structures of the ESF.Moreover,numerical experiments suggest that some of the secondary instabilities in idealized ESF simulations,although with morphological similarities,are possibly initiated by numerical seeding,which may differ from the observed evolution of secondary ESF.
Empirical model is an efficient tool in the ionospheric research.Liet al.[123]constructed a new empirical model ofNeprofile in F region ionosphere,using 13-yearNeprofiles from COSMIC radio occultation.They used five parameters of the α-Chapman function to describe theNeprofiles,and then built the model by applying algorithms of Empirical Orthogonal Function (EOF)analysis and Fourier expansion to each parameter.The model captures well the key temporal-spatial variations of the F region electron density and makes up the descriptive shortcomings (EIA,mid-latitude trough) of IRI-2016.Huanget al.[124]evaluated the three options embedded in IRI-2016 for thehmF2estimation under low and high solar flux levels.They compare the modeledhmF2with observations of digisonde and COSMIC ionospheric radio occultation.They proposed that the performance of the three options do not vary much with solar condition,while they differ greatly with location.
Using the long-term ground-based GNSS receiver and ionosonde data collected in the Brazilian longitude sector during 2012–2020,Zhaoet al.[125]developed an ionospheric strong scintillation prediction model based on the gradient boosting algorithms XGBoost,Light-GBM and CatBoost.A comparison of daily scintillation occurrence from the modeled and observed results during 2014 and 2020 shows that the gradient boosting algorithms are effective for predicting strong scintillations over low latitude,with a prediction accuracy of about 85%.
5.2 Data Assimilation and Machine Learning
With advances in observations and modellings,techniques of data assimilation and machine learning are being applied in the ionospheric modelling and forecasting.Accurate ionospheric specification for the current and future is one of the key tasks in operational space weather.
A series of studies by Heet al.[126,127]observed that simultaneously assimilating different observation types can greatly improve the quality of ionosphere specification.Updating the thermospheric state variables in the coupled thermosphere-ionosphere forecast model in the assimilation step plays an important role in improving the ionosphere forecasting.Also,the ionosphere forecast quality could be enhanced by optimizing the thermospheric neutral componentsviathe EnKF method.The ionosphere electron density forecast accuracy can be improved by at least 10% for 24 h.
Furthermore,He and Yue[128]investigated the impact of perturbing different model external forcing parameters on ensemble generation and forecast capability of ionosphere and thermosphere.Better ensemble members of ionosphere and thermosphere states can be generated if two additional model forcing parameters are perturbed,so that the forecast capability of the ionosphere and thermosphere variables can be further enhanced.
In the past decade,with the increase of space observation data,machine learning has been applied to space weather modeling,especially where the physical relationship is still not very clear from modeling perspective,machine learning and big data intervention can improve the applicability of the model.Based on Ultraviolet Imager (UVI) data of Polar satellite,Huet al.[129,130]constructed two auroral models by using the Generalized Regression Neural Network (GRNN),and the Conditional Generation Adversarial Network (CGAN).SeeFig.13for the comparison[130].

Fig.13 Image of polar UVI (a) and the results of GRNN (b) and CGAN (c) models under the same space environment parameters
5.3 Laboratory and GNSS Modelling
Yuanet al.[84]developed a new global ionospheric broadcast model known as the BDGIM model which maintained a good correction accuracy regardless of the ionospheric effect and had been formally applied to the BDS-3 navigation system.The BDS-3 BDGIM coefficients are available to GNSS users for providing ionospheric corrections.Zhanget al.[131]adjusted the ionospheric global index IG12 using GNSS to calibrate the IRI-2016 model TEC,and the different interpolation strategies for the updated IG12 index were investigated to improve the TEC accuracy in China.Differential Code Bias (DCB) is a significant error source in ionosphere modeling.Liet al.[132]applied Low Earth Orbit(LEO) spaceborne GPS data to estimate GPS satellite DCB,receiver DCB and LEO-based vertical TEC parameters,simultaneously.Liet al.[132]analyzed the dependence of the receivers’ DCB variations on the ambient temperature,and showed that the temperature dependence of DCB varies among different satellite systems and frequency bands.
The Differential Code Bias (DCB) caused by the GNSS satellite transmitter and receiver hardware is one of the main error sources in TEC retrieval.Sheet al.[133]independently solved TEC and DCBs with the hypothesis of local spherical symmetry imposed on the dual-frequency observations from only one individual station.Zhonget al.[134]assessed both the long-term and shortterm variations of the GPS DCBs and receiver DCBs,and confirmed that the long-term variations of the DCBs are primarily attributed to the GPS satellite replacement,rather than the ionospheric variability.The short-term variations of the GPS DCBs are associated with the GPS draconic year,as the Sun’s illumination changes the hardware thermal status of the GPS satellite in a regular period.
Based on the TEC data solved from the GPS data of the tectonic environment monitoring network in mainland China,a long/short-term memory network model(ED-LSTME) with encoding-decoding with convolutional optimization was built by selecting 15 uniformly distributed GPS stations in China,using the data covering one solar cycle from 2006 to 2018,and taking into account the spatial environmental indexKpand other information.Using this model,a new method for ionospheric TEC prediction is developed.The application shows the model prediction performance is better than that of NeQuick and IRI international ionospheric reference models under different geographical locations,seasons,and geomagnetic activities[135].
The laboratory experiment is an alternative way to study the physical mechanisms involved in the ionospheric plasma.Recently,a method was developed to study the generation and evolution of instability in the ionosphere-like plasma in a laboratory environment[136].It was further demonstrated that,under different experimental conditions,the frequency matching relations of the high-frequency-wave mode,low-frequency-wave mode and the pump waves were always satisfied,which confirmed the onset of the parametric decay instability in the ionosphere-like plasma.In addition,the existing background wave mode could significantly decrease the excitation threshold of the parametric instability,indicating that the parametric decay instability can be much more easily excited.
6 Ionosphere Sounding Techniques
Ground-based observation chains in China were built up under the support of Chinese Academy of Sciences,and Chinese Meridian Project,and National Natural Science Foundation.An Ionospheric Observational Network for Irregularity and Scintillation in East and Southeast Asia(IONISE) was also developed[137].The IONISE network mainly includes three crossed chains of GEO TEC/scintillation receivers along 110°E,23°N and 40°N respectively,multi-static portable digital ionosondes,and bistatic very high-frequency radars.The scientific objectives of the IONISE were to trace the occurrence and movements of ionospheric irregularities producing GNSS loss-of-lock and scintillations;capture ionospheric disturbances of various scales by natural sources,e.g.,low atmosphere activity,geomagnetic activity and earthquake;and reveal extremely large gradients of background ionosphere over China and adjacent regions.
Optical observation system for meteor and ionospheric irregularity had been developed by Yanget al.[138].This system consists of several video cameras at Sanya and Ledong,separated by about 70 km.It can capture meteor optical trail and spectrum and save it as video format file.The corresponding methods for identifying emissions from meteor and atmospheric species,and calculating the meteor velocity,trajectory and orbital parameters were also developed.This information may help us to study how the meteoroids gain entry into the Earth’s atmosphere and effect changes on the ionosphere throughout the combining radio observation.
Yueet al.[139]reported the preliminary experimental results from the state-of-the-art phased-array ISR at Sanya.A smart iterative strategy based on trust region method for ionospheric parameter extraction from ISR detection was developed[32].Tests and comparisons between the smart strategy and the conventional strategy,which is based on the Levenberg-Marquardt method,show that the efficiency of the smart iterative strategy is much higher than the conventional strategy.A software incoherent scattering radar has been designed and fabricated under the grant of National High Technology Research and Development Program[140].Ionospheric detection experiments have been carried out to test this software radar.
Liet al.[122]introduced the new Fabry-Perot Interferometer (FPI) at Mohe.The climatological feature of the thermospheric wind was carried out and an empirical model was developed.The study shows that,when examining regional differences in the ionosphere,more focus should be placed on the effect of regional changes of thermospheric winds.
Jianget al.[141]carried out a statistical study of autoscaled data from ionograms by the ionoScaler to verify its performance for space weather.They found that the autoscaled data by the ionoScaler were accurate enough for space weather if the quality of ionograms is good.
Progress has been achieved in the past two years to use the European Incoherent Scatter Scientific Association (EISCAT) to explore ionospheric processes.Fenget al.[142]developed an algorithm for the automatic extraction of naturally enhanced Plasma Lines (PLs).The results show that the occurrence time of PLs strongly depends on the magnetic local time and correlates with the geomagnetic and solar activities.Wuet al.[143]presented an observation of altitude descents in High-Frequency enhanced Ion Line (HFIL) and Plasma Line (HFPL).Fenget al.[142]presented the evidence of X-mode suppressing O-mode heating by analyzing ionospheric heating experiments.It was found that TPI was inhibited by X-mode heating because of the increase in electron temperature.
Yanget al.[144]present observations of ELF waves received on the satellite and on the ground simultaneously,which were excited in the EISCAT modulation heating experiment carried out alternately in the AM and BW modes.Luet al.[145]present the results of the first ELF/VLF communication experiments being conducted at Tromsø,where the EISCAT HF facility is located.The ELF/VLF waves from the ionosphere are modulated by Quaternary Phase Shift Keying (QPSK) and used for communication.ELF communication signals generated by the amplitude modulation heating of the ionosphere have been successfully received by the satellite and the ground-based receiver.These experimental results confirm that the ELF/VLF waves radiated by amplitude modulation heating of the auroral electrojet can be used for long-distance communication in the future.
The CSES was successfully launched on 2 February 2018.Not only the satellite mission but also many scientists were concerned on the quality of observation data.Liuet al.[57]carried out the data comparison of electron density between CSES and DEMETER satellite,Swarm constellation and IRI model,and they found that the patterns of electron density for CSES can exactly exhibit the shape of ionospheric variation.Yanet al.[146]comprehensively comparedin-situNeand temperature(Te) measured by Langmuir Probe (LAP) on board CSES and other techniques/models.It reveals that the global distributions and their relative variations ofNe/Tefrom CSES and Swarm are quite consistent during conjunction periods of the two satellites.
In 2018,a total of 17 SURA-CSES experiments have been carried out and analyzed in multiple parameters detected in the topside ionosphere at an altitude of 507 km from CSES[147].X mode emitted HF waves excited a filamentary structure on the existing VLF transmitters at 19 kHz in local daytime,being different from those in O-mode HF waves to enhance the VLF transmitter signals and widen their frequency band in local nighttime.The higher conductivity in E region,the selffocused instability,and strong heating of HF waves on lower ionosphere are considered to be the possible mechanism for these overlapped and enhanced VLF transmitters.
The observations from CSES were further used to study the ionospheric disturbance and also the temporal and spatial distributions of ELF/VLF wave activities,as well as the energetic electron fluxes in the ionosphere during intense storm periods[76,148,149].The storm events excited some significant ELF/VLF waves and enhanced the energetic electron flux.
7 Planetary Ionosphere
Yanget al.[150]present a concept simulation for the measurement of Martian atmospheric winds using the Doppler Michelson interferometry technique.The simulation is based on the satellite instrument initially designed for the Dynamic Atmosphere Mars Observer(DYNAMO) project to measure vertical profiles of winds from the 1.27 μm airglow observations in the Martian atmosphere.A comprehensive DYNAMO measurement simulation forward model is developed using the Michelson equation.The agreement between the derived atmospheric signals from the simulated interferogram without altitude inversion and the input parameters used to initiate the forward model confirms the validity of the forward model.
By using MAVEN and photochemistry models,the characteristics of the Martian photoelectrons,and their impact on the Martian upper atmosphere have been studied extensively[151–155].Many new results were obtained.For instance,it was found that for nightside photoelectrons,their occurrence rate declined rapidly near and beyond the terminator;their velocities were more likely parallel to the ambient magnetic field lines;and they were less likely observed under high solar wind dynamic pressures.
Also,Niuet al.[156]investigated systematically the variations of the occurrence of suprathermal electron depletions in the nightside Martian ionosphere and revealed that depletions were more easily observed in regions with near horizontal magnetic fields and under low Solar Wind (SW) dynamic pressures.Niuet al.[157]reported that in situ nightside neutral heating was dominated by exothermic chemistry and Maxwell interaction with thermal ions for regions with depletion,and by direct SW impact for regions without.Collisional quenching of excited state species produced from a variety of channels,such as electron impact excitation,dissociation,and ionization,as well asdissociative recombination,made a substantial contribution to neutral heating,except during depletion.For comparison,nightside ion heating was mainly driven by energetic ion production under all circumstances.
In addition to the photoelectron in Martian ionosphere,Caoet al.[158]presented a statistical survey of ionospheric photoelectrons at Titan.The spatial distribution of photoelectrons was consistent with the scenario of photoelectron transport along the magnetic field lines.The analysis also revealed the presence of a photoelectron gap in the deep nightside ionosphere where it was very difficult for photoelectrons to travel to this region.
The ionospheric compositional variations of Mars were examined in the unprecedented details,including the dominant O2+production and destruction channels,distribution,and the modulation of the Martian topside ionosphere by the upstream solar wind condition[157,159–161].
The Martian ionosphere has close relationship with the background atmosphere.The species-dependent variations of the dayside Martian ionosphere were presented during the global dust storm period[162].It was suggested that the variation of ionospheric species during a global dust storm was closely linked to the variation of neutral species in the thermosphere during the same event.In addition,the H2distribution is important for a thorough understanding of hydrogen escape and climate evolution on Mars.Cuiet al.[35]reported that several species presented an abnormal dawn enhancement above the exobase where they were mainly produced by ion-neutral reactions involving H2,as shown inFig.14[163].Such a peculiarity was indicative of a dawn bulge of H2present in the Martian upper atmosphere and corona,which was driven by subsidence in regions of horizontal wind convergence and the subsequent buildup of minor atmospheric species with large vertical scale heights.

Fig.14 Density variations of the same species as a function of local time and at fixed altitudes,either 300 km (solid) or 180 km (dashed) depending on whether a distinctive layer structure is observable over the altitude range examined in this study.A strong dawn enhancement is observed for each species in the middle panel.Note that the HNO+ density has been everywhere divided by 100 to improve visibility
Aside the data analysis,a numerical model was also used to explore the generation of the ionospheric irregularities at Mars.Jianget al.[164]carried out nonlinear simulation of small-scale ionospheric irregularities at Mars seeding by perturbation zonal neutral wind.Results show that the associated perturbation magnetic field and electric field,induced by the gradient drift instability,can cause the velocity shear of the plasma,which induced the Kelvin-Helmholtz instability.Then,Kelvin-Helmholtz instabilities furthermore lead to smaller-scale irregularities in plasma density,magnetic field,and electric field in the Martian ionosphere.
AcknowledgmentsThe authors would like to express their gratitude to all colleagues for kindly providing articles and pictures in the course of the preparation for this report.
杂志排行

空间科学学报的其它文章
- Recent Progress in Space Science and Applications of China’s Space Station in 2020–2022
- Overview of the Latest Scientific Achievements of Chang’E-4 Mission of China’s Lunar Exploration Project*
- Recent Status of Taiji Program in China*
- Construction Progress of Chinese Meridian Project Phase II*
- Introduction to the Chinese Hα Solar Explorer (CHASE) Mission
- Current Status and Main Scientific Outcomes of the CSES Mission*