Up/down-conversion luminescence of monoclinic Gd2O3:Er3+nanoparticles prepared by laser ablation in liquid
2022-08-01HuaWeiDeng邓华威andDiHuChen陈弟虎
Hua-Wei Deng(邓华威) and Di-Hu Chen(陈弟虎)
State Key Laboratory of Optoelectronic Materials and Technologies,School of Electronics and Information Technology,Sun Yat-Sen University,Guangzhou 510275,China
Keywords: Gd2O3,nanoparticles,luminescence,laser ablation in liquid
1. Introduction
Rare earth luminescent materials have attracted much attention in recent years due to the unique electronic structure and physical properties of rare earth ions.[1–4]At present,rare earth luminescent materials have been widely used in lighting, display and other fields.[5–10]Rare earth-doped gadolinium oxide is a kind of good luminescent material.[11]On the one hand,the physical and chemical properties of gadolinium oxide are stable.[12]On the other hand,gadolinium ions can be easily substituted by other rare earth ions to get controllable luminescence.[13]In addition, the phonon energy of gadolinium oxide is low, which contributes to the efficiency of upconversion luminescence.[14]Due to the unique energy level structure of Er3+ion, Er3+ion possesses both up-conversion and down-conversion luminescence properties.[15,16]For this reason, compared with other rare earth ions, erbium ion may have more applications.Tunable fluorescent color is a requirement in the application of fluorescent materials.[17–19]It is worth to mention that there exist cross relaxation processes among adjacent Er3+ions.[20]Therefore, the electron distribution in corresponding energy levels can be easily tuned by simply adjusting the doping concentration of Er3+ions, and thus getting controllable fluorescence. In addition, applying nanomaterials to bioimaging is popular in recent years.[21–27]Due to the good tissue penetration of up-conversion excitation light,the application of up-conversion fluorescent materials in bio-imaging has attracted much attention.[28,29]Erbium-doped gadolinium oxide is a good kind of up-conversion fluorescent material.[30]
At present, the studies on monoclinic rare earth-doped gadolinium oxide nanoparticles are rare.[15]The most popular methods for synthesizing monoclinic gadolinium oxide are combustion method and solid-state method.[31]The nanoparticles synthesized by combustion method usually float in the air after burning, which may cause dust pollution. While for solid-state method, it is usually not easy to synthesize nanosized particles. To date,more and more researchers have been dedicating to the research of preparing nanomaterials by laser ablation in liquid(LAL)method.[32–43]Compared with solidstate method,monoclinic gadolinium oxide nanoparticles can be easier to synthesize by LAL.[44]Additionally, nanoparticles synthesized by LAL can be easily collected compared with combustion method because they are dispersed in liquid as they are prepared.
In this work,erbium-doped monoclinic gadolinium oxide nanoparticles were successfully prepared by LAL technique.The nanoparticles can be used as down-conversion phosphors as well as up-conversion phosphors. We got tunable luminescence by simply adjusting the concentration of erbium. In addition,the results of cytotoxicity and fluorescence imaging of living cells indicate that the material has the potential for applications in bioimaging.
2. Experimental details
2.1. Material synthesis
The detailed method of material preparation has been reported in previous work.[45]There are two steps in the preparation process. The first step is to prepare targets. The raw materials (Gd2O3and Er2O3powders) for preparing the targets were purchased from Aladdin Chemistry(China). First,grind the Gd2O3and Er2O3powders with different atomic ratios(Er/(Gd+Er)=0.5%,2%,5%,10%,20%)in a mortar to make them fully mixed. Then an appropriate amount of polyvinyl alcohol (PVA) glue (10 wt%) was added and mixed with the powders.After the powders were dried,they were compressed into tablets. Finally, the tablets were sintered at 1550°C for 6 hours to make ceramic targets. The second step is to synthesize nanoparticles. The target was immersed in deionized water,and then a beam of pulsed laser(wavelength=532 nm,pulse duration = 5 ns, focal length = 200 mm, pulse power=90 mJ,repetition rate=5 Hz)was focused on the target to ablate the target for 15 minutes. Finally, the obtained colloid solution was collected for further characterization.
2.2. Characterization
The morphology of the nanoparticles was observed by using a transmission electron microscope (TEM, FEI Tecnai G2 F30). Dynamic light scattering(DLS)measurements were carried out with an EliteSizer Omni instrument(Brookhaven).The crystal structure of the nanoparticles was characterized by using an x-ray diffraction (XRD) diffractometer (Rigaku,SmartLabx). The fluorescence spectrum and fluorescence lifetime were measured by using a fluorescence spectrometer(FLS980,Edinburgh).
2.3. Cytotoxicity assay
RAW264.7 cells which were purchased from Forevergen Biotechnology Co., Ltd (Guangzhou, China) were incubated with different concentrations of Gd2O3:2%Er3+nanoparticles(20 μg/mL,40 μg/mL,80 μg/mL,and 160 μg/mL)and culture media (DMEM, as the negative control) in their logarithmic growth period. All groups were cultured in a cell incubator for 24 hours. Cell viability assay was carried out by using the Cell Counting Kit-8 (CCK-8) colorimetric solution. And the absorbance at 450 nm was measured by using a microplate reader(Multiskan Ex Primary EIA V,ThermoFisher,USA).
2.4. Fluorescence imaging of cells
RAW264.7 cells were incubated with the Gd2O3:2%Er3+nanoparticles(100 μg/mL)for 12 hours. After co-incubation,the cells were then washed with PBS solution to remove excess particles and dead cells. Fluorescence imaging of the cells was performed on a two-photon confocal laser scanning microscopy(LSM 710 NLO, Carl Zeiss, Jena, Germany)operating at an excitation wavelength of 980 nm.
3. Results and discussion
The crystal structure of the samples prepared by LAL were characterized by XRD. The XRD patterns are shown in Fig.1.
For samples with Er3+concentration of 0.5% to 10%,the XRD patterns match the standard card of monoclinic gadolinium oxide (PDF#42-1465). While for the sample Gd2O3:20%Er3+, there is obvious impurity phase. By comparing with standard PDF cards, it can be found that the impurity phase matches the cubic gadolinium oxide (PDF#11-0604). The results indicate that the crystal structure is monoclinic phase at lower Er3+concentration, while cubic phase will appear in the case of high Er3+concentration. Figure 2(a)is a TEM image of the typical sample Gd2O3:2%Er3+. It can be seen from Fig.2(a)that the sample is nanosized. According to TEM data, a statistical analysis which is inserted in Fig. 2(a) of 160 particles indicated that the average size of sample 2%Er is 22.2±7.6 nm. The particle size distribution of the nanoparticles in solution was monitored by DLS measurement. As shown in Fig.2(b),the peaks of the particle hydrodynamic diameter distribution of Gd2O3:xEr3+(x=0.5%,2%,5%,10%,20%)nanoparticles locate at 214 nm,286 nm,227 nm,239 nm,and 265 nm respectively.
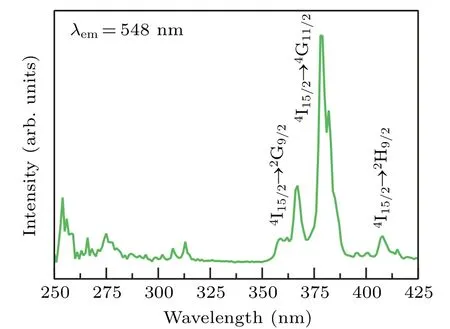
Fig.3. Excitation spectrum of Gd2O3:2%Er3+ nanoparticles.
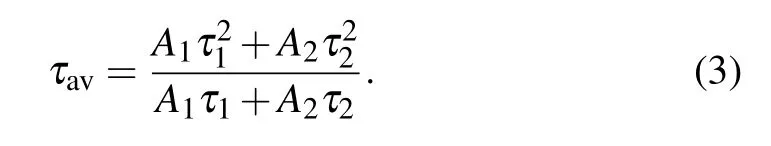
The typical excitation spectrum of Gd2O3:2%Er3+nanoparticles monitored at 548 nm is shown in Fig.3. There are mainly three characteristic absorption peaks in the excitation spectrum. The absorption peaks at 367 nm, 379 nm,and 408 nm correspond to4I15/2→2G9/2,4I15/2→4G11/2,and4I15/2→2H9/2transitions of Er3+ion, respectively. The absorption at 379 nm is the strongest, therefore, 379 nm was chosen as the excitation wavelength for the study of downconversion luminescence. Figure 4(a) are emission visible light spectra of Gd2O3:xEr (x= 0.5%, 2%, 5%, 10%, and 20%)nanoparticles under the excitation of 379 nm. The emission peaks at 527 nm, 548 nm, and 670 nm correspond to2H11/2→4I15/2,4S3/2→4I15/2, and4F9/2→4I15/2transitions of Er3+ion respectively. The near-infrared emission spectra under the excitation of 379 nm were also measured as shown in Fig. 4(b). The emission peaks at 978 nm and 1540 nm correspond to4I11/2→4I15/2and4I13/2→4I15/2transitions of Er3+ion respectively. In addition,it can be seen from Fig. 4(a) that with the increase of the Er3+ion concentration the intensity ratio of 548-nm emission band to 670-nm emission band(I548nm/I670nm)gradually decreases. Thereby fluorescence color was tuned by simply adjusting the concentration of Er3+ion. This phenomenon can be attributed to the increase of the concentration of Er3+ion. When an ion has been excited, there are two types of de-excitation: radiative transition and nonradiative transition. If the exciton undergoes a radiative transition from excited to lower state,photons will be emitted. In addition to luminescence,there is the possibility of nonradiative de-excitation;that is,a process in which the ion can reach its ground state by a mechanism other than the emission of photons.[46]The main nonradiative transition processes include multiphonon emission and energy transfer.[46]According to Dexter’s energy transfer theory,the dependence onR,whereRis the separation between two ions,of the transfer probability can be written as follows:[47,48]
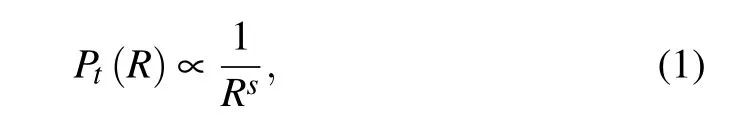
wheresis a positive integer taking the values of 6,8,10,and those values correspond to dipole–dipole,dipole–quadrupole,and quadrupole–quadrupole interactions,respectively. Therefore, the probability of energy transfer between erbium ions increases with the erbium ion concentration. Energy transfer processes between same ions can be mainly divided into two kinds of processes, namely general resonant transfer and cross-relaxation which is a special case of nonradiative resonant transfer.[49,50]In case of general resonant transfer, the initial de-excited state of sensitizer and the final excited state of activator are same. Therefore, the emission color does not change because the population of electrons in excited state does not change. In case of cross-relaxation, one of the ions transfers a part of its excitation energy to the other center,different from the general resonant transfer,the initial de-excited state of sensitizer and the final excited state of activator are different in cross-relaxation process. Hence, the population of electrons in some excited states can be changed by crossrelaxation, and the emission color changes accordingly. In our experiment, the ratio of red to green intensity changed significantly with the increase of Er3+ion concentration. In general energy transfer processes between same ions, only the cross-relaxation process results in a significant change in color. Therefore, we consider this experimental phenomenon results from the cross-relaxation caused by the concentration change. There are also some articles have reported the crossrelaxation between Er3+ions and suggested that the change of the red–green intensity ratio with the change of Er ion concentration is caused by cross-relaxation.[20,51–54]The fluorescence lifetime of 548 nm of Gd2O3:xEr (x=0.5%, 2%, 5%,10%, and 20%)nanoparticles under the excitation of 379 nm had been measured.The results are shown in Fig.5.The decay curves conform to double exponential fitting[55]

whereIis fluorescent intensity which is proportional to the counts in Fig.5,tis decay time,τ1andτ2are fitted lifetimes,I0,A1, andA2are constants. The average lifetime values are calculated by the following formula[55]
As shown in Fig.5,the average lifetime of characteristic emission peak of Er3+decreases with the increase of the amount of Er3+. The significant change in fluorescence lifetime reflects the strong energy transfer between Er3+ions. From the fitting results, there are two decay rates. One of them reflects the decay of a conventional emission. We suppose the other results from the defects on nanoparticles. It has been reported that the defects on nanoparticles can cause double exponential decay rate.[56]Moreover, the oxide nanoparticles synthesized by laser in liquid usually have many defects.[32]There are many studies that aim to alter materials properties by creating defects using laser ablation in liquid(LAL)technology.[32]Those studies are also called laser defect-engineering in liquid(LDL).[32]Therefore,we suppose that the double exponential decay rate may result from the defects on nanoparticles.
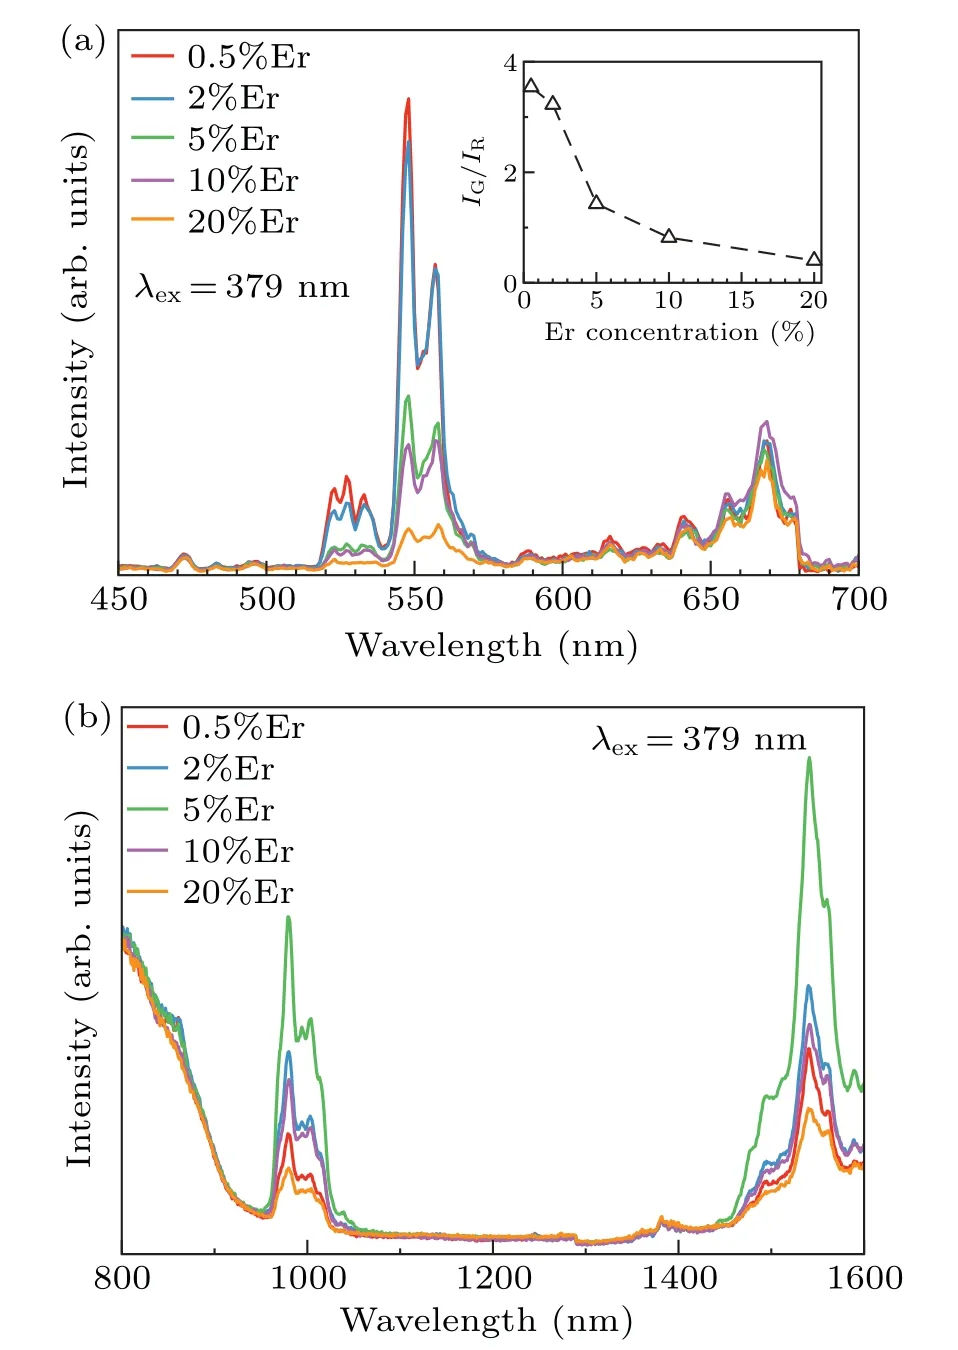
Fig. 4. (a) Visible emission spectra and (b) near infrared emission spectra of Gd2O3:xEr3+ (x=0.5, 2%, 5%, 10%, 20%)nanoparticles under the excitation of 379 nm.
The up-conversion visible fluorescence spectra of Gd2O3:xEr (x=0.5%, 2%, 5%, 10%, and 20%) nanoparticles under excitation at 980 nm are shown in Fig.6(a). Three main peaks at 527 nm, 548 nm, and 671 nm are observed.Those emission bands are assigned as the2H11/2→4I15/2,4S3/2→4I15/2,and4F9/2→4I15/2transitions of Er3+ion respectively. The near-infrared emission spectra under the excitation of 980 nm were also measured as shown in Fig. 6(b).Since the measurement range cannot include the excitation wavelength, the emission spectrum from 900 nm to 1100 nm was not measured under 980-nm excitation. The emission peak at 1540 nm correspond to4I13/2→4I15/2transition of Er3+ion.It can be seen from the up-conversion emission spectra of all samples that with the increase of the Er3+ion concentration the intensity ratio of 548-nm emission band to 671-nm emission band (I548nm/I670nm) gradually decreases. In our opinion, this phenomenon is caused by the cross-relaxation process between erbium ions. It has been reported that the up-conversion emission intensity and pump power follow the following relationship[57]
whereIis the emission intensity,Pis the pump power,andnis the number of the photons involved in up-conversion photoluminescence process. The value ofnis the slop of the linear fitting equation which can be obtained by fitting the plots of lnIversus lnP. As shown in Fig. 7, the value ofnfor green emission band at 548 nm is 1.79 and the value ofnfor red emission band at 671 nm is 1.71. The results that the fitted n is close to two suggest that two photons absorption process is involved in green and red up-conversion photoluminescence processes. This deviation from the expected phenomenon is due to the saturation effects.[58]The valuen=2 is the ideal value for pure saturation processes. The number of the luminescence center is a constant and does not change with the pump power. Therefore,the saturation effect is obviously under higher power excitation.[59]In addition, it was reported that higher pump power can increase the competition between linear decay and the upconversion process of the intermediate excited states,which results in a reduced slope.[59,60]

Fig.5. Decay curves and lifetime values of Gd2O3:xEr3+(x=0.5,2%,5%,10%,20%)nanoparticles(λex=379 nm,λem=548 nm).
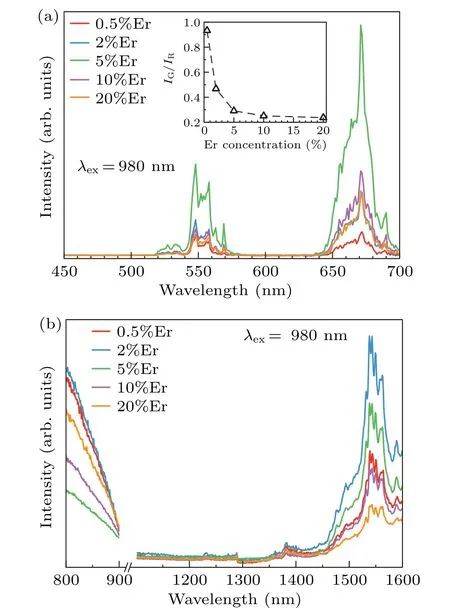
Fig. 6. (a) Visible emission spectra and (b) near-infrared emission spectra of Gd2O3:xEr3+ (x=0.5, 2%, 5%, 10%, 20%)nanoparticles under the excitation of 980 nm.

Fig.7.Double logarithmic plots of up-conversion emission intensities versus pump powers in Gd2O3:2%Er3+ nanoparticles under 980-nm excitation.
In order to better understand the luminescence process of up-conversion and down-conversion processes, the energy level diagram of Er3+ions and the possible energy transfer processes are shown in Fig.8. The possible down-conversion process is shown in the left side of Fig.8. Under the excitation of 379 nm,ground-state(4I15/2)electrons of Er3+ions absorb photons and populate the excited states(4G11/2).The electrons in the excitedstate4G11/2can easily relax to the lower excited states (2H11/2,4S3/2, and4F9/2) via no-radiative relaxation process. Finally, the electrons transfer from excited state to ground state through photon emission. For the up-conversion luminescence under excitation of 980 nm,there are mainly two luminescence processes. One is green emission process. First,the ground state electron transfers to the4I11/2state through ground state absorption (GSA), and then the electron in the4I11/2state absorbs another photon and transfers to the4F7/2state. Then, the electron in the4F7/2state transfers to the2H11/2or4S3/2states through non-radiative relaxation. Finally, the electron transfers from the2H11/2or4S3/2states back to the ground state and the energy is released in the form of green luminescence. Another luminescence process is red emission process. The electron in4I11/2state transfers to the lower4I13/2state through non-radiative relaxation,and then it transfers to the4F9/2state by absorbing another photon. Finally, the electron transfers back to the ground state through photon emission. As the concentration of Er3+ions increases,the probability of cross-relaxation between adjacent Er3+ions will increase,thereby the relative intensity of red emission increases and the relative intensity of green emission decreases.For the up-conversion process,the number of electrons occupying the4I11/2energy level greatly increases due to the GSA process. In this case, the cross-relaxation process is mainly4F7/2,4I11/2→4F9/2,4F9/2.
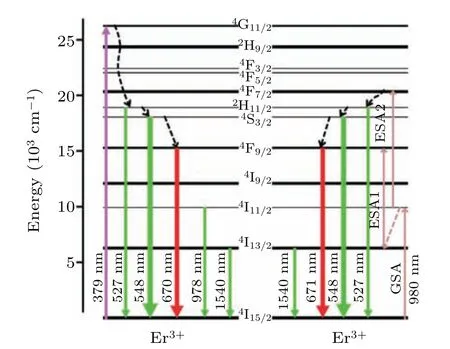
Fig. 8. The possible scheme of energy transfer process of Gd2O3:Er3+nanoparticles.
As shown in Fig.6(a),there are five samples,and the visible luminescence intensity of two samples(sample 10%Er and sample 20%Er) is close to that of sample 2%Er. Therefore,we think the visible fluorescence imaging of sample 2%Er is representative and may show the upconversion fluorescence imaging capability of most samples. So, we choose sample 2%Er for fluorescence imaging application. To explore the feasibility of using Gd2O3:Er3+nanoparticles for biological imaging, firstly the biocompatibility of the Gd2O3:Er3+nanoparticles should be evaluated. As shown in Fig. 9,RAW264.7 cells are employed to assay the cells viability of the Gd2O3:2%Er3+nanoparticles. After 24 hours of incubation with RAW264.7 cell,the nanoparticles had no significant effect on the cell viability of RAW264.7 cell. This shows that the cytotoxicity of the products is low. In order to test the capability of the provided Gd2O3:Er3+nanoparticles for bio-imaging,two-photon fluorescent confocal imaging experiment was conducted. Figures 10(a), 10(b), and 10(c) are the bright-filed image,fluorescence image,and merged image of RAW264.7 cells incubated with Gd2O3:2%Er3+nanoparticles respectively. It is obvious that nanoparticles can be swallowed by cells, and no significant damage of cells was found. Additionally, nanoparticles in cells can emit fluorescence under the irradiation of 980-nm laser. Therefore, the provided Gd2O3:Er3+nanoparticle is a potential candidate for bio-imaging.
In general,color could be represented by the Commission International del’Eclairage (CIE) 1931 chromaticity coordinates.The color coordinates for the phosphors were calculated based on the corresponding emission spectra. Figure 11 is the CIE chromaticity diagram of Gd2O3:xEr(x=0.5%,2%,5%,10%, 20%) under the excitation of 379 nm or 980 nm. As shown in Fig. 11, with the increase of erbium concentration,the color gradually changes from green to orange. The results show that the fluorescent color can be tuned by simply controlling the Er concentration,and the LAL-prepared nanoparticles could be considered as a promising candidate for luminescent material.

Fig.9. Normalized viability of RAW264.7 cells co-incubated with different concentrations of Gd2O3:2%Er3+ nanoparticles. The mass in this figure is the mass of nanoparticles,means±s.d.,n=8.
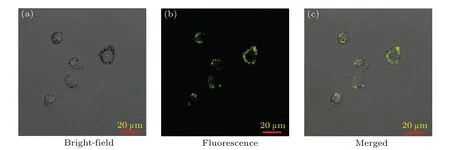
Fig. 10. Fluorescence imaging of RAW264.7 cells incubated with Gd2O3:2%Er3+ nanoparticles. (a) Bright field image; (b) fluorescence image;(c)merged image.

Fig.11. CIE chromaticity coordinates for Gd2O3:xEr3+ (x=0.5,2%,5%,10%,20%)under 379-nm and 980-nm excitations.
4. Conclusion
In summary, monoclinic Er3+-doped Gd2O3nanoparticles were successfully synthesized by LAL technique. The effect of the concentration of Er3+ion on the fluorescence properties has been studied. The fluorescent color can be tuned by controlling the amount of erbium. For cellular fluorescence imaging, the cytotoxicity is low, and the fluorescence in cell is strong enough. The results indicate that the Gd2O3:Er3+nanoparticles synthesized by LAL technique are promising candidates for bio-imaging or other fields that require controllable fluorescence.
猜你喜欢
杂志排行

Chinese Physics B的其它文章
- Real non-Hermitian energy spectra without any symmetry
- Propagation and modulational instability of Rossby waves in stratified fluids
- Effect of observation time on source identification of diffusion in complex networks
- Topological phase transition in cavity optomechanical system with periodical modulation
- Practical security analysis of continuous-variable quantum key distribution with an unbalanced heterodyne detector
- Photon blockade in a cavity–atom optomechanical system