Crown evolution kinematics of a camellia oil droplet impacting on a liquid layer
2022-05-16ZhongyuShi石中玉GuanqingWang王关晴XiangxiangChen陈翔翔LuWang王路NingDing丁宁andJiangrongXu徐江荣
Zhongyu Shi(石中玉), Guanqing Wang(王关晴), Xiangxiang Chen(陈翔翔),Lu Wang(王路), Ning Ding(丁宁), and Jiangrong Xu(徐江荣)
Energy Institute,Hangzhou Dianzi University,Hangzhou 310018,China
Keywords: biomass oil,droplet impact,crown,kinematics
1. Introduction
The phenomenon of droplet impact can be found in a variety of scenarios in nature and industrial applications, such as distillation/rectification, coating, inkjet printing, and liquid spray processes.[1–4]During the scenarios,a liquid film is formed on a solid substrate after the droplets impact it successively. Thus,subsequent droplets actually impact on the liquid film.[5]The droplet interacts strongly with the liquid film when it impacts on it, and the interaction usually leads to a crown formation.[6–8]The crown evolution has a significant effect on the impact behavior of the droplet on the liquid film,and plays an important role in obtaining insight into the principle of heat and mass transfer between the droplet and liquid film.[9–12]Understanding the characteristics of the crown is helpful to explain the physical process of its formation,growth,recession,and fingers pinch-off.
Many researchers have investigated the dynamic behavior of droplet impact on liquid film in industrial applications,and most have concentrated on the crown.[13–16]They have focused not only on the dynamic behavior of the crown expansion but also on its morphology and splashing outcome by considering the influence of key parameters, such as the Weber number (We=ρdv2impd0/σ), Reynolds number (Re=ρdvimpd0/μ), Froude number (Fr=v2imp/gd0), Ohnesorge number (Oh=μ/(ρdd0σ)0.5), impact surface, and droplet and/or liquid film properties.[17–19,21,22]Hered0,ρd,vimp,σ,g, andμare respectively the droplet diameter, density, impact velocity,surface tension coefficient,acceleration of gravity,and dynamic viscosity. A comprehensive review on crown evolution was given by Liang.[23]
From the aspect of liquid properties, most of the studies reported in the literature on the crown are mainly based on the droplet impact on the same or a miscible liquid. They investigated the characterization of crown morphology in terms of the crown length(radius and height). Terziset al.[17]used an exhaust fluid droplet with miscible urea aqueous solution,and conducted an experimental investigation on the prompt splash behaviors in terms of the crown formation. They reported that the main splashing characteristic is the prompt splash (early ejection of secondary droplets)and typical crown-type splash deriving from the rim of the developed crown. Using several polar miscible liquids (i.e., R113, deionized water, ethanol,and acetone), Tian and Chen[24]investigated the influence of the physical properties of these liquids on the impact behaviors. They found that the initial droplet diameter has little effect on the crown morphology and dynamic spreading factor,whereas large viscosity or surface tension hinders its spreading. Penget al.[25]investigated the crown evolution during the impact process with various surface tension coefficients by the volume of fluid method.They found that the higher the surface tension coefficient,the larger the crown diameter. Luet al.[26]investigated the crown morphology of a single ethanol droplet impact on a miscible glycerin solution for various concentrations, and found that both the maximum height and diameter of the crown are functions ofWeandOh. Geppertet al.[27]conducted a benchmark study on crown morphology. They reported that a V-shaped crown was formed by the impacts of binary droplets on a wall–film system with relatively lower film thickness and high liquid viscosity.
In addition to experimental investigations,researchers developed theoretical models to predict the crown evolution,looking for an accurate length scale of crown expansion and its dependence on the impact parameters(i.e.,We,Fr,and/orδ*).Bernardet al.[28]concentrated on the crown radius and found an accurate length scale for the crown rim expansion. Yarin and Weiss[29]investigated crown morphology for different operating parameters, and obtained an empirical correlation of the crown radius

Furthermore, crown velocity and acceleration are crucial to determining the dominant instability mechanism at its rim(related to the number of fingers and their growth rate).For example, the Kelvin–Helmholtz instability depends on the relative velocity between the ambient medium and the crown rim.[31]Similarly, the Rayleigh–Plateau instability depends on the crown rim thickness, which is governed by its acceleration.[32,33]The Richtmyer–Meshkov[34]and Rayleigh–Taylor[35,36]instabilities depend directly on the acceleration of the crown rim. However,the velocity and acceleration of the crown have not been extensively reported in the experimental literature.Bernardet al.[37]experimentally studied the crown kinematics in terms of relevant length,velocity,and acceleration scales by analyzing the effects of key parameters(i.e.,droplet and wall–film properties,impact velocity,and film thickness). They systematically compared their experimental results with theoretical predictions from relevant models to determine their range of applicability.Nevertheless,they still focused on the impact of a droplet on the same liquid(silicone oil). Few studies have reported on the droplet impact on an immiscible liquid film,[38]especially for a droplet with high viscosity and low surface tension. On the other hand,the theoretical predictions of the crown expansion given by Eqs.(1)and(2)rely strongly on experimental conditions(e.g.,droplet miscible with liquid film).It is thus necessary to validate these predictions by the impact of a droplet on an immiscible liquid film.In the present work,we quantify the deviation of theoretical models in Eqs. (1)–(3) from the oil droplet impact on an immiscible water layer and discuss their range of applicability.
The impact of an oil droplet on water occurs in many technical applications. In distillation or rectification, for example, there is a condensed water film formed on the surface of the tray at the top part of the tower. Thus, condensed oil droplets carried in the oil and gas fractions usually impact the condensed water layers, which has a significant effect on the distillation.[39–42]So far,few studies have reported on the impact behavior between a condensed oil droplet and a water layer on the tray surface. Furthermore, achieving clean utilization of biomass oil and its replacement of the traditional petroleum product remain a significant challenge.
The present work experimentally investigates the impact of a single camellia oil droplet with high viscosity and low surface tension on an immiscible water layer by using a highspeed video photography technique. To get a clear insight into its physical processes,the dynamic behavior of the droplet impact of a single camellia oil droplet on a water layer is discussed. In our experiments,the radius expansion of the crown and the average spreading velocity can be described by the theoretical models developed in the previous research.The evolution kinematics including morphology and evolution velocity are analyzed by considering the effects ofWeand layer thickness on the expanding mechanism. The expanding ability of the crown in the radial and vertical directions is characterized by a velocity ratio of rising to spreading for different values ofWe. These results are useful for understanding the physical mechanism of the droplet with high viscosity and low surface tension impacting on an immiscible layer.
2. Experimental devices and method
2.1. Experimental devices and setup
Figure 1 shows a schematic of the experimental setup used in the present study. The main parts of the setup include a droplet generator, an impact platform, a dynamic process monitoring module,and an image data processing system.The droplet generator was composed of a syringe and a micro-flow controller. The micro-flow controller was a syringe-driven pump (Longer TJP-3A) fixed on a platform moving up and down.The droplet was produced by a 10 mL standard medical syringe with a needle,and its outer diameter was 1.0 mm. The liquid layer was formed by filling the liquid(water)into a petri dish with a diameter of 90 mm. A monochromatic high-power LED light was used as the main background light source(with a continuous output light intensity able to reach 12700 lm).An AOS high-speed camera with 1250 fps(up to 15680 fps)and 600×768 pixels was placed horizontally to record the droplet impact on the water layer.

Fig.1. Experimental setup of droplet impact on a liquid layer.
2.2. Experimental methods
The water layer was formed by pouring water into the dish on a platform adjusted in three dimensions to ensure a normal impact at the center. The layer thickness was calculated by its volume divided by the bottom area of the dish.The droplet formed at the needle tip of the syringe, and fell onto the water layer under the action of gravity. The impact was illuminated by an LED light source, and recorded by an AOS high-speed camera. When the recording was finished for each experiment,the water in the dish was replaced with fresh water before the following experiment. To reduce the errors,each experiment was conducted three times,and their average was taken as the final data. All dynamic images and experimental data were processed using MATLAB.
The properties of camellia oil are shown in Table 1 under normal conditions (25°C, 0.1 MPa). Its densityρwas calculated by measuring the mass of a certain volume with an electronic balance (YP602N). The liquid viscosityμwas measured with a Brookfield viscometer,and its surface tension coefficientσwas measured with a BZY-2 interfacial tension meter. Table 2 shows the experimental operating conditions in the present study.
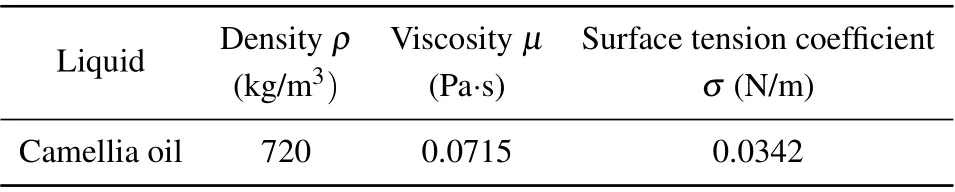
Table 1. Physical properties of the camellia oil.
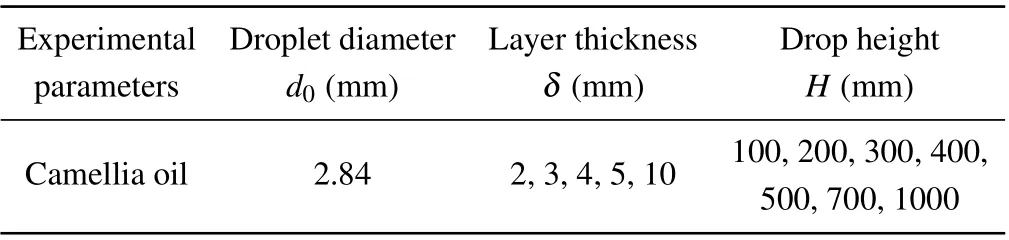
Table 2. Key parameters of experimental operating conditions.
The falling droplet influenced by the surrounding air is not generally spherical. Its initial diameterd0before the impact is defined as[43]
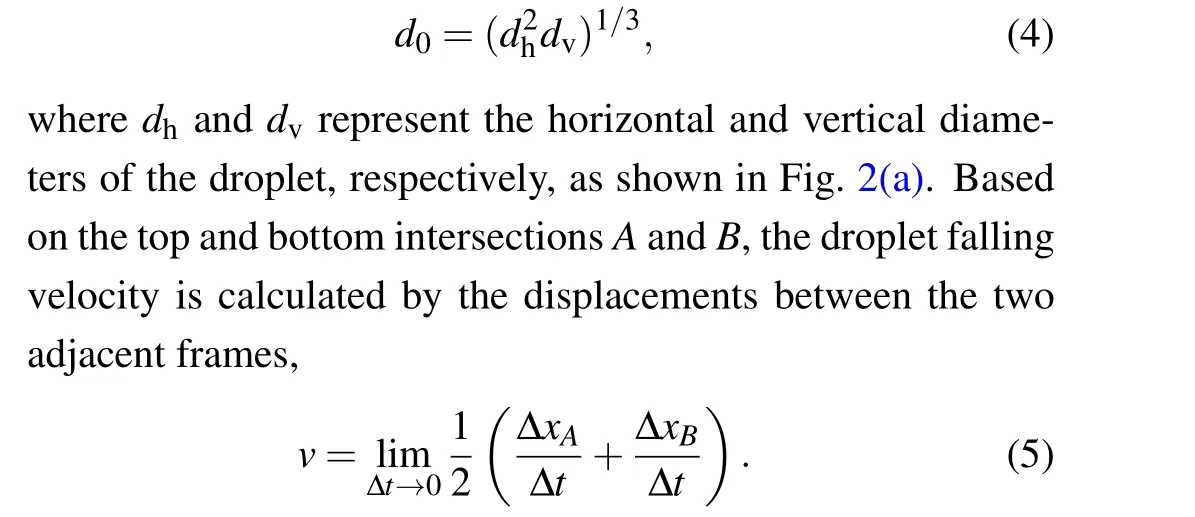
Here ΔxAand ΔxBrepresent the vertical displacements of intersectionsA*andB*,respectively,as shown in Fig.2(b).

Fig.2. Characteristic parameters of the droplet:(a)its horizontal and vertical diameters,(b)vertical displacement between two frames.
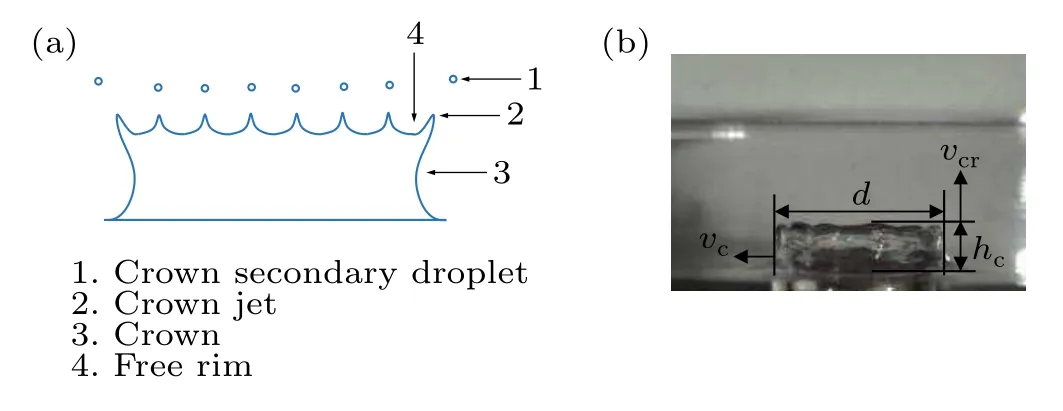
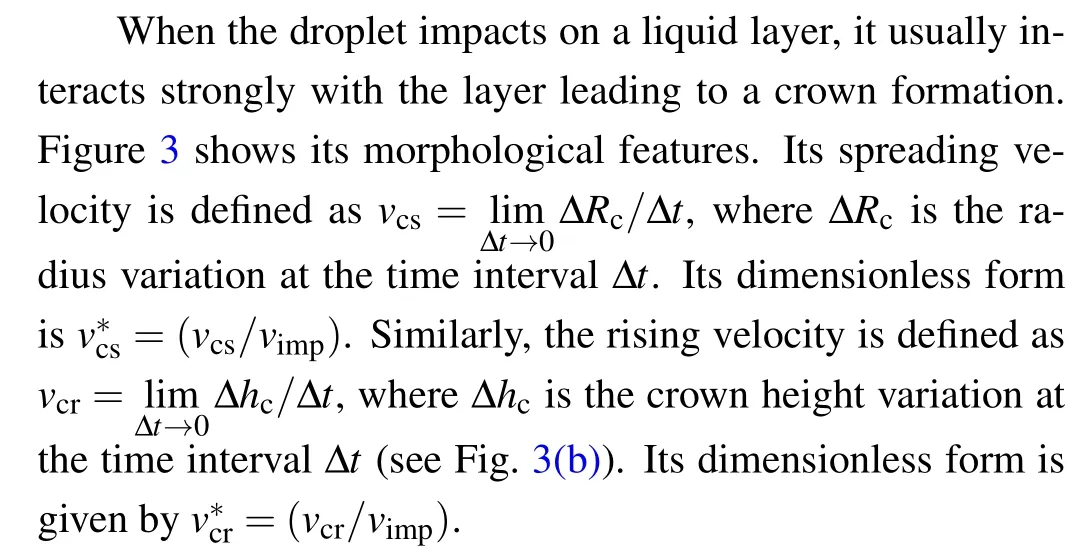
Fig.3. Characteristic parameters of the crown morphology: (a)its morphological features,(b)its sizes and velocities(spreading and rising).
2.3. Validation of the droplet impacting velocity
The impact velocities of camellia oil droplets are calculated by using Eq. (5) for different initial heights. They are compared with the results of Range and Feuillebois’Eq.(6),[44]which considers the effect of air resistance;
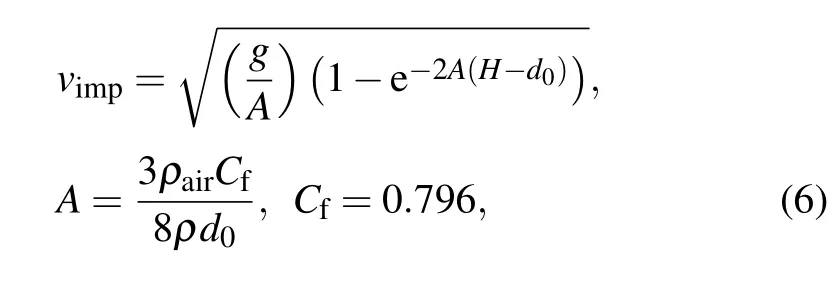
whereHis the initial height of the droplet,ρairrepresents the air density,andCfis the drag coefficient. As shown in Fig.4,it is found that the impact velocities in our experiments agree well with those of Range and Feuillebois. Overall,the average error between them is only 3.06%, and the maximum error is no more than 10.79%. This demonstrates that the impact velocities of camellia oil in our experiments agree well with those of Range and Feuillebois.
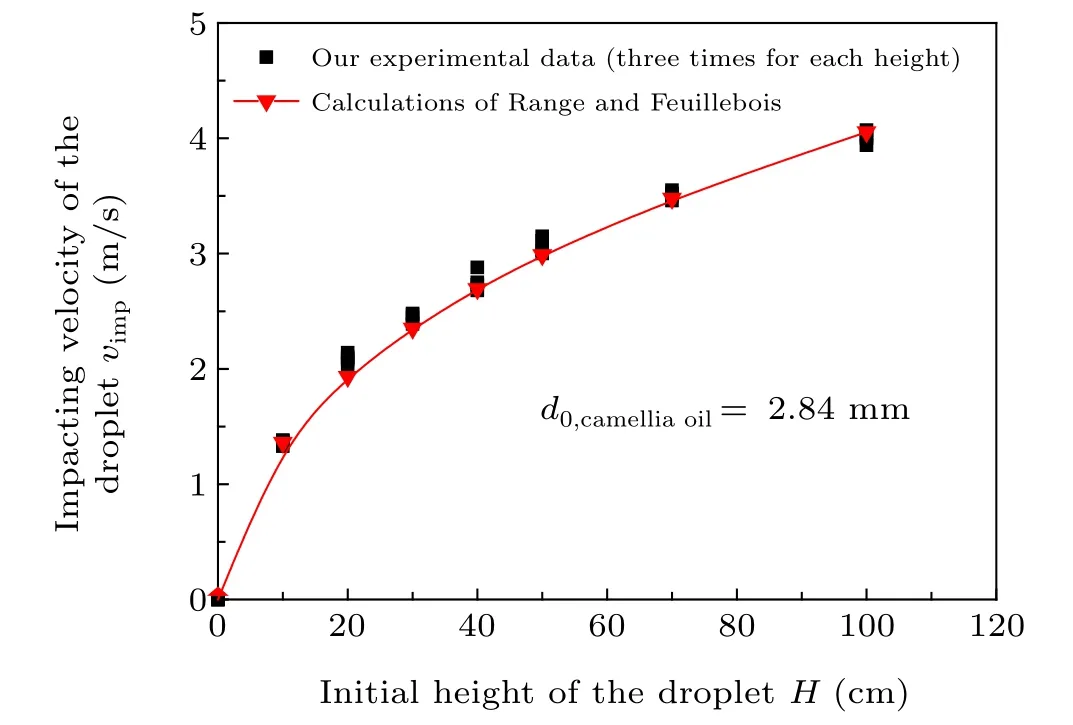
Fig.4. Impacting velocity of the liquid droplet for different initial heights.
3. Results and discussion
3.1. Impacting behavior of a camellia oil droplet on a water layer
Figure 5 shows the impact of a camellia oil droplet on a water layer for three typical values ofWeatd0=2.84 mm andδ*=0.70. It is obvious that the behaviors of camellia oil droplet impact on a water layer are quite different for different values ofWe. With increasingWe, the dynamic time gradually increases,and typical behaviors such as coalescence(Fig. 5(a)), spreading (Fig. 5(b)), splashing (Fig. 5(c)), and a Worthington jet (Figs. 5(b) and 5(c)) emerge from the water layer in sequence.
WhenWeis small, e.g.,We= 113.86, (Fig. 5(a)), the camellia oil droplet directly coalesces into the water layer after the impact,accompanied by the emergence of a small ring around the impact center.The ring then gradually expands outward at a decreasing velocity,causing tiny ripples on the surface. After expanding to its maximum extent att=22.4 ms,the ring begins to oscillate, and gradually retracts radially toward the impact center.

Fig. 5. Impact behaviors of a camellia oil droplet on a water layer for three typical values of We for d0 =2.84 mm and δ* =0.70: (a) direct coalescence (We=113.86, vimp =1.38 m/s), (b) spread, finger, and rebound(We = 732.42, vimp = 3.50 m/s), (c) splash, spread and Worthington jet(We=928.15,vimp=3.94 m/s).
AsWeincreases to a moderate value, the impact morphology of the layer surface changes significantly(e.g.,We=732.42, Fig. 5(b)). At the moment of impact, the camellia oil droplet under the action of inertial velocity begins to push the water layer away, resulting in the emergence of an ejecta sheet around the impact point. Subsequently, the ejecta sheet immediately grows upward and outward,and promptly develops into a clear crown. The crown continues to expand, and quickly reaches its maximum height att=9.6 ms. At this moment,the upper rim of the crown becomes uneven,and fingerlike structures begin to appear on it. Recessions then begin to emerge between the fingers. The concave parts of the crown matrix gradually increase until the fingers seem to be less affected and recede slowly(t=14.4 ms). Recessions continue with increasing time, which leads to the crown matrix coalescing into the water layer and leaves only the top parts of the fingers above the layer surface att=20 ms. After the fingers completely coalesce into the layer surface, a Worthington jet emerges from the impact point due to the inertial retraction of the surface liquid.The jet gradually grows upward and reaches its maximum extent att=40 ms. It emerges small as most of the impact energy of the droplet is dissipated by the liquid viscous resistance, with only a small remaining part converted into potential energy and liquid surface energy. As the evolution time increases further, the jet begins to recede into the water layer,the surface of which finally returns to calm.
WhenWeincreases further to a high value, e.g.,We=928.15, (Fig. 5(c)), the behaviors are different from those in Fig. 5(b). The growth velocity of the crown is clearly faster due to the higher initial kinetic energy. Firstly, the ejecta sheet, a prototype of the crown, emerges at the impact moment. Many tiny secondary droplets escape from the fingertips of the crown rim during its evolution, which is defined as a prompt splash (t=3.2 ms or Fig. 6(a)). After this, the crown matrix continues to grow upward and outward. As the crown matrix reaches its maximum height att=12 ms,its upper rim becomes thicker. A relatively smooth outer edge on the rim is formed. Secondly, the base diameter of the crown matrix continues to increase slightly as the crown falls back(t=21.6 ms). The crown then recedes and oscillates to coalesce into the water layer. Thirdly, the maximum extent of the Worthington jet is much larger than that for moderateWe(t=55.2 ms). The evolution time increases notably,and ends att=76.8 ms after the impact.
IfWe(or the layer thickness)further increases,some secondary droplets will escape from the Worthington jet and rebound upward one after another(Fig.6(b)). The phenomenon can be understood in terms of the kinetic energy. With increasingWe, the initial kinetic energy of the droplet gradually increases and more energy is transferred from the impact droplet to support a larger jet formation in addition to overcoming the liquid viscous resistance. Therefore, the top part of the jet driven by more kinetic energy is distorted and pulled upward under the action of air disturbance and liquid surface tension. This leads to a jet pinch-off of the secondary droplet by stretching separation.[45]
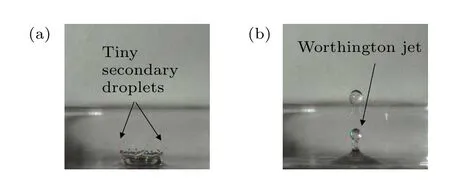
Fig. 6. Typical behavior of a camellia oil droplet impact on a water layer at high We (d0 =2.84 mm,We=971.03, δ* =1.76, vimp =4.03 m/s): (a)prompt splash of the crown,(b)central secondary rebound droplet escaping from the Worthington jet.
3.2. Morphology analysis of the crown diameter
3.2.1. Crown evolution
The crown radius is a characteristic length of the crown morphology. Its evolution is plotted as a function of time in Fig. 7 for the impact of a camellia oil droplet on water layer atd0=2.84 mm andδ*=1.41. It is evident that the crown radius increases quickly with the evolution time after the impact. The increasing crown radii are positively correlated with the evolution time for different values ofWe. It can be inferred that the crown radius still follows a square-root dependence of the evolution time,which corresponds to Eqs.(1)and(2).[29,30]Comparisons between them are further discussed in Subsection 3.2 (see Figs. 8 and 9). As the crown radius expands to its maximum (i.e.,We=753.50,τ=26), it cannot be measured anymore due to the complete coalescence into the water layer at the following moment(τ=27). The water layer surface returns to calm. After a period of calm, a Worthington jet begins to rebound along the vertical direction at the impact center of the water layer (τ=44). In contrast to the time of the crown reaching its maximum height(τ=10),the time of the crown reaching its maximum diameter is much larger (τ=26). The reason is as follows. After reaching its maximum height, the crown begins to recede into the water layer,leading to a continuous expansion in the radial direction.Thus,an increase in the crown diameter is caused not only by its rising stage but also by its recession stage. The radius of the crown then reaches its maximum value immediately before coalescing into the water layer completely. Subsequently,the crown disappears from the water surface until the Worthington jet emerges from the impact center.
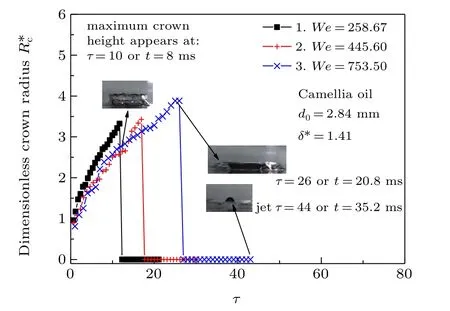
Fig.7. Evolution of the crown radius for different values of We.
3.2.2. Comparison of crown radius with theoretical calculation

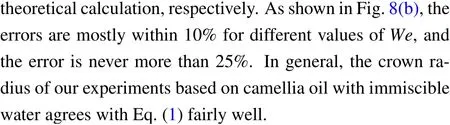
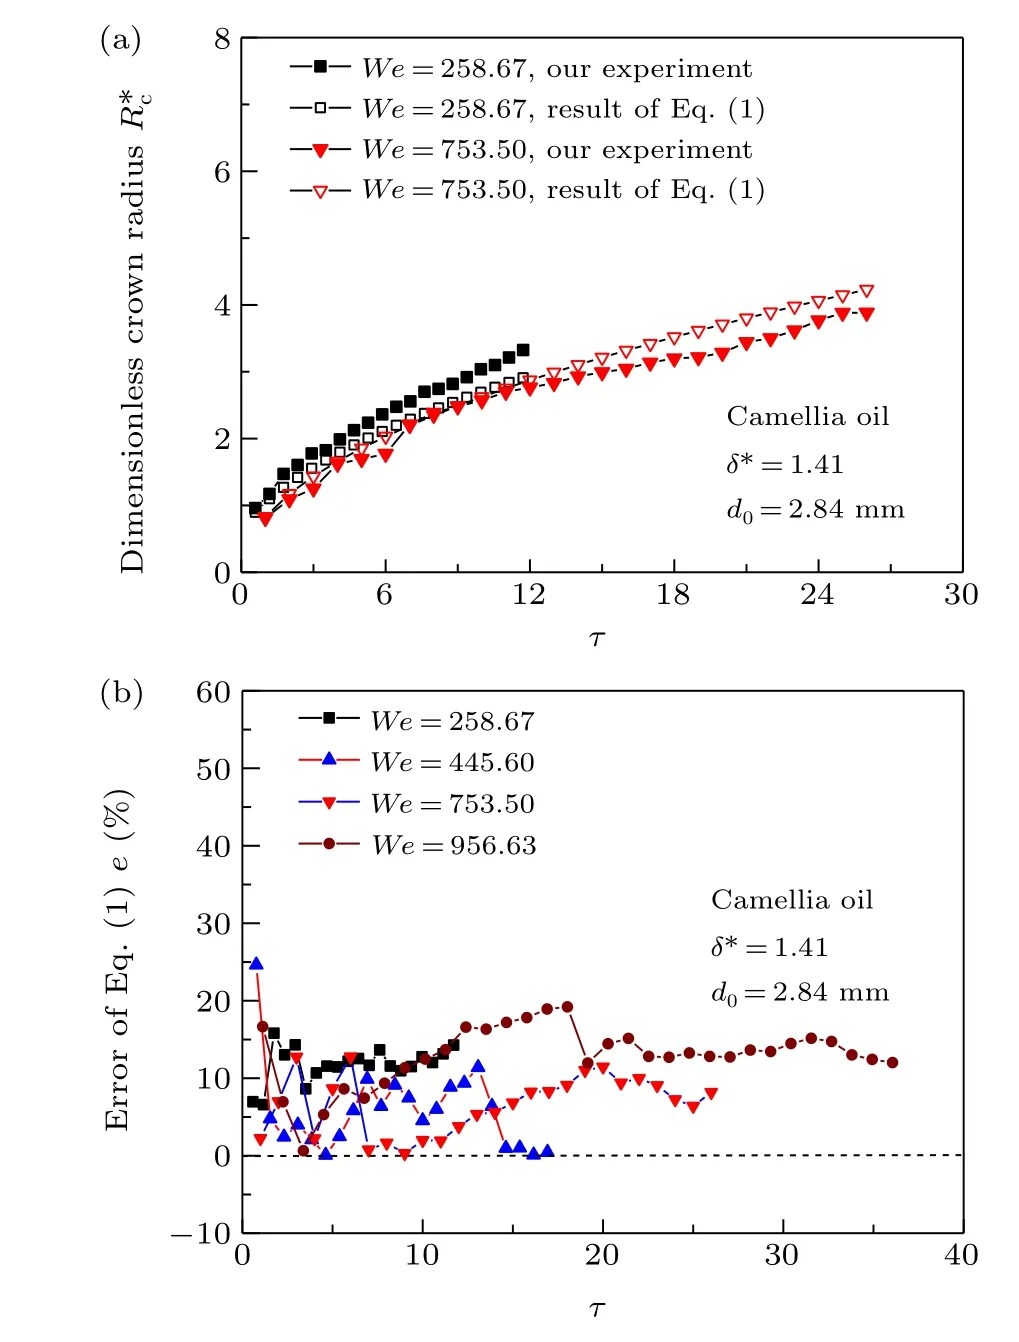
Fig.8. Comparison of the experimental crown radius expansion with the predictions of Eq.(1):(a)experimental and theoretical results,(b)error between Eq.(1)and experiment for different values of We.
As Eq.(1)does not consider the influence ofWe,our experimental crown radii are compared with the predictions of Eq. (2) in Fig. 9 under similar conditions. ForWe=445.60,our experimental crown radius is much larger than that calculated according to Eq.(2)throughout the expansion(Fig.9(a)),while the difference is considerably smaller forWe=956.63.This indicates that Eq. (2) depends strongly onWe. The errors of Eq. (2) for different values ofWeare elucidated by Fig. 9(b). It is found that they are relatively large at the initial stage of crown expansion,and clearly reduce with increasing time. ForWe=445.60, the errors decrease quickly from 345.4%to 47.9%when the dimensionless expansion time increases to 3.08. It then becomes relatively stable at the later stage of the crown expansion (after 5.38). The errors decrease with increasingWe,especially for lowerWe. The average errors are 78.47% forWe=258.67, but reduce to 9.45%forWe=956.63. This indicates that Eq. (1) is preferable to Eq. (2) for lowWe, while the latter is more suitable for predicting the later expansion stage,especially for highWe.
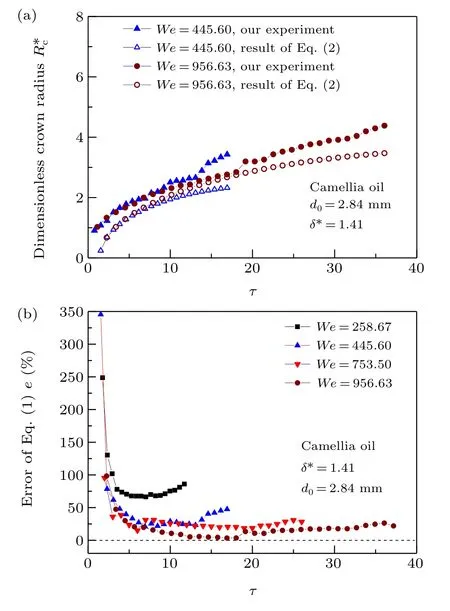
Fig. 9. Comparison of the experimental crown radius with the predictions of Eq.(2): (a)experimental and theoretical radii,(b)error between them for different values of We.
3.2.3. Characteristic diameter of crown at its maximum height
To clearly understand the morphology of the crown, it is necessary to analyze its characteristic diameterdc,hmaxof reaching its maximum height. Asdc,hmaxis directly produced by the impact of the droplet without the crown recession,it is an important indicator for measuring the impact of the droplet to push the liquid layer away. Figure 10 showsdc,hmaxformed by the camellia oil droplet impact on the different water layer thicknesses for different values ofWeatd0=2.84 mm. Thedc,hmaxincreases with increasingWe, while it changes for different layer thicknesses forWelower than 715.78. For layer thicknesses ranging from 0.70 to 1.41,dc,hmaxincreases rapidly withWereaching a critical value(inflection point)and further increasing more slowly. The inflection points are different for different layer thicknesses. For smaller thicknesses of 0.70 and 1.06,the inflection points are located in the range ofWefrom 429.43 to 495.92. For a layer thickness of 1.41,the inflection point is located atWe=715.78. Forδ*=1.76,dc,hmaxgradually increases withWe, and shows a clear linear distribution. There is no inflection point forδ*=1.76 in our experimental range. It may be beyond the maximum value ofWein our experiments,and needs further study. Interestingly,the dependence ofdc,hmaxon the layer thicknesses becomes small asWeincreases to 700 or higher. This further indicates that the layer thickness has little influence ondc,hmaxfor highWe,but not for lowWe(less than 700).

Fig.10. Influence of We on the characteristic diameter of the crown reaching maximum height for different layer thicknesses.
3.3. Morphology analysis of the crown height
3.3.1. Crown height evolution
Figure 11 shows the evolution of crown height,for different values ofWeatδ*=1.41, after the impact of a camellia oil droplet with an initial diameterd0=2.84 mm. The crown height first increases and then gradually decreases after rising to its maximum. The crown height for highWeis much larger than that of lowWeover the whole evolution. This is mainly caused by the increase in the kinetic energy of the crown uprising. AsWeincreases, the ability of the crown to reach its maximum height increases under the combined action of the inertial force and Rayleigh–Taylor instability. On the other hand,the curve of the crown height in the rising stage is much steeper than that in the recession stage. This indicates that the rising velocity of the crown is much larger than its recession velocity. The crown then takes a longer time to recede into the water layer with an increase inWe. Note that the maximum crown height for differentWecan be expressed as a simple function ofτh,max(time of reaching the maximum height):h*c,max=0.1308×τh,max-0.1408,R2=0.963.
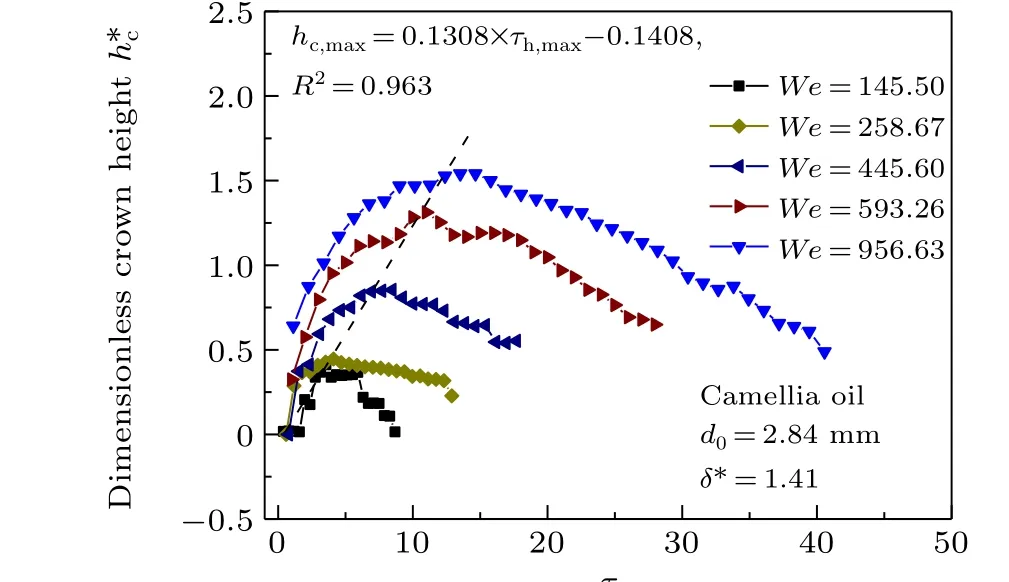
Fig.11. Crown height changes during its evolution(camellia oil,δ*=1.41).
3.3.2. Influence of We on maximum height of crown
The maximum crown height is further investigated in Fig.12 by considering the influence ofWefor different layer thicknesses atd0=2.84 mm. The maximum height of the crown increases with increasingWefor different layer thicknesses. It is positively correlated withWe,and follows a linear function. A simple correlation between the maximum height andWecan be approximated ashc,max=0.0016×We+0.071(R2= 0.974) by the least-squares method. Meanwhile, the layer thickness has little effect on the maximum height,especially for lowerWe. AsWeincreases over 500, its influence on the maximum height increases. For the sameWe,the maximum heights gradually decrease with increasing layer thicknesses.In short,the smaller the layer thickness,the greater the rebound maximum crown height. This is primarily due to the following reasons. For lowWe,due to the small initial impact energy of the droplet, the sinking depth downward is smaller on the water layer, and may be less than the layer thickness(e.g.,δ*=0.70). Then,the remaining energy available for the crown evolution differs slightly,so the maximum height varies insignificantly with layer thickness for the sameWe. WhenWeincreases beyond a critical value, the downward sinking formed by the impact of the camellia oil droplet can be fully developed if the water layer is thick enough. In this case,more energy must be dissipated to overcome the viscous resistance,and less energy is accessible to the crown evolution.The crown height then decreases. Similarly,when the droplet(We >500)impacts a liquid layer with a smaller thickness,the droplet reaches the bottom wall easily,limiting its further sinking. It can be directly rebounded by the bottom wall. Thus,more energy is transferred to support the crown development.The crown height increases correspondingly. Certainly, the water layer cannot be infinitely thin. In our experiment,as the layer thicknessδ*is less than 0.53, the water layer becomes unstable due to the wettability and surface tension. Therefore,whenWeexceeds this critical value(We=500),the following correlation is observed: the lower the thickness of the liquid layer is(δ*>0.53),the higher the maximum crown height.

Fig.12. Influence of We on the maximum height of the crown for different water layer thicknesses.
3.4. Crown evolution rate
3.4.1. Instantaneous velocity of crown growth
The velocity of crown evolution significantly influences its morphology. To obtain a deeper insight into its kinematic characteristics, it is necessary to analyze its velocity during the evolution process. Figure 13 showsv*csof the crown in the radical direction with the evolution time for different values ofWeatd0=2.84 mm,δ*=1.41.v*csof our experiments are compared with the predictions of the theoretical calculations by Eqs.(1)and(2).[29,30]The experimentalv*csbasically coincide with those of the theoretical counterparts.v*csgradually decreases with increasing evolution time due to the viscous resistance of the liquid,and finally reduces to zero. It is negatively correlated with the evolution time, and follows an inverse square root function.v*csare very similar for differentWe,indicating thatWehas little effect on its deceleration,but increasingWedoes extend the expansion time. It is well known that the expansion is a process of reducing velocity in which the droplet pushes the water layer outward by overcoming the effects of viscous resistance. The expansion is affected by liquid properties and the disturbance of surrounding air in addition to the inertial driving velocity. Hence,the process of reducing velocity is unstable. That is,the oscillatory decrease ofv*csis caused by the combined effect of the Rayleigh–Taylor and Kelvin–Helmholtz instabilities(crown action with the surrounding air).On the other hand,asWeincreases,more kinetic energy transferred from the impact droplet pushes the crown to expand outward. Its expansion time then increases correspondingly.
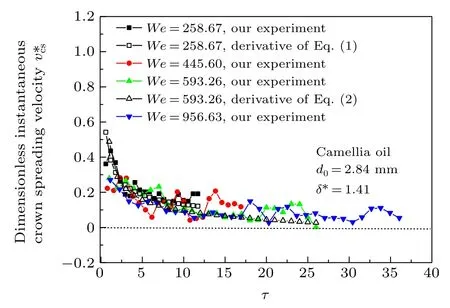
Fig.13. Dynamic instantaneous spreading velocity of the crown for different values of We.
Figure 14 shows the dimensionless instantaneous rising velocity of the crown under the conditions of Fig. 13. The maximum rising velocity occurs in the initial state due to the action of the droplet impact. Under the action of gravity and the viscous resistance of the water layer, ¯v*crfirst decreases rapidly to zero with increasing time, then reaches negative values, and finally oscillates near zero. The behavior of ¯v*crcoincides with the physical process of crown evolution. As ¯v*crfirst reaches zero,the crown increases to its maximum height(¯v*cr=0). The crown then recedes into the water layer under the action of gravity and surface tension(¯v*cr<0). Overall, ¯v*crgradually increases withWe, particularly at the initial stage.Similarly, ¯v*cralso follows an inverse square root function of the evolutionary time.[29,30]
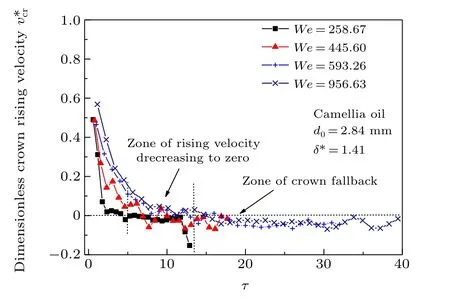
Fig.14. Dynamic rising velocity of the crown for different values of We.
3.4.2. Influence of We on crown evolution rate
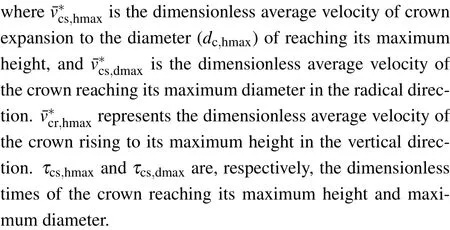
To further get insight into the proportion of spreading kinetic energy in the total(or initial)impact energy,two dimensionless average spreading velocities ¯v*cs,hmaxand ¯v*cs,dmaxare evaluated,
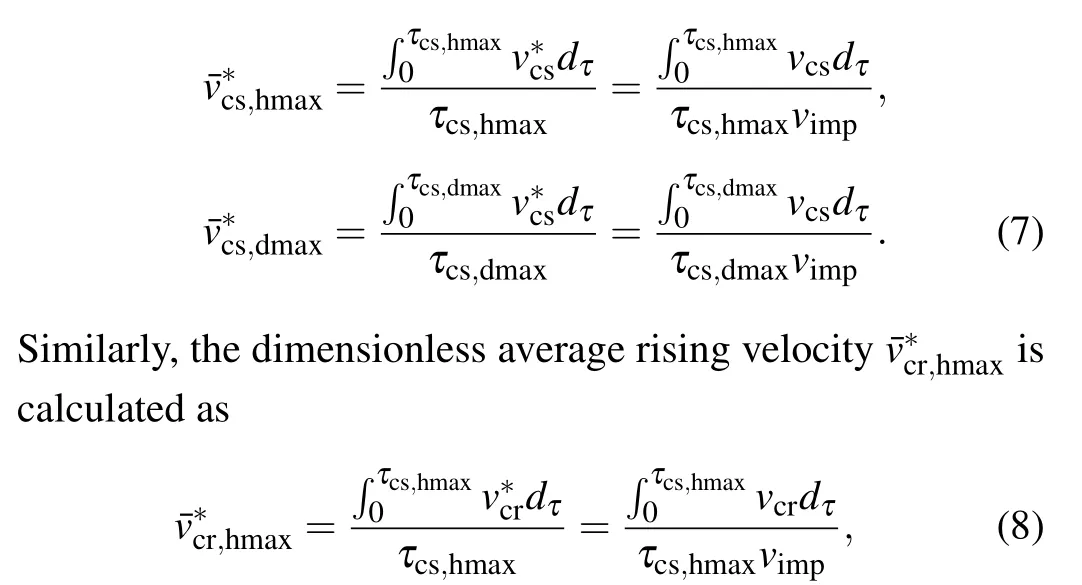
3.4.2.1. Analysis on average spreading velocity
Figure 15 shows dimensionless average spreading velocities with differentWefor the different thicknesses at the corresponding conditions. As shown in Fig. 15(a), ¯v*cs,hmaxgradually decreases withWe, and its decrease gradually slows down asWeexceeds 425. For smallWe(We= 153.06),¯v*cs,hmaxreaches a high ratio of 0.8, while it decreases to 0.2 forWe=990.41. This indicates that the ratio of ¯vcs,hmaxtovimpgradually decreases asWeincreases. After the impact,the droplet needs to push the water layer away to make space for itself. Hence, the initial momentum of the droplet needs not only to be converted to static pressure to push the crown deformation, but also to overcome the viscous dissipation of the liquid and the action of gravity. Thus, the transfer of the momentum from the droplet to the liquid layer reduces significantly during the deformation. With increasingWe, a larger deformation of the crown occurs, more momentum is dissipated, and the remaining momentum is reduced. Therefore,¯v*cs,hmaxis negatively correlated withWe, and gradually decreases with increasingWe. That is,the proportion of spreading kinetic energy in the initial kinetic energy gradually decreases with increasingWe. Furthermore, ¯v*cs,hmaxis indicative of the expansion ability of the crown in the radial direction,demonstrating that the movement ability decreases in the radial direction asWeincreases. Thus, the spreading velocity plays a leading role in the crown formation for lowWe,but its role reduces with increasingWe. In other words, the expansion of the crown in the radial direction is the main motion for lowerWe,but not higherWe.
Similarly, as shown in Fig. 15(b), the distribution of¯v*cs,dmaxis akin to that of ¯v*cs,hmax. It still decreases with increasingWe,but is much smaller than ¯v*cs,hmaxunder the same conditions. This further demonstrates that the crown expansion in the radial direction is not uniform. In addition, the¯v*cs,dmaxdecrease is caused by the crown recession(see Fig.11,recession stage). During its recession,the crown expansion is mainly driven under the action of gravity in the vertical direction in addition to the surface tension. The spreading velocity in the radial direction reduces significantly as it falls. Therefore, ¯v*cs,dmax(including the crown rising and recession stages)reduces, too. The decreasing ¯v*cs,dmaxwith increasingWefurther demonstrates that the crown expansion ability in the radial direction gradually reduces.
In Fig. 15(b), we compare the experimental ¯v*cs,dmaxwith the results of the theoretical calculations by Eq. (3)(R*c,th,max/τmax). The experimental and theoretical ¯v*cs,dmaxpractically coincide,especially forWe >425. However,asWedecreases below the critical value of 425 in our database, the theoretical ¯v*cs,dmaxbecomes smaller than our experimental results. The lower theWe,the larger the difference. This agrees with the applicability conditions of Eq.(3),which works better for highWe,but deviates for lowWe.[3]
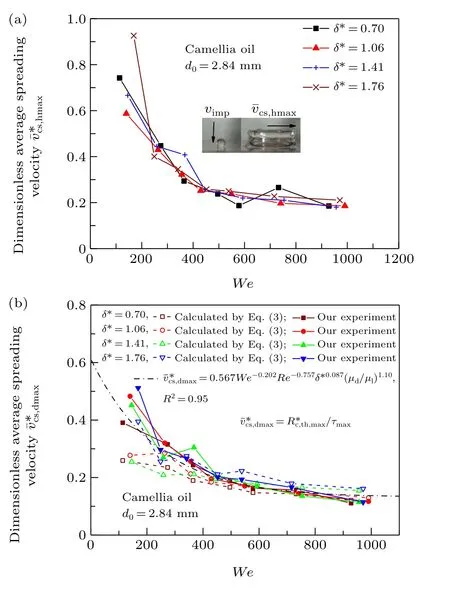
Fig. 15. Influence of We on average spreading velocity: (a) based on the crown reaching its maximum height, (b) based on the crown reaching its maximum diameter.
Sinceδ*is inversely proportional toR*c,th,maxin Eq. (3),the theoretical ¯v*cs,dmaxdecreases slightly with increasingδ*for the sameWe. However,the influence of the layer thickness on our experimental velocities is much smaller than that on the theoretical calculations(Figs.15(a)and 15(b)). This may be due to the different physical properties of the droplet and liquid layer. The theoretical model of Eq.(3)is based on the impact of a droplet on a miscible liquid layer(distilled water and 1-propanol), while the camellia oil droplet is immiscible to the water layer in our experiment. Thus, the camellia oil droplet is usually suspended on the surface of the water layer during its expansion,reducing the influence of the liquid layer thickness. Therefore, the layer thickness has little effect on¯v*cs,dmaxfor the sameWein our experimental data.
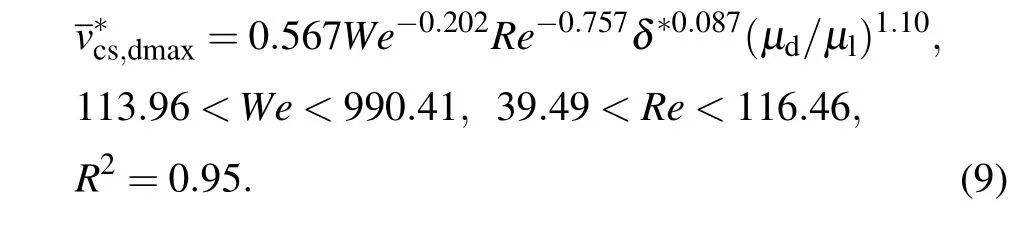
In addition, Eq. (3) (without considering the viscous effect) is rather complicated and inconvenient for engineering calculations. Therefore, a multiple linear regression is performed on our experimental results,and a more concise correlation of Eq. (9) is obtained by considering the effects of the key parameters (We,Re, thickness, and viscosity). The correlation indicates that ¯v*cs,dmaxdecreases with increasingWeorRe,while it increases with increasing viscosity ratio of the droplet to the liquid layer. As shown by other different exponents, the influence ofδ*is weak compared to that of other parameters, while the effect of the viscosity ratio is strong.The correlation of ¯v*cs,dmaxis fitted by a power-law function ofWeandRe. Similar results were also obtained by Bernard[37]and Gao[46]with different experimental conditions.
3.4.2.2. Analysis on average rising velocity
Figure 16 shows ¯v*cr,hmaxwith differentWeunder the same conditions as in Fig.15. Interestingly, ¯v*cr,hmaxremains almost constant with increasingWe. It is distributed around a value of 0.1267 for different values ofWein our experimental range.On the other hand, it is less affected by the layer thickness in addition to the isolated points, caused by the experimental uncertainties. This indicates that bothWeand layer thickness have little effect on ¯v*cr,hmax.It is worth mentioning that theWeincrease is mainly caused by the increase in the droplet impact velocity. Thus,the increase inWeinevitably results in a gradual increase in ¯vcr,hmax, while its dimensionless form ¯v*cr,hmaxremains constant. This demonstrates that the momentum ratio of the crown expansion in the vertical direction remains unchanged with increasingWe. That is, the proportion of the rising kinetic energy of the crown in the initial kinetic energy remains constant,and is independent of theWeand layer thickness.
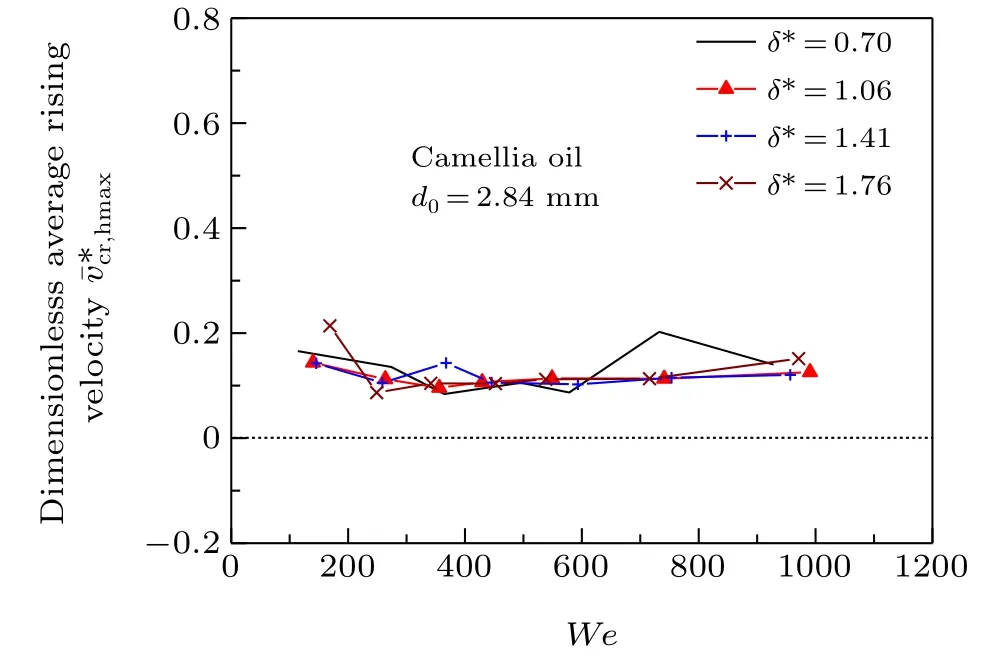
Fig.16. Influence of We on average rising velocity.
From the perspective of energy loss, both ¯v*cs,dmaxand¯v*cr,hmaxcan be also indicative of the apparent energy of crown expansion in the radical and vertical direction. AsWeincreases,the initial energy of the droplet impact increases correspondingly. Hence, the proportion of the spreading kinetic energy of the crown in the initial kinetic energy gradually decreases(Fig.15(b)),while that of the rising kinetic energy remains constant (Fig. 16). This indicates that the transfer of the kinetic energy from the droplet impact to the liquid layer gradually reduces with increasingWe. More energy will be dissipated to overcome the viscous dissipation and the action of the surface tension of the crown. In other words,the energy loss of the droplet impact gradually increases with increasingWe,in agreement with Ref.[37].
3.4.2.3. Movement of crown in radial and vertical directions
To get a deeper insight into the movement of the crown in the radial and vertical directions on its evolution, the ratioβ=¯v*cr,hmax/¯v*cs,hmaxis used in terms of reaching the maximum height of the crown. Then,βcan be considered as a ratio of the crown kinetic energy in two directions. Figure 17 showsβas a function ofWeunder the same conditions as in Fig.16.It is interesting thatβis strongly positive and linear withWe:β=0.00039×We+0.15(R2=0.96).
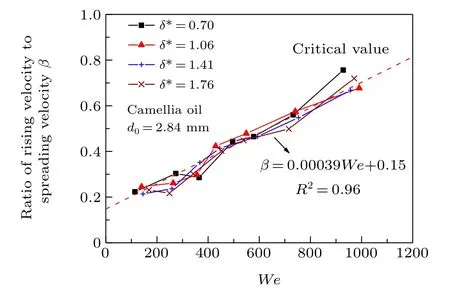
Fig.17. Influence of We on the ratio of rising velocity to spreading velocity.
The reason can be easily understood from the analysis of Subsections 3.2.4.1 and 3.2.4.3. With increasingWe, ¯v*cs,hmaxgradually decreases, while ¯v*cr,hmaxremains almost constant.Thus,βincreases with increasingWe. This further demonstrates that the movement ability of the crown in the vertical direction increases with increasingWe. Its maximum height then increases accordingly (Fig. 12). For lowerWe, the initial kinetic energy of the impact droplet is less,and it is more difficult for the crown to move upward against the gravitational potential energy. Thus,the rising velocity of the crown is smaller,and its movement mainly emerges in the radial direction.For higherWe,there is more energy for supporting the crown to move upward in addition to overcoming the actions of the viscous resistance and gravity. Therefore,its rising velocity increases with increasingWe, and its movement in the vertical direction is significantly enhanced. Interestingly,βis still less than 1 althoughWeincreases to the maximum of our experimental data. This demonstrates that the spreading kinetic energy of the crown is still larger than its rising kinetic energy,though the latter increases linearly withWe.
4. Conclusion
The evolution kinematics of a crown formed by the normal impact of a camellia oil droplet on an immiscible water layer was studied experimentally. The crown morphology and velocity were analyzed for differentWeand layer thicknesses.The obtained results agree well with the predictions of the theoretical models. Our main findings are listed as follows:
(i) The increase in the diameter of the crown is caused not only by the rising stage but also by the recession stage.Its radius follows a square-root function of evolution time until reaching its maximum diameter,which gradually increases withWe.
(ii) The rising velocity of the crown is much larger than its recession velocity. Its maximum height increases withWe, being slightly influenced by the layer thickness for lowWe. WhenWeexceeds 500, it gradually decreases with increasing layer thickness.
(iii) Dimensionless average spreading velocity, which indicates the proportion of the spreading kinetic energy in the total energy of impact, is negatively correlated withWeand exhibits a multivariate power law.Dimensionless average rising velocity,which indicates the proportion of the rising kinetic energy in the total energy of impact,is independent ofWeand layer thickness.
(iv) The ratioβincreases linearly withWe. The radial movement plays a leading role in the crown evolution at lowerWe. Its role gradually reduces withWe,while the rising movement gradually enhances. Nevertheless, the rising kinetic energy is still smaller than that of spreading in the radial direction.
The obtained results give insight into the physical mechanism of droplet impact on an immiscible liquid layer,particularly for a droplet with high viscosity and low surface tension.Our findings can be used for improving distillation or rectification processes in the petroleum industry.
Acknowledgments
The authors would like to thank Professor Wang Tao of the State Key Laboratory of Clean Energy Utilization of Zhejiang University for his help in measuring the viscosity of oil droplets in this paper. Project supported by the Natural Science Foundation of Zhejiang Province of China(Grant No.LY15E060007)and Innovation Ability Promotion of Science&Technology SMEs of Shandong Province,China(Grant No.2021TSGC1339).
杂志排行

Chinese Physics B的其它文章
- A nonlocal Boussinesq equation: Multiple-soliton solutions and symmetry analysis
- Correlation and trust mechanism-based rumor propagation model in complex social networks
- Gauss quadrature based finite temperature Lanczos method
- Experimental realization of quantum controlled teleportation of arbitrary two-qubit state via a five-qubit entangled state
- Self-error-rejecting multipartite entanglement purification for electron systems assisted by quantum-dot spins in optical microcavities
- Pseudospin symmetric solutions of the Dirac equation with the modified Rosen–Morse potential using Nikiforov–Uvarov method and supersymmetric quantum mechanics approach