Theoretical study on the transition properties of AlF
2022-05-16YunGuangZhang张云光LingLingJi吉玲玲RuCai蔡茹CongYingZhang张聪颖andJianGangXu徐建刚
Yun-Guang Zhang(张云光), Ling-Ling Ji(吉玲玲), Ru Cai(蔡茹),Cong-Ying Zhang(张聪颖), and Jian-Gang Xu(徐建刚)
School of Science,Xi’an University of Posts and Telecommunications,Xi’an 710121,China
Keywords: potential energy curve,spectroscopic constants,radiative lifetime,Franck—Condon factors
1. Introduction
Aluminum monofluoride (AlF) molecules can be produced in their gas phase at high temperatures. The physical conditions of celestial objects can be explored by studying their molecular spectra,and the results can be used as a basis to explore other astronomical phenomena. As an interstellar molecule, its radiation and spectral properties have attracted special attention from astrophysics researchers.
Experimentally,the first spectroscopic observation of the spectral range of 3180—4180 °A was performed by Yuasa.[1]The band spectrum was investigated by Rochester,[2]who discovered an absorption system at 2200—2400 °A.The emission spectra of A1Π—X1Σ+and C1Σ—A1Π were described,and the analyses were reported by Naud´e and Hugo.[3]In the same year, Rowlinson and Barrow[4]completed vibrational analyses of the A1Π—X1Σ+system at 2190—2360 °A and3Σ—3Π system at 3450—3720 °A.Subsequently,Barrow and Rowlinson[5]examined the absorption spectrum from 1250 °A to 2000 °A,found six new singlet band systems, and discovered four excited states during the emission process of transitions to the lowest excited singlet state A1Π. Naud´e and Hugo[6]studied four new band systems of the emission spectrum for D1Δ—A1Π,F1Δ—A1Π,G1Σ—A1Π,and F1Π—B1Σ and conducted vibrational and rotational analyses of the 0—0 and 0—1 bands for the D1Δ—A1Π system. Then,vibrational analyses of the three triplet systemsb3Σ—a3Π,c3Δ—a3Π, andb3Σ—a3Π were performed by Dodsworth and Barrow.[7]Naud´e and Hugo[8]performed rotational analyses of the 0—0, 0—1, 0—2, 1—3 bands of the B1Σ+↔X1∑+system, the 0—0, 1—3, 1—4 bands of the C1∏↔X1∑+system, and the accurateTevalues of the A1Π,B1Σ+,C1∏+,D1Δ states;then,they calculated the rotational and vibrational constants of the X1Σ+and B1Σ+states.Yoshimine and McLean[9]reported calculations of the total molecular energies, dissociation energies, and electric dipole moments for the ground states of AlF.The emission spectrum ofa3Π—X1Σ+was measured by Rosenwakset al.[10]Koppet al.[11]reported the rotational analysis of the A3Π—X1Σ+absorption spectra using a King furnace. Murty[12]calculated the intensity factors of the C1Σ+—A1Π transition bands of the AlF molecule,and the lines of the(0,0)band of the C—A system in sunspot spectra were suggested to be restudied. Maki and Lovas[13]measured the high-resolution diode laser spectrum of AlF and studied the transitions of AlF for the 1—0,2—1, and 3—2 bands. Hedderich and Bernath[14]extended the observation range to 5—4 bands using a Fourier transform spectrometer.
In theory,So and Richardset al.madeab initioHartree—Fock calculations toward some states of AlF, such as X1Σ+,A1Π, D1Δ etc.[15]Murty[12]discussed the calculation of FC factors, which are crucial to the exploration of the electronic transition moment. Joshiet al.[16]evaluated the Franck—Condon factors (FCFs) of the A—X system. Klein and Rosmus[17]calculated the electric dipole moment functions and radiative transition probabilities of the X1Σ+states of AlF using highly correlated coupled electron pair approximation(CEPA)electronic wave functions. Hirst[18]presented the PECs of the AlF relative to ground-state atoms. Langhoffetal.[19]studied the PECs of X1Σ+and A1Π of AlF and obtained the precise spectrum constants of the lowest six singlets and the lowest five triplet states of AlF.The radiative lifetimes of the excited states and Einstein coefficients of the A1Π—X1Σ+transition were also computed. Kumaret al.[20]evaluated the FCFs andr-centroids using a numerical integration procedure for the systems of B1Σ+—X1Σ+, C1Σ+—X1Σ+,c3Σ+—b3Σ+,f3Π—b3Σ+, F1Π—B1Σ+, and G1Σ+—B1Σ+, which made the results more convincing. They also reported the FCFs andr-centroids for the states of D1Δ, E1Π, F1Π, and the G1Σ+—A1Π transition system of the AlF molecule in the same year.Luoet al.[21]calculated the PECs and the values ofRe,De,ωe,ωeχe,Be, andαeof the X1Σ+, A1Π, and B1Σ+states using the SAC/D95(d) method. Zhaoet al.[22]calculated the PECs,molecular parameters,and spectroscopic properties of the X1Σ+state according to coupled-cluster method with single, double, and perturbative triple excitations [CCSD(T)]and Quadratic configuration interaction with single, double,and perturbative triple substitutions [QCISD(T)]. Using the MRCI method,Wells and Lane[23]studied the PECs and spectroscopic constants of the X1Σ+,a3Π, A1Π,b3Σ+, B1Σ+,c3Σ+,C1Σ+states and the permanent dipole moments(PDMs)of the X1Σ+state. With these PECs, they computed the FCFs of the A1Π↔X1Σ+anda3Π—X1Σ+transitions. Balachandrakumaret al.[24]evaluated the FCFs andr-centroid of the C1Σ+—A1Σ+,b3Σ+—a3Πr,c3Σ—a3Πr, andf3Π—a3Πrband systems by applying a numerical integration procedure with suitable potential energy curves. Yousefiand Bernath[25]prepared vibration-rotation line lists of the ground electronic states(X1Σ+)for AlF.The potential energy surface(PES)was calculated by direct potential fitting using the rotational and rotational vibration lines of the experiment.The ro-vibrational energy levels were studied with PES.
Herein, we calculated the PECs of the X1Σ+and A1Π states of the AlF molecule applying the complete active space self-consistent field (CASSCF) method and the MRCI approach while simultaneously considering the Davidson correction and the scalar relativity correction of the third-order DKH Hamiltonian approximation. We will briefly introduce the methodologies in our work. The PECs of the X1Σ+and A1Π states and the TDMs of the A1Π↔X1Σ+transition are shown in Section 3.By combining PECs and TDMs,we determined the FCFs, vibrational levels and all spontaneous emission Einstein coefficients.We also computed the radiative lifetimes of the vibrational levels of the A1Π state. Finally, the important contents of this work are summarized. The obtained spectroscopic constants,vibrational levels and Einstein coefficients are convincing and can supply available information to measure emissions,such as those in stellar atmospheres.
2. Theory and method
The ground states of the Al and F atoms are3Puand3Pu, respectively. The first dissociation asymptote of the AlF molecule is3Pu+3Pu,where the X1Σ+and A1Π states belong to the dissociation channel. All calculations are completed in the MOLPRO 2015 package[26]in the point group. Herein,the CASSCF[27,28]is used as the reference wave function for the MRCI calculation. The AWCV5Z basis set was chosen for which it can well consider core—valence correlation effect,we studied the PECs of the two states. The calculation method of TDMs is identical.
Because of the limitation of the MOLPRO program, the symmetry of the subgroup in the point group was used in our calculations. The symmetry contains four irreducible representations: a1, b1, b2,and a2. While a1produces the Σ+state and a component of the Δ state, b1and b2supply the Π state; a2generates the Σ-state and the other components of the Δ state. For the calculation of CASSCF,eight molecular orbitals (MOs) are opted as an active space(5σ6σ2πx2πy7σ3πx3πy8σ), including the 3s23p1shell of Al and 2s22p5shell of F. The other ten electrons are distributed in the active space of a(4,2,2,0),while the 1s22s22p6orbital of aluminum is a closed-shell orbit and occupies double space.In the process of MRCI+Q,[29—31]there are 22 electrons in total during the relevant energy calculations. We selected the AWCV5Z basis set for calculations. At the same time, the scalar relativistic effect is considered through the third-order DKH Hamiltonian calculation.
The PECs were reported in previous work[23]with the CASSCF method and the MRCI+Q approach,and the AVQZ basis set was selected. The molecular orbitals (MOs) to calculate MRCI are derived from the CASSCF results. In this paper, with the AWCV5Z basis set, the eight outermost(4a1,2b1,2b2,and 0a2)MOs are put into the active space. AlF has 22 electrons in total,and 10 valence electrons are divided into eight valence MOs. Therefore, the active space can be represented as CAS(10,8).The remaining 12 inner electrons in the AlF radical are placed in the six lowest MOs (4a1, 1b1, 1b2,and 0a2). In total,384 external MOs(138a1,94b1,94b2,and 58a2)are obtained by the MRCI calculation of PECs using the AWCV5Z basis set.
The Einstein spontaneous emission coefficientAν′ν′′ from the initial level(ν′,J′)to the final level(ν′′,J′′)can be calculated by the following formula:[32]

Since the upper and lower vibrational levels can be expressed asν′andν′′,the total transition probability of a certain upper levelν′is gained by summing the Einstein coefficients of emissions from this upper level to all possible lower vibrational levels. The radiative lifetime of a certain upper level is determined as the reciprocal of the total transition probability,i.e.,

The PECs of AlF are studied over internuclear distances of 0.8—6.8 °A. To make the results more convincing, the interval value is shortened to 0.01 °A around the equilibrium bond distance. Depending on the acquired PECs, we obtain the spectroscopic constants of the individual electronic states by solving the Schr¨odinger equation using the LEVEL 8.2 program,[32]which involves the equilibrium internuclear distance (Re), harmonic frequency (ωe), first anharmonicities(ωeχe),rotational constants(Be),depth well(De)and adiabatic relative electronic energy associated with the ground state(Te).
3. Results and discussion
In this section, we first explored the PECs and spectroscopic constants of the two states through the MRCI+Q approach with the AWCV5Z basis set. Second,based on the calculated potential energy curve, the vibrational energy levels and rotational constants of the two electronic states are calculated using the level 8.2 program.[32]The transition properties are eventually studied,including PDMs,TDMs,FCFs,and radiative lifetimes. We also computed the line intensities.
3.1. PECs and spectroscopic parameters
Using the MRCI+Q approach,we selected the AWCV5Z basis set to calculate PECs and obtained the spectral constants of the two states. The PECs of the X1Σ+and A1Π states are shown in Fig. 1. The dissociation limit of the two states is Al(3Pu)+F(3Pu),and the internuclear distance corresponding to PECs is 0.8—6.8 °A. In addition, Table 1 lists the spectrum parameters and available experimental values of the X1Σ+and A1Π states. For convenience, only some experimental[14,33]and theoretical[25]spectroscopic constants are listed for comparison.
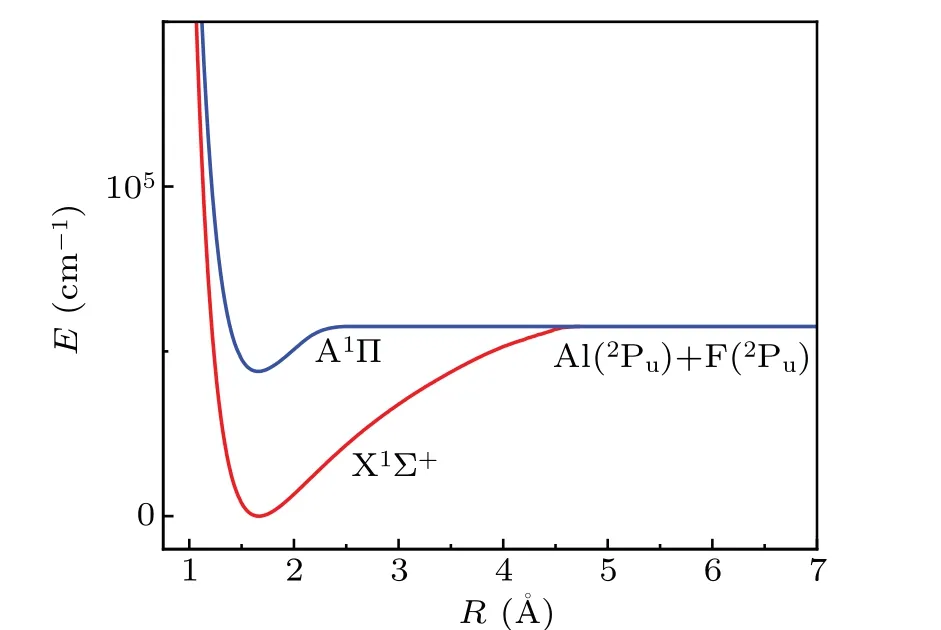
Fig.1. PECs of the X1Σ+ and A1Π states.

Table 1. Spectroscopic constants of the X1Σ+ and A1Π states.
There is a potential well depth of 56745.9669 cm-1in the X1Σ+state and 12830.7917 cm-1in the A1Π state. Moreover,the equilibrium distanceRebetween the two states is very small. According to Table 1, we calculated the spectroscopic constants of the two bound states of AlF via the AWCV5Z basis and selected the MRCI+Q level method. The previously obtained theoretical methods[25]and experimental[14,33]results are also listed for comparison. In terms of the ground state X1Σ+, the calculated value ofReis 1.6644 °A, which is 0.01 °A different from the value of 1.6544 °A,with a percentage error of only 0.6008%.[14,33]The acquired dissociation energyDeis 7.0357 eV,and the dissociation energy has no comparable value. Our calculatedBevalue is slightly smaller than the experimental result recorded by Huberet al.[33]However,our values have a relatively large error compared with the calculation results of Yousefiand Bernath.[25]
For the A1Π state, the equilibrium distanceReis 1.6579 °A, as reported by us, which is only 0.0094 °A different from the experimental value.[33]Comparing the values ofTe,ωe,andBeto the results of the experimental values,we observe that the percentage errors are only 0.0775%, 0.0385%,and 1.1453%, respectively. Obviously, our values are close to the experimental results[33]and consistent with previous studies.[23]Overall, the acquired spectroscopic constants for the X1Σ+and A1Π states of the AlF molecule are consistent with the experimental results and other available theoretical results.
According to the calculated PECs, the LEVEL 8.2 program was used to calculate the vibrational levels of the X1Σ+and A1Π states. The digits of the vibrational levels of the X1Σ+and A1Π states are 135 and 21, respectively(Table 2).Langhoffet al.[19]calculated the first nine vibrational energy levels of the X1Σ+state and the A1Π state,and the results are also listed in Table 2. Compared with it,the difference of state X1Σ+is only 0.17%—0.44%; the difference of state A1Π is 2.42%—4.41%. Balachandrakumaret al.[24]reported the first eight vibrational energy levels of state A1Π, and their results differed by less than 1%from our calculations. Obviously,our results are close to other available theoretical results.
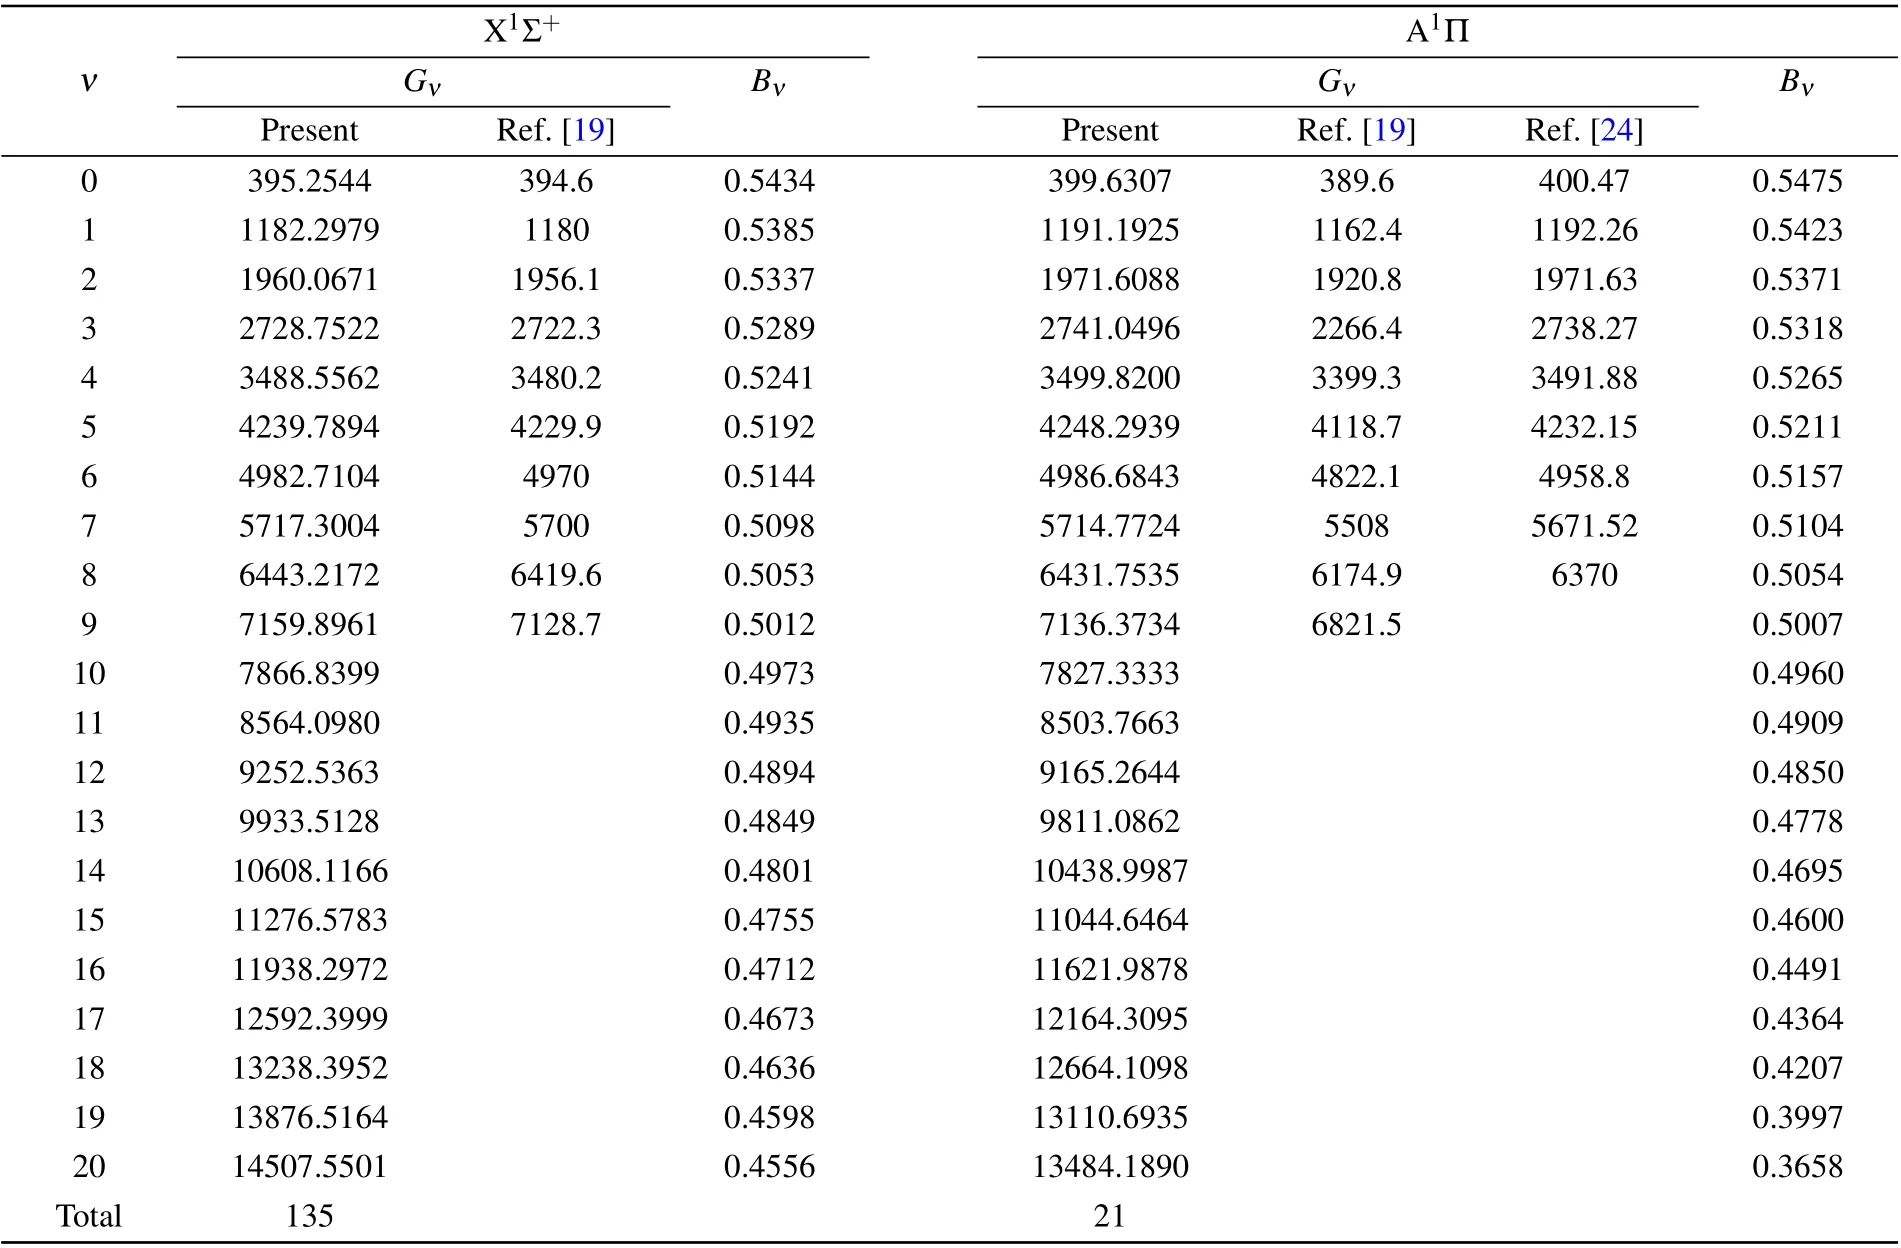
Table 2. Vibrational levels(cm-1)of the X1Σ+ and A1Π states.
3.2. PDMs and TDMs
The PDMs of the two states are explored with the changes in internuclear distanceRat the level of MRCI+Q. The internuclear distanceRof the PDMs is 1.0—6.8 °A. The PDMs of the X1Σ+and A1Π states atReare-0.42476308 a.u.and-0.58900765 a.u., respectively. The PDM curves of the ground state and low excited state have approximately identical trends (Fig. 2). The PDM function of the A1Π state rapidly decreases from the highest value of 0.3073363 a.u. to the lowest value of-0.86346557 a.u. and eventually close to zero. The PDM function of the X1Σ+state has a maximum value of 0.51201672 a.u. at 1.0 °A,falls to the minimum value of-3.15460982 a.u. at 3.3 °A,and finally becomes zero.The PDMs of the X1Σ+state have a very deep potential well,which is much deeper than the state of A1Π.
The TDMs of the A1Π↔X1Σ+transition are very close to the results of previous reports.[23]The TMD unit is distinct from the one in the previous study.[23]X1Σ+and A1Π states have many vibrational states. As shown in Fig. 3, the internuclear distanceRof TDMs is also 1.0—6.8 °A.The TDM function of the transition gradually decreases from the highest 1.9683034 a.u. at 1.0 °A to zero. The TDMs of the A1Π↔X1Σ+transition is 1.76300482 a.u. atReof the X1Σ+state. Furthermore, the TDMs tend to zero when the internuclear distanceReis approximately 4.0 °A, which is caused by the orbit-forbidden transition.
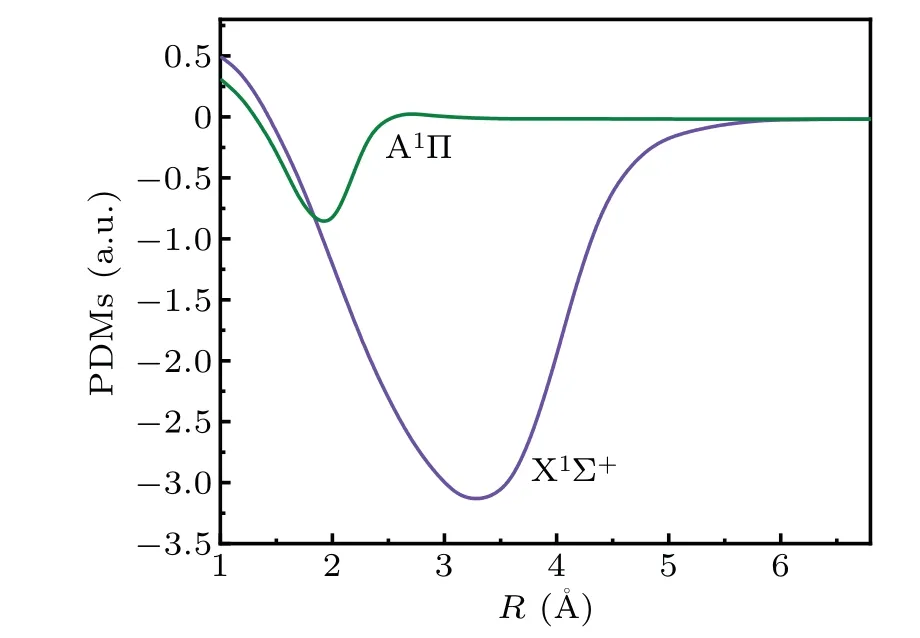
Fig.2. PDMs of the X1Σ+ and A1Π states.
The leading electronic transition between A1Π and X1Σ+states is the 7σ2—7σ3πpromotion. According to Fig. 3, the TDMs of the A1Π↔X1Σ+transition are large near the internuclear equilibrium separations of the A1Π and X1Σ+states.In addition,Reof the A1Π state is 1.6579 °A, andReof the X1Σ+is 1.6644 °A.Obviously,the difference between them is small. Moreover, the two states have similar PECs, and both states have deep wells. Combining with the obtained calculations,we can speculate that the emissions of the A1Π↔X1Σ+system should be substantial, and some of these emissions should be very intense based on the FC principle.
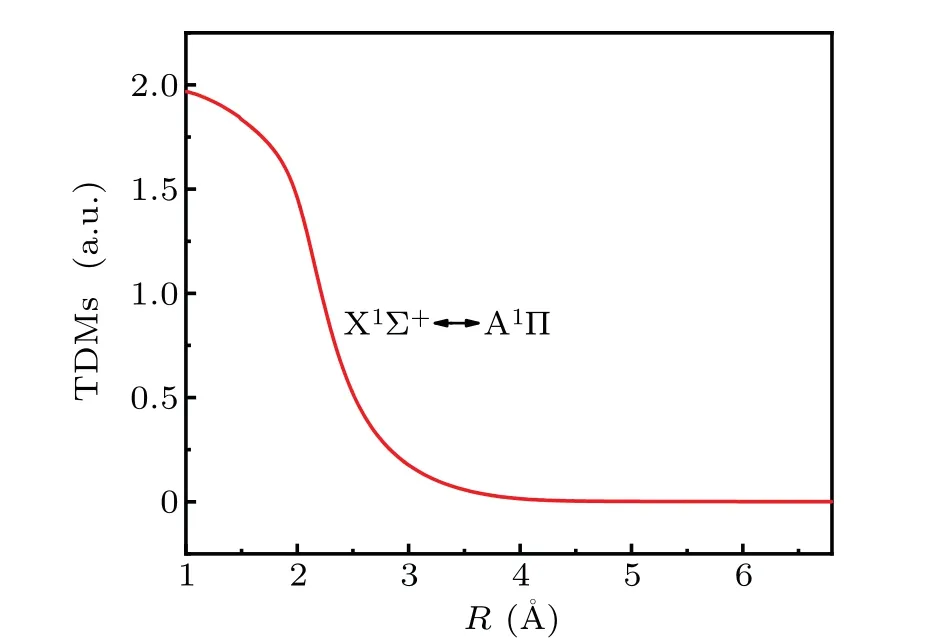
Fig.3. TDMs for A1Π ↔X1Σ+.
3.3. Einstein coefficients and radiative lifetimes of A1Π ↔X1Σ+
Using the LEVEL 8.2 program, we calculated the FCFs and Einstein coefficients (vibrational transition probabilities)for the A1Π↔X1Σ+system in combination with the TDM function. To more clearly analyze problems, we collected several large Einstein coefficients and their FCFs, as shown in Table 3. Joshiet al.[16]evaluated the FCFs of the A1Π(ν′=0-5)↔X1Σ+(ν′′=0-5) transition. After comparison, the difference is very small, such as the percentage difference of 0—0,1—1,2—2 and other bands is less than 0.3%,and most of the results are less than 2.6%.

Table 3. FCFs(1st line)and Einstein coefficients(s-1,2nd line)of emissions for the A1Π ↔X1Σ+ system.
Obviously,the larger Einstein coefficients are mainly concentrated in the Frank—Condon region with a maximum value of 5.2805×10⁸s-1(Table 3),which corresponds to the strong transitionν′=0→ν′′=0. For the emissions from the states of A1Π(ν′=0-9) to X1Σ+(ν′′=0-12), the largest Einstein coefficient is 5.293×10⁸s-1, as studied by Langhoffet al.,[19]which is consistent with our value, and the error is only 0.237%. In this study, the obtained Einstein coefficients are compared with those given by Langhoffet al.,[19]It can be seen that the results in the Frank—Condon region are basically the same, the difference is 0.18%—5.6%, but the results in other bands are quite different. This may be due to different choices of the calculation method and basis set.
Based on the obtained Einstein coefficients,we computed the radiative lifetimes of all vibrational levels of A1Π. In this work, all Einstein coefficients are used for radiative lifetime calculations. For the convenience of discussion,the results are listed in Table 4. As observed from the list, the spontaneous radiative lifetimes of all vibrational levels are approximately 10-9s. Our results are consistent with those of Langhoffet al.,[19]and the radiative lifetimes increase with increasing vibration levels. Based on the available results,all radiative lifetimes of the A1Π states are short,which implies that the radiation of the A1Π↔X1Σ+system should be stable.

Table 4. Radiative lifetimes (ns) for the vibrational levels (ν′ =0—15 of the A1Π state.
The relationship between the wavenumber and the absolute line intensities of A1Π↔X1Σ+is shown in Fig. 4. The line intensities of the A1Π(ν′= 4-15)↔X1Σ+(ν′′= 0)transitions are calculated according to Einstein coefficients.For the transition, the calculated results are classified into R and P branches up to at 296 K. Because the order of the magnitude ofν′= 0→ν′′= 0 band transitions is larger than those of other bands, the trend of the absolute line intensities and the wavenumber cannot be seen in the plot.In terms of the transition bands ofν′′= 0→ν′= 4—15,the absolute line intensities first increase and subsequently decrease with the wavenumber (Fig. 4). In fact, for the bands ofν′′= 0→ν′= 0—15, the wavenumber is first at 43918.4624 cm-1(P(1)) with the maximum line intensity of 9.8572×10⁻¹⁷cm-1/(molecule·cm-2), and it decreases to the minimum value at the band ofν′′=0→ν′=0—4. The wavenumber is at 46998.2962 cm-1(P(16)) with the line intensity of 3.3014×10⁻²⁷cm-1/(molecule·cm-2); then,the transition intensity increases to theν′′= 0→ν′= 5 band. The wavenumber is at 47767.1191 cm-1(P(1)) with the line intensity of 3.5462×10⁻²⁶cm-1/(molecule·cm-2),subsequently decreases to the minimum value at the band ofν′′= 0→ ν′= 6 with the intensity of 2.6996×10⁻²⁸cm-1/(molecule·cm-2) and slightly rises to the maximum value at the band ofν′′= 0→ν′= 9. The wavenumber is at 50655.2122 cm-1(P(1)) with the line intensity of 9.4111×10⁻²⁷cm-1/(molecule·cm-2) and finally decreases. The results show that the band ofν′′=0→ν′=0 is the strongest excitation for the A1Π↔X1Σ+system. The maximum line intensity is located in the 0—0 band, and the line intensity is 9.8572×10⁻¹⁷cm-1/(molecule·cm-2) at 47767.1191 cm-1(P(1)).

Fig.4. Absolute intensities of the ν′′=0 →ν′=4-15 transition bands of the A1Π ↔X1Σ+ system.
4. Conclusions
In general, according to the CASSCF/MRCI+Q approach and (4,2,2,0) active space, we have theoretically calculated the PECs, spectroscopic constants, PDMs, TDMs,and vibrational levels of the X1Σ+and A1Π states of AlF. Also, we have computed the line intensities of the A1Π(ν′=4-15)↔X1Σ+(ν′′= 0) transitions. The maximum line intensity is located in the 0—0 band, and the line intensity is 9.8572×10⁻¹⁷cm-1/(molecule·cm-2)with a position of 47767.1191 cm-1(P(1)). The spectroscopic constants of the X1Σ+and A1Π states can be acquired by solving the radial Schr¨odinger equation using the LEVEL 8.2 program. In contrast, our results are very close to the previous results.[14,33]According to these achieved values, we obtain the FCFs (f00=0.9949) of the A1Π↔X1Σ+transition. In addition, for the X1Σ+(ν′=0)↔A1Π(ν′′=0) system, the emission is strong,and the strong radiation spectrum is mainly concentrated in the ultraviolet range.The radiative lifetimes of the vibrational levels of the A1Π state are approximately. Furthermore,the lifetime is short for the lower vibrational levels,but it rapidly increases with the increase in vibrational levels.
Acknowledgements
This work was supported by the National Natural Science Foundation of China (Grant No. 11947127) and the Shaanxi Natural Science Foundation,China(Grant No.2018JM1053).
杂志排行

Chinese Physics B的其它文章
- A nonlocal Boussinesq equation: Multiple-soliton solutions and symmetry analysis
- Correlation and trust mechanism-based rumor propagation model in complex social networks
- Gauss quadrature based finite temperature Lanczos method
- Experimental realization of quantum controlled teleportation of arbitrary two-qubit state via a five-qubit entangled state
- Self-error-rejecting multipartite entanglement purification for electron systems assisted by quantum-dot spins in optical microcavities
- Pseudospin symmetric solutions of the Dirac equation with the modified Rosen–Morse potential using Nikiforov–Uvarov method and supersymmetric quantum mechanics approach