Effect of the number of defect particles on the structure and dispersion relation of a two-dimensional dust lattice system
2022-03-12RangyueZhang张壤月GuannanShi史冠男HanyuTang唐瀚宇YangLiu刘阳YanhongLiu刘艳红andFengHuang黄峰
Rangyue Zhang(张壤月) Guannan Shi(史冠男) Hanyu Tang(唐瀚宇)Yang Liu(刘阳) Yanhong Liu(刘艳红) and Feng Huang(黄峰)
1College of Science,China Agricultural University,Beijing 100083,China
2College of Information and Electrical Engineering,China Agricultural University,Beijing 100083,China
3School of Physics and Optoelectronic Engineering,Ludong University,Yantai 264025,China
Keywords: complex plasma,molecular dynamics(MD)simulation,defect particles,dust lattice wave
1. Introduction
Dusty plasma allows us to study the basic properties of plasma at the level of“atomic”dynamics and allows the visualization of collective plasma behavior, such as the Coulomb lattice and fluctuations.[1-5]The formation of Coulomb lattice is of great significance to study the structure,dynamic properties and phase transition of condensed matter,[6-9]thus it can be used as an ideal simulation system of a condensed matter system. The propagating waves in a dust lattice can effectively show the structure and properties of the lattice,so more and more attention has been paid to the study of dust lattice waves.[10-15]
2. Method of molecular dynamics simulation

3. Simulation results and discussion
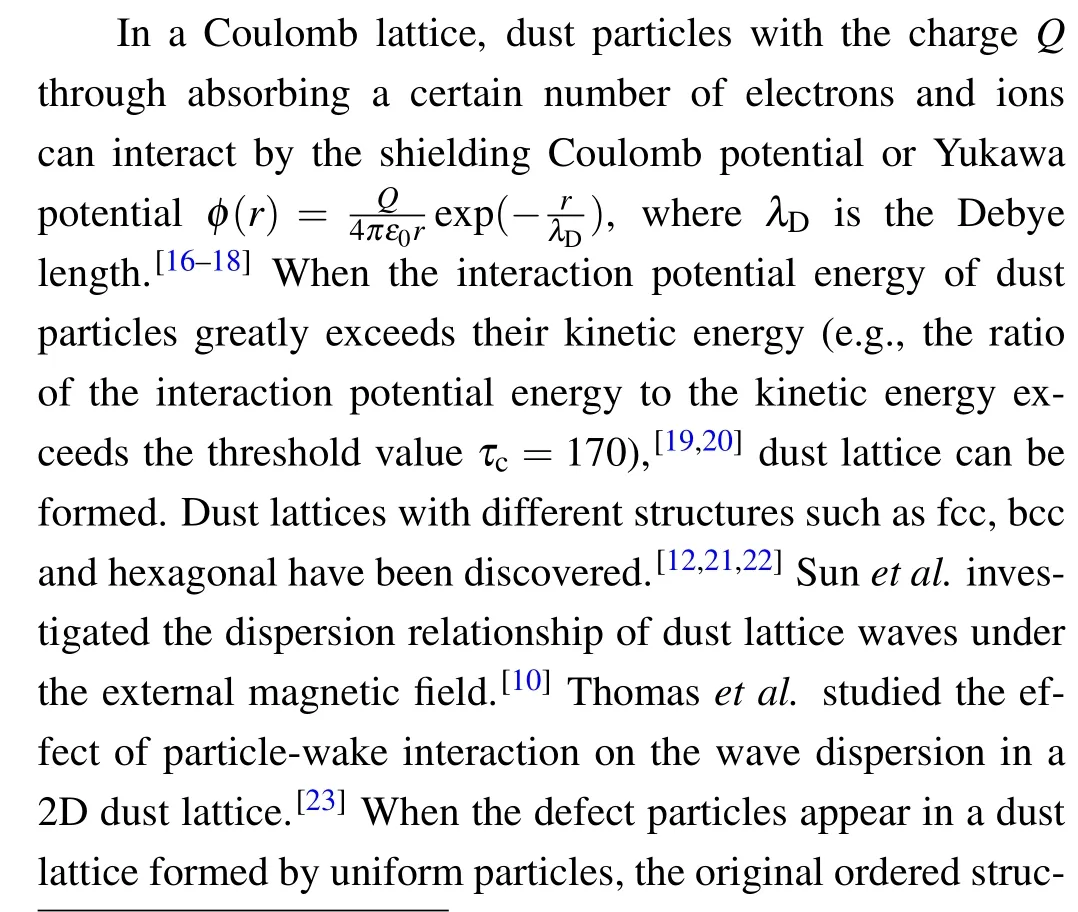
Figure 1(a)shows the distribution of defect particles after the system is in the stable state. The coordinate axis diagram in the lower right corner shows the coordinate system and direction,andθrepresents the angle between the wave number and the primitive translation vector (in thexaxis direction).To highlight the defect particles, the white points with larger size are used to represent defect particles,while ordinary dust particles are denoted by the white points with normal size.Figure 1(b) shows the nearest neighbor configuration of the system with different defect numbers. As can be seen, when the defect numberNDis 1, the system mainly maintains the hexagonal lattice structure. As the number of defect particles increases, the hexagonal lattice structure surrounding the defect particle is destroyed due to the effect of these defect particles. This is in an agreement with the result[29]that particles with different masses and charges have the different thermal equilibrium in a binary system, which can cause the destruction of the ordered structures.
Fig.1. (a)Distribution of defect particles and(b)the nearest neighbor configuration of particles after the system is in the stable state.
Pair correlation functiong(r) is the measurement of the relative probability of finding a particle at a distancerfrom the reference particle,which can be used to investigate the lattice structure characteristics. Figure 2 shows theg(r) curve of the system and the first peak valueg1p(r)of theg(r)curve changing as the number of defect particles. From Fig. 2(a),it can be seen that with increasing the number of defect particles, the peaks of theg(r) curve gradually become weaken,meaning that the order structure of the dust lattice is weakened. From Fig.2(a),it can also be seen that the double-peak structure in the second peak of theg(r)curve becomes less and less obvious with the increase ofND,indicating that the particle arrangement gradually becomes disordered. From theg(r)curve, the first peak position (shown by the dashed line) and the peak intensity with the different number of defect particles can be obtained. It can be seen that the number of defect particles does not obviously affect the position of the first peak ofg(r),but affect the intensity of the first peak. It indicates that a small number of defect particles(ND=1-23)in the system composed of 400 particles affect the local structure of the system,but from the overall average of the system,the small number of defects does not affect the first peak position of theg(r)curve. The relationship between the first peak intensityg1p(r)andNDis obtained,which is shown in Fig.2(b). Through the fitting line ofg1p(r)-ND(in Fig. 2(b)), one can see that with the increase ofND, the peak value ofg1p(r) significantly decreases,indicating the probability of finding the dust particles at the average interparticle distance from a reference particle gradually decreases asND.
In the 2D hexagonal lattice, longitudinal and transverse waves can propagate in an arbitrary direction,denoted by the angleθ(in Fig.1(a)). Two independent directions are defined,that is, parallel or horizontal direction (θ=0) and perpendicular or vertical direction(θ=π/2)to primitive translation vector.[30]Figure 3 shows the current autocorrelation functionsCl,t(q,ω) of longitudinal and transverse waves in horizontal and vertical directions when the number of defect particles is 0,7,16 and 23.From Fig.3,one can see that the current autocorrelation functions with the number of defect particles of 0(a1)-(d1),7(a2)-(d2),16(a3)-(d3)and 23(a4)-(d4)are mainly different in the case of transverse waves. WhenNDis 0 and 7, theCl,t(q,ω) with a single peak are dominated in both longitudinal and transverse current autocorrelation functions.However,whenNDis increased to 16,it can be seen that the spectra of the transverse current autocorrelation functions(i.e., theCt(q,ω) curves) are significantly more affected by the defect particles than those of longitudinal waves (i.e., theCl(q,ω)curves),that is,theCl(q,ω)curves are still dominated by a single peak, while theCt(q,ω) curves mainly show two separated peaks and some of which are with double peaks. In addition, it can be seen that the peaks in theCl,t(q,ω)curves ofND=23 are more disorder than those ofND=16.
In Fig. 4, the dispersion relations of longitudinal and transverse waves along horizontal and vertical directions withNDbeing 0, 7 and 16 are shown. It can be seen that for the threeNDvalues the dispersion relations of longitudinal waves in parallel or vertical direction are very close, while for the transverse waves in parallel and vertical direction the dispersion relations show different characteristics. For example,the almost coincident values ofω-qforND=0 and 7 indicate that the dispersion relation is not greatly affected when the number of defect particles is very small. WhenNDis 16, the dispersion relationsω(t,0) andω(t,π/2) of the transverse waves both in parallel and vertical direction show two branches,with one branch nearly coincident with that ofND=0 and 7 and another branch with higher frequencies. The occurrence of the branch with higher frequencies may be related to the coupling of defect particles participation. It is probably because in this simulation the initially uniformly distributed defect particles with larger charges cause the stronger interaction between defect particles and the surrounding normal particles resulting in the appearance of high frequency collective mode. When the number of defect particles is increased to a certain value, the enhanced collective mode of defect particle participation can be observed in the transverse waves.
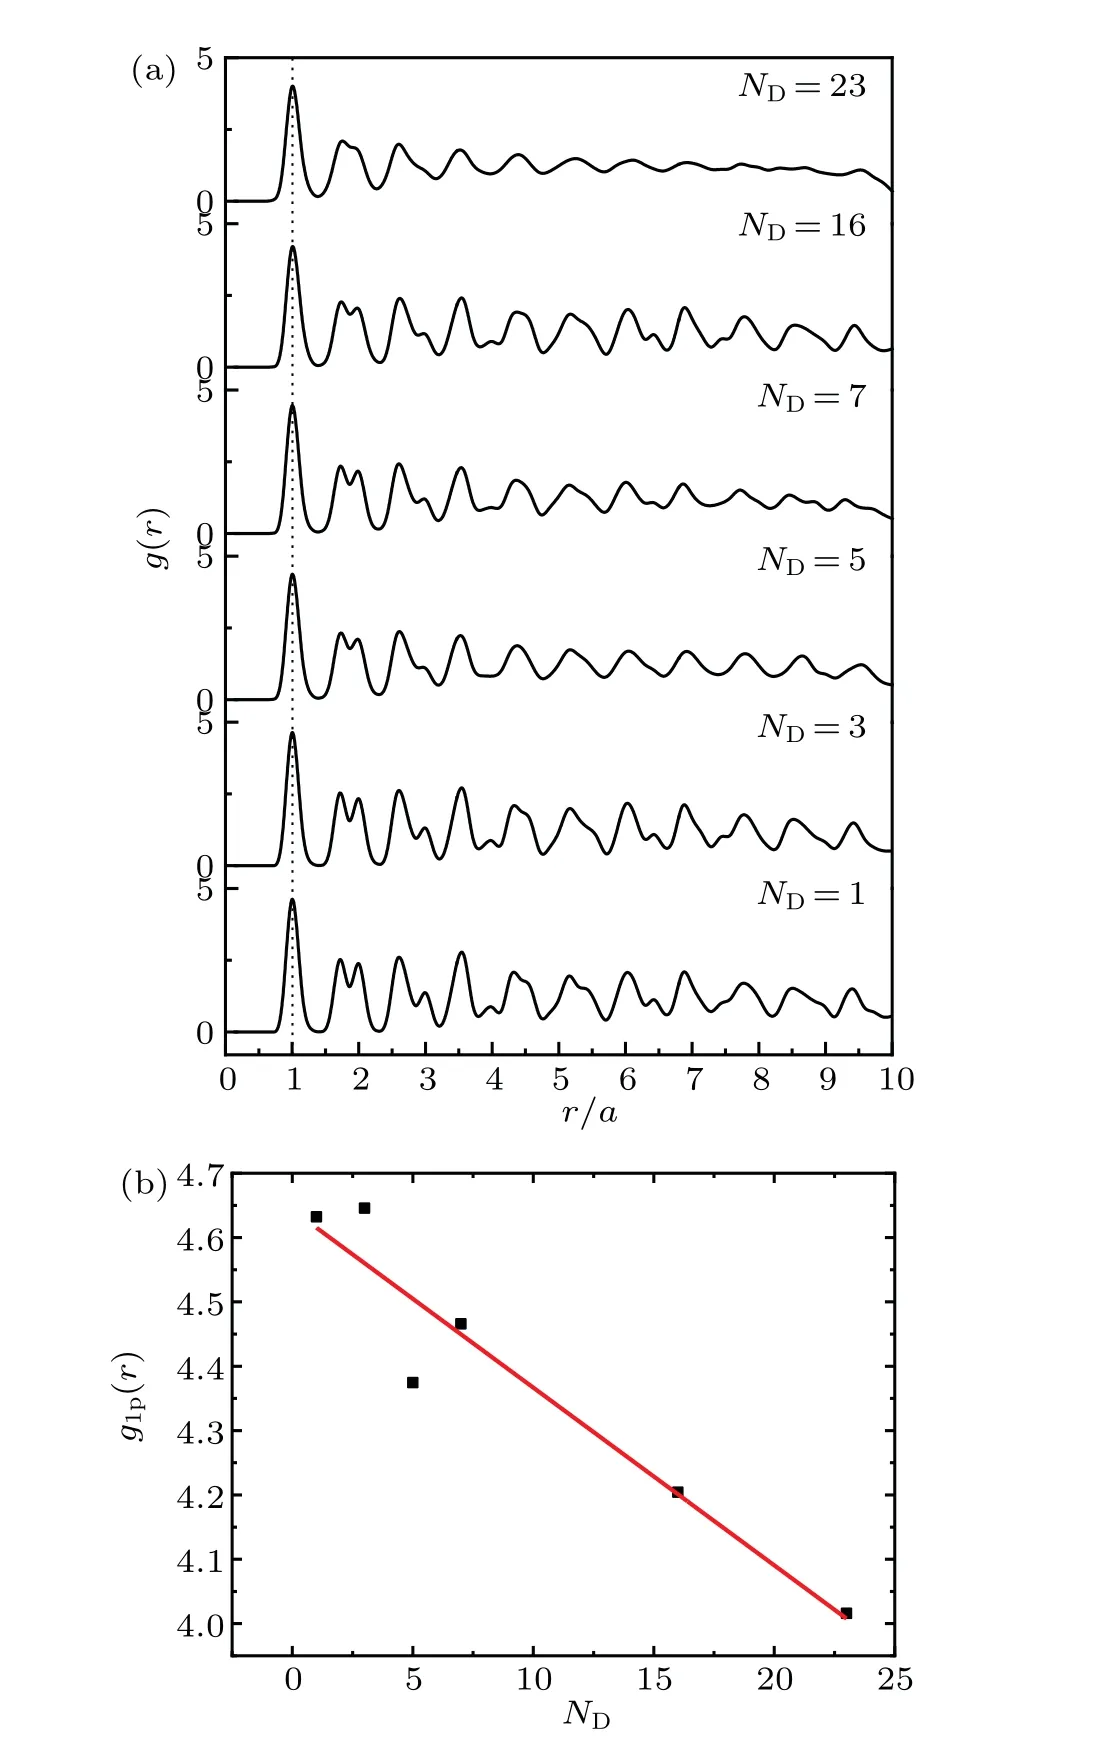
Fig.2. (a)Pair correlation function g(r)of the system with the different number of defect particles; (b) the relationship between the first peak value of g(r)and the number of defect particles.


Fig.3. The wave spectra of the longitudinal and transverse current autocorrelation functions Cl(q,ω)and Ct(q,ω)in horizontal(θ =0)and vertical (θ =π/2) directions under different defect numbers, (a1)-(a4)Cl(q, ω), θ =0; (b1)-(b4)Cl(q, ω), θ =π/2; (c1)-(c4)Ct(q, ω),θ =0;(d1)-(d4)Ct(q,ω),θ =π/2. (a1)-(d1)ND=0,(a2)-(d2)ND=7,(a3)-(d3)ND=16,(a4)-(d4)ND=23. The waves number q varies from 0.314 to 5.966.

Fig. 4. Dispersion relations of longitudinal and transverse waves in parallel and perpendicular directions under different numbers of defect particles: (a) ω(l,0), the longitudinal wave along parallel direction (θ =0); (b) ω(t,0) the transverse wave in parallel direction; (c)ω(l,π/2), the longitudinal wave along perpendicular direction (θ =π/2);(d)ω(t,π/2),the transverse wave along perpendicular direction(θ =π/2).
For a more obvious comparison, the dispersion relations of longitudinal and transverse waves withND=16 are shown in Fig. 5. It shows that in parallel direction the higher frequency branch of the transverse waveω(t,0)almost coincides with the longitudinal waveω(l,0). The similar feature was also found in the perpendicular direction, that is, the higher frequency branch of the transverse waveω(t,π/2)almost coincides with the longitudinal waveω(l,π/2). It shows that the appearance of the branches of higher frequencies reduces the difference of dispersion relation of waves in different directions. That is, appropriately adding defect particles can weaken the anisotropy of such a hexagonal lattice.
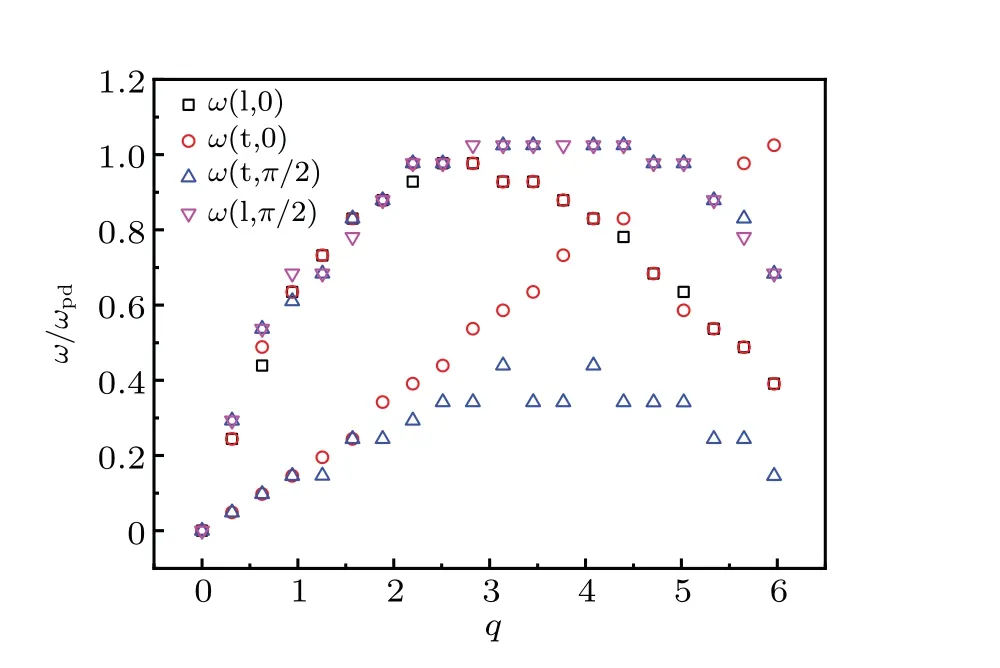
Fig. 5. Dispersion relations of the longitudinal and transverse waves with ND=16 in parallel and perpendicular directions.
The sound speedsCsof the longitudinal and transverse waves are also calculated from the dispersion relations in the limitq →0.[30,31]From the calculation (ND= 0-16), it is known that for the dust lattice without defect particle, the sound speeds of the longitudinal waves are obviously larger than those of the transverse waves, and meanwhile when the number of defect particles is very small(ND≤7)the according sound speed is very close to the lattice without defect particles (ND=0) in different directions withCs(l,0)=0.868,Cs(l,π/2)=0.849,Cs(t,0)=0.132, andCs(t,π/2)=0.116,showing the anisotropy characteristics of the dust lattice. As the number of defect particles gradually increases,the change of dispersion relation will accordingly cause the change of sound speed. For example, whenNDis 16, although the longitudinal sound speeds are close to those ofND=0 and 7, while the transverse dispersion relations show two sound speed values, i.e., in addition to the original lower sound speed values (close to those ofND= 0 and 7), the higher sound speeds appear in two directions withCs(t,0)=0.863 andCs(t,π/2)=0.896,which are close to those of the longitudinal waves. These indicate the anisotropic property of such a hexagonal dust lattice becomes weaker when the number of defect particles increases to a certain value.
4. Conclusions
The effects of the number of defect particles on the 2D dust lattice structure and dispersion relation are investigated.Particle distribution, the nearest neighbor configuration and pair correlation function are used to show the lattice structure characteristics. The current autocorrelation function, the dispersion relation and sound speed are used to represent the wave properties.It shows that as the increase of the defect particle number,the order of the lattice structure becomes weaker,the current autocorrelation functions and the dispersion relations of the transverse and longitudinal waves in parallel and perpendicular directions show different characteristics. The presence of defect particles has a greater effect on the transverse waves than on the longitudinal waves of the dust lattice. When the number of defect particles increases to a certain value,a higher frequency branch appears in the dispersion relations of the transverse waves. The results of dispersion relation and sound speed show the anisotropy property of such a dust lattice and the appearance of defect particles in the lattice can weaken the anisotropy property of the lattice.
Acknowledgement
Project supported by the National Natural Science Foundation of China(Grant Nos.12075315 and 11675261).
杂志排行

Chinese Physics B的其它文章
- Measurements of the 107Ag neutron capture cross sections with pulse height weighting technique at the CSNS Back-n facility
- Measuring Loschmidt echo via Floquet engineering in superconducting circuits
- Electronic structure and spin-orbit coupling in ternary transition metal chalcogenides Cu2TlX2(X =Se,Te)
- Characterization of the N-polar GaN film grown on C-plane sapphire and misoriented C-plane sapphire substrates by MOCVD
- Review on typical applications and computational optimizations based on semiclassical methods in strong-field physics
- Quantum partial least squares regression algorithm for multiple correlation problem