Wire network behavior of superconducting films with lower symmetrical mesoscopic hole arrays
2022-03-12WeiGuiGuo郭伟贵ZiXiPei裴子玺andXiangGangQiu邱祥冈
Wei-Gui Guo(郭伟贵) Zi-Xi Pei(裴子玺) and Xiang-Gang Qiu(邱祥冈)
1Beijing National Laboratory for Condensed Matter Physics,Institute of Physics,Chinese Academy of Sciences,Beijing 100190,China
2School of Physical Sciences,University of Chinese Academy of Sciences,Beijing 100049,China
3Collaborative Innovation Center of Quantum Matter,Beijing 100084,China
Keywords: fluxoid quantization,wire network,matching effect
1. Introduction
Superconducting films with periodic artificial pinning sites have been investigated for decades[1-8]since it provides a potential platform for realizing specilized quantum states by controlling individual vortex. A commonly observed phenomenon is that there are dips in the magnetoresistanceR(H)or peaks in the field dependence critical current densityjc(H)when the number of flux quantumΦ0is an integer multiple of the pinning sites,known as the matching effect or the commensurate effect.[2-7]The most widely accepted explanation of the matching effect is the pinning enhancement when the vortex lattice is commensurate with the pinning sites.
Similar effects have also been observed in other systems like superconducting wire networks[9-14]which may arise from quite different origins. For superconducting wire networks with a line widthωcomparable to the superconducting coherence lengthξ,the origin of the oscillations is very close to the well-known Little-Parks effect.[15,16]This is a consequence of the supercurrent induced suppression of the superconducting critical temperatureTcat non-integer flux quantum fields,which is closely related to the fluxoid quantization effect.[17]
However,the multiple connected nature of superconducting wire networks makes the coherence of different paths of vital importance. This is reflected in the integer or fractional matching fields of the periodic oscillations, which is closely related to the lattice geometry. The oscillations in superconducting wire networks such as the phase boundaryTc(H)can be calculated from the linearized Ginzburg-Landau equations,[18,19]which is expressed in the form of superconducting order parameters of the nodes. These problems can be mapped into the eigenvalue problems of tight binding electrons in the same lattices, with the results of the upper limits of the Hofstadter butterfly[20]like spectrums being theTc(H) boundary of the corresponding wire networks.The eigenvalue problems can be also solved by an analytical approach based on multiple-loop Aharonov-Bohm Feynman path integrals,[21-23]and this provides a more systematical process to obtain the phase boundaryTc(H).
As for superconducting films with large-diametered hole arrays where ΔWis comparable toξ,the origin of the oscillations is not clear yet. Interestingly,for superconducting films with different kinds of pinning arrays,transition from pinning mechanism to wire network behavior has been observed when the edge-to-edge separation of the nearest holes ΔWis gradually decreased to nearξ.[4]Furthermore,the fluxoid quantization inducedTcdecline at non-integer flux quantum fields is determined when theR(H)curves of the films with hole arrays are compared to that of continuous reference film.[8]
Most previous results are given in films with square or triangle hole arrays[4,24-26]whose structures are very close to the corresponding wire networks. Thus it is straightforward that these arrays can be simplified to wire networks. While for other films with periodic hole arrays with large-areaed remaining film,such as Kagom´e or honeycomb hole arrays,the simplification is no longer appropriate. Nevertheless,the simplification from a film with hole arrays to wire networks can still be done in the low field if the disk-shaped film regions are regarded as nodes.[27]

Fig.1. SEM images and unit cells of sample Kagom´e, FH3 and FH2 are presented in(a), (b)and(c), respectively, and their corresponding wire networks are shown in (d), (e) and (f), respectively. These samples share similar parameters, with the distance of the center of the nearest holes a=600 nm,and the edge-to-edge separations of the nearest holes ΔW ≈60 nm.
It is worth noticing that the theoretical values of the period of the oscillations that derived from the hole density and those derived from the corresponding wire networks are accidently the same, which makes it inconvenient to figure out whether the connectivity of the system is the true origin of the oscillations. A possible reason is that the commonly used lattices including square, rectangle, triangle, Kagom´e and honeycomb are all consist of holes with the same distribution of neighboring holes. One exception is the diluted square hole array which has two different types of holes,[28]but the experiment value of the oscillation period in the low field is still the same as the theoretical value derived from the hole density,and the corresponding wire network is also too complicated to be determined.
In order to further clarify the origin of the oscillations,three different samples named Kagom´e, FH3 and FH2 have been fabricated. They are all diluted triangle arrays with the same hole density but different configurations of holes. The latter two samples have been fabricated with specially designed hole arrays by adding some holes to the honeycomb hole array, and their symmetries are lower than that of the Kagom´e hole array. Periodic oscillations ofR(H)curves have been observed in these samples with different intervals of oscillations,especially in the low field region.It is found that the experiment results of intervals of oscillations in the low field are not necessarily equal to the theoretical ones that derived from the hole density. In addition,the results of dips or peaks ofR(H),Tc(H)andjc(H)at fractional matching fields within the first oscillation are also consistent with those derived from the corresponding wire networks if the large disk-like film regions are regarded as nodes. All these results suggest that the oscillations are determined by the connectivity of the samples rather than the hole density. So we find a strong evidence to support that for superconducting films with large-sized hole arrays wherewsis comparable toξ, the periodic oscillations are determined by the connectivity of samples rather than the hole density.
2. Experiments
The samples with desired nanostructures were fabricated and measured as follow. First,Nb film of about 60 nm was deposited on the surface of Si substrate which was covered with a 300 nm-thick SiO2layer using DC magnetron sputtering.Next,a micro-bridge consisted of a 60×60 μm2area and four leads was fabricated using ultraviolet lithography and reactive iron etching. Then,superconducting films with designed hole arrays were fabricated on the 60×60 μm2area using electron beam lithography and reactive ion etching. Finally,the transport properties of the samples were measured using a physical properties measurement system(PPMS)connecting with a LS370 AC bridge, a model 6221 current source and a model 2182 nanovoltmeter.
Three different samples were fabricated to investigate the origin of the oscillations, which are all 3/4 diluted of the same triangle hole array but with different arrangements of holes. The distance between the center of the nearest holesais 600 nm, and the diameter of the holedis about 540 nm,which leaves the edge-to-edge separation of the nearest holes ΔWabout 60 nm,very close to the superconductor coherence lengthξ.[29]The scanning electron micrograph(SEM)images and unit cells of sample Kagom´e,[22,23,30]FH3 and FH2 are shown in Figs.1(a),1(b)and 1(c),respectively.
They are all obtained by removing a quarter of holes from the triangle hole array but with different distributions of holes.The latter two are obtained by adding extra holes to the honeycomb hole array. It is shown in Figs. 1(b) and 1(c) that,both samples FH3 and FH2 share the same rhomboid primitive cell while there is a difference in one of the two basis vectors, which are marked with green color. It is easy to see that there is a shift of half the length of the primitive cell in the vertical direction. The film with Kagom´e hole array is used as a reference sample, which has already been investigated elsewhere.[27]
3. Results and discussion
TheR(H)curves of samples Kagom´e,FH3 and FH2 are shown in Figs. 2(a), 2(b) and 2(c), respectively, the temperatures are selected at which the oscillations are the most pronounced. For convenience, the magnetic field is presented in both the original form and the reduced one normalized by the period of the first oscillation, and the resistance is also displayed in the reduced formR/RN, whereRNis the resistance at 10 K.Obviously,there are two different field regions with different intervals of the oscillations in all these samples.The intervals of the oscillations are extracted and displayed in Fig. 3(a), and the averages of the intervals are shown in Fig.3(b).
The critical field isHc=145.7 Oe in sample Kagom´e.For field lower thanHc,there are three complete oscillations with sharp dips at fractional matching fields,and the average value of intervals is ΔH1=48.6 Oe. However,for field higher thanHc,the average value of intervals increases to ΔH2=65.9 Oe,and dips at fractional matching fields are slowly washed out.Similar behaviors have been observed in samples FH3 and FH2.These results change intoHc=129.6 Oe,ΔH1=43.2 Oe and ΔH2=64.7 Oe for sample FH3, excluding an exception of the interval in the high field region, andHc=128.9 Oe,ΔH1=43.0 Oe and ΔH2=64.4 Oe for sample FH2.
It is surprising that ΔH1of samples FH3 and FH2 are nearly the same, but different from that in sample Kagom´e.The theoretical value of the oscillation period ΔH1in the triangle hole array corresponding to the hole density witha=600 nm andd=540 nm is 66.3 Oe obtained by the equation

whereSuis the area of the unit cell andn0is the number of holes in the unit cell. Since samples Kagom´e, FH3 and FH2 are all 3/4 diluted triangle hole arrays, the theoretical values of ΔH1corresponding to the hole density are all 3/4 of that in the triangle hole array, which equals to 49.8 Oe. This is very close to the experimental result in sample Kagom´e,but different from that in FH3 and FH2, which is shown in Fig. 3(b).Thus the oscillations periods in the low field region are not determined by the hole density,which has not been clearly shown in previous works.

Fig. 2. (a)-(c) The most pronounced R(H) oscillation curves of samples Kagom´e,FH3 and FH2 measured with a current of 10 μA,respectively. For each curve,the magnetic field is both displayed in the original form and the reduced one normalized by the period of the first oscillation,and the insert shows the dips at fractional matching fields of the first oscillation.
At field aboveHc, the intervals of the oscillations increase,except for the fifth oscillation of sample FH3,which retains the same interval as that in the low field. The experiment results of ΔH2of all these samples are very close to the theoretical value of the oscillation period ΔH1in film with triangle hole array corresponding to the hole density. The changes of the intervals have been mentioned in many articles as a result of the reconfiguration effect of vortices,[29,31-34]which exist in the form of fluxiod in the low field, and both fluxoid and Abrikosov vortices[35]in the high field. Nevertheless, more details are needed to obtain the exact distributions of the vortices in these samples.

Fig. 3. (a) The separations of field of R(H) oscillations in samples Kagom´e,FH3 and FH2 extracted from Fig.2.(b)The average separations of field in the low field ΔH1 and those in the high field ΔH2 in samples Kagom´e,FH3 and FH2 are compared with the theoretical value of the oscillation period derived from the hole density and the corresponding wire networks respectively.
Films with different hole arrays can be simplified to the corresponding wire networks if the disk-like film regions in these samples are considered as nodes, which highlights the importance of the connectivity of superconducting films with large size of hole arrays. In this way, the corresponding wire network of the film with Kagom´e hole array isT3wire network,[36-38]which is shown in Fig. 1(d). In fact, the dips of the first oscillation at fractional matching fields in sample Kagom´e are located atf=1/6,1/3,2/3 and 5/6,and a distinctive sharp peak is found atf=1/2,as shown in the insert of Fig.2(a). These are just the fingerprint of theT3wire network,which has already been investigated elsewhere.[27]Furthermore, the experiment results of ΔH1in sample Kagom´e are also consistent with the oscillation period derived from the correspondingT3wire network. However, the oscillation periods calculated from the hole density and the wire network are exactly the same, and this makes it impossible to decide whether the hole density or the connectivity of the wire network is the true origin of the oscillation.
The corresponding wire network of sample FH3 shown in Fig.1(e)is much more complicated. In fact, there are two different kinds of disk-like film regions which are simplified as the nodes of the wire network, and the wire network is just exactly the Kagom´e lattice if the small disk-like pieces of film regions are ignored and only the connectivity of the large pieces is considered, shown as the red lines in Fig. 1(e). Interestingly,the experimental dips at fractional matching fields within the first oscillation in sample FH3 shown in the insert of Fig.2(b)are located atf=1/8,1/4,3/8,5/8,3/4 and 7/8,and there is also a distinctive peak atf=1/2. These features are exactly the same as that in Kagom´e wire network.[12,22,23]Furthermore,the experiment value of the oscillation period of sample FH3 ΔH1is also consistent with the theoretical one derived from the Kagom´e wire network,and this is not the same as that derived from the hole density of sample FH3,which is shown in Fig. 3. These results suggest that the oscillation of theR(H)curves in sample FH3 is originated from the connectivity of the film.
For sample FH2, the experimental dips at fractional matching fields within the first oscillation changed tof=1/8,1/4, 1/2, 3/4 and 7/8, which is shown in the insert of Fig. 2(c). Simplification of sample FH2 can be also done in the same way of FH3,shown as the red lines in Fig.2(f).
It is unexpected that precise results are obtained while large simplification is considered in sample FH3, where the contribution of the small disk-like film regions is ignored. In fact,the transitions of the films with Kagom´e and honeycomb hole array to T3and triangle wire networks respectively[27]are also surprising since the disk-like film regions are simply considered as nodes of wire networks. It is worth noticing that the large disk-like film regions are directly connected to each other in the film with honeycomb hole array,but they are connected to each other by the small disk-like film regions in the film with honeycomb hole array.[27]While for sample FH3,the large disk-like film regions are directly connected to each other without passing through the small ones. Therefore, a possible explanation is that, the coherence between the large disk-like film regions in sample FH3 is strong, which dominates the connectivity of the sample.
The phase boundaryTc(H)of superconducting wire networks can be theoretically calculated from Ginzburg-Landau theory.[18,19]Based on the linearized Ginzburg-Landau equations,the relationship between the order parameter of a given node and that of other nodes directly connected to it can be derived, which is also called the Alexander equations.[18]Each of the order parameter of the nearest node in these equations has a phase factor related to the external magnetic field, and the superconducting coherence length, as a function of temperature, is a parameter of these equations. Hence the phase boundaryTc(H) can be obtained by solving the eigenvalue problem of these equations under periodic boundary conditions. Interestingly, the mathematical means used here is very similar to that of tight binding electrons in the same 2D lattice, which gives the famous Hofstadter butterfly energy spectrum[20]when the lattice is a square. Thus the calculation of phase boundaryTc(H) can be mapped into the eigenvalue problem of tight binding electrons under the same lattice. In fact,this eigenvalue problem can be solved by an analytical approach based on the multiple-loop Aharonov-Bohm Feynman path integrals,[21-23]which provide a systematically method to calculate the phase boundary.
The experiment results ofTc(H) provide a more direct approach to determine whether films with hole arrays can be regarded as wire networks in the low field,comparing with the theoretical ones of the corresponding wire networks. The blue line in Fig.4 shows theTc(H)boundary of sample FH3 within the first oscillation with the criteria of 0.1RN,whereRNis the resistance of the sample at 10 K, andTcis displayed in the form of(Tc(0)-Tc(f))/Tc(0)for convenience.
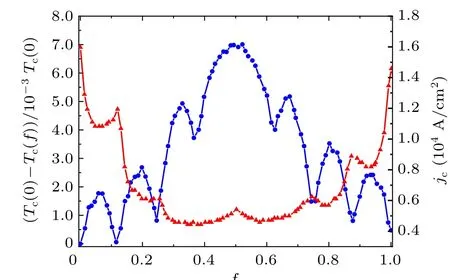
Fig.4. The Tc(H)curve within the first oscillation with the criteria of 0.1RN(blue line) and the jc(H) curve measured at 8.48 K with the criteria of 0.02RN (red line)of sample FH3.
TheTc(H) curve of the oscillation displayed here shows the similar behavior of theR(H)curve with the dips located at fractional matching fields includingf=1/8, 1/4, 3/8, 5/8,3/4 and 7/8 while there is a peak atf=1/2,and this is consistent with that calculated from the Kagom´e wire network based on the multiple-loop Aharonov-Bohm Feynman path integrals.[13,22,23]
Nevertheless,the behavior of fractional matching fields of thejc(H)curve measured at 8.48 K with the criteria of 0.02RNis not exactly the same as that inTc(H)curve,which is shown in Fig.4 by the red line. There is a peak atf=1/2 while the peaks at 3/8 and 5/8 disappear. Considering that thejc(H)curve is obtained well below the critical temperature,the pinning effect of holes is enhanced with the transition from the film with hole array to wire network invalid. Thus the matching effect of thejc(H) curve is dominated by vortex-vortex interactions as well as the interactions between vortices and pinning landscape, with the long-range order of vortex configurations of vital importance.[39-41]In fact,similar behavior has been observed in superconducting Kagom´e wire network,but it is a transition from peak to small dip atf=1/2 inTc(H)curve when the criteria of critical resistance changes to lower values.[11]Therefore,the method of treating sample FH3 nearTcas a Kagom´e wire network is reasonable in the low field.
4. Conclusions
The magnetoresistance oscillations of superconducting films with the same hole density but different configurations of holes have been investigated here. It is found that when the edge-to-edge separations of the nearest holes are comparable to the superconductor coherence length,the periods of the magnetoresistance oscillations in the low field are not necessarily determined by the hole density,but rather by the connectivity of corresponding wire networks. Also,the experimental details at fractional matching fields inR(H),Tc(H)andjc(H)curves within the first oscillations also support the rationality of simplifying films with hole arrays into wire networks.Thus we can conclude that the magnetoresistance oscillations of films with large-sized hole arrays are determined by the connectivity of these systems rather than the hole density.
Acknowledgments
X.G.Q.acknowledges the support from the National Natural Science Foundation of China (Grant Nos. 11974412 and 11774400) and the National Key R&D Program of China(Grant Nos.2017YFA0302903 and 2018YFA0305703).
杂志排行

Chinese Physics B的其它文章
- Measurements of the 107Ag neutron capture cross sections with pulse height weighting technique at the CSNS Back-n facility
- Measuring Loschmidt echo via Floquet engineering in superconducting circuits
- Electronic structure and spin-orbit coupling in ternary transition metal chalcogenides Cu2TlX2(X =Se,Te)
- Characterization of the N-polar GaN film grown on C-plane sapphire and misoriented C-plane sapphire substrates by MOCVD
- Review on typical applications and computational optimizations based on semiclassical methods in strong-field physics
- Quantum partial least squares regression algorithm for multiple correlation problem