Potential Impact of Tonga Volcano Eruption on Global Mean Surface Air Temperature
2022-03-12HuaZHANGFeiWANGJianLIYihongDUANCongwenZHUandJingyiHE
Hua ZHANG, Fei WANG, Jian LI, Yihong DUAN, Congwen ZHU, and Jingyi HE
1 State Key Laboratory of Severe Weather, Chinese Academy of Meteorological Sciences, China Meteorological Administration, Beijing 100081
2 Collaborative Innovation Center on Forecast and Evaluation of Meteorological Disasters,
Nanjing University of Information Science & Technology, Nanjing 210044
ABSTRACT
Key words: Tonga volcano eruption, simplified radiation equilibrium model, radiative forcing, global mean surface air temperature, global warming
1. Basic physics
In volcano-related climate change research, rather than the eruption intensity, the aerosol optical depth and associated radiative forcing are the most important physical variables, which are most closely related to the sulfates released into the stratosphere by the eruption. When a volcano erupts, it injects a large amount of sulfurous gases into the stratosphere, mainly SO2and sometimes H2S.These gases react with OH and H2O to generate sulfate aerosols in a few weeks, which will take months or even years to subside to the earth’s surface. Sulfate aerosols in the air strongly reflect solar radiation, decreasing solar radiation reaching the surface, which is the main reason for global cooling after the volcanic eruption.
Based on the relationship given in Shi (2007), the global sulfate aerosol radiative forcing in the stratosphere ( ∆F) is related to the global mean aerosol optical thickness (τ) as follows,
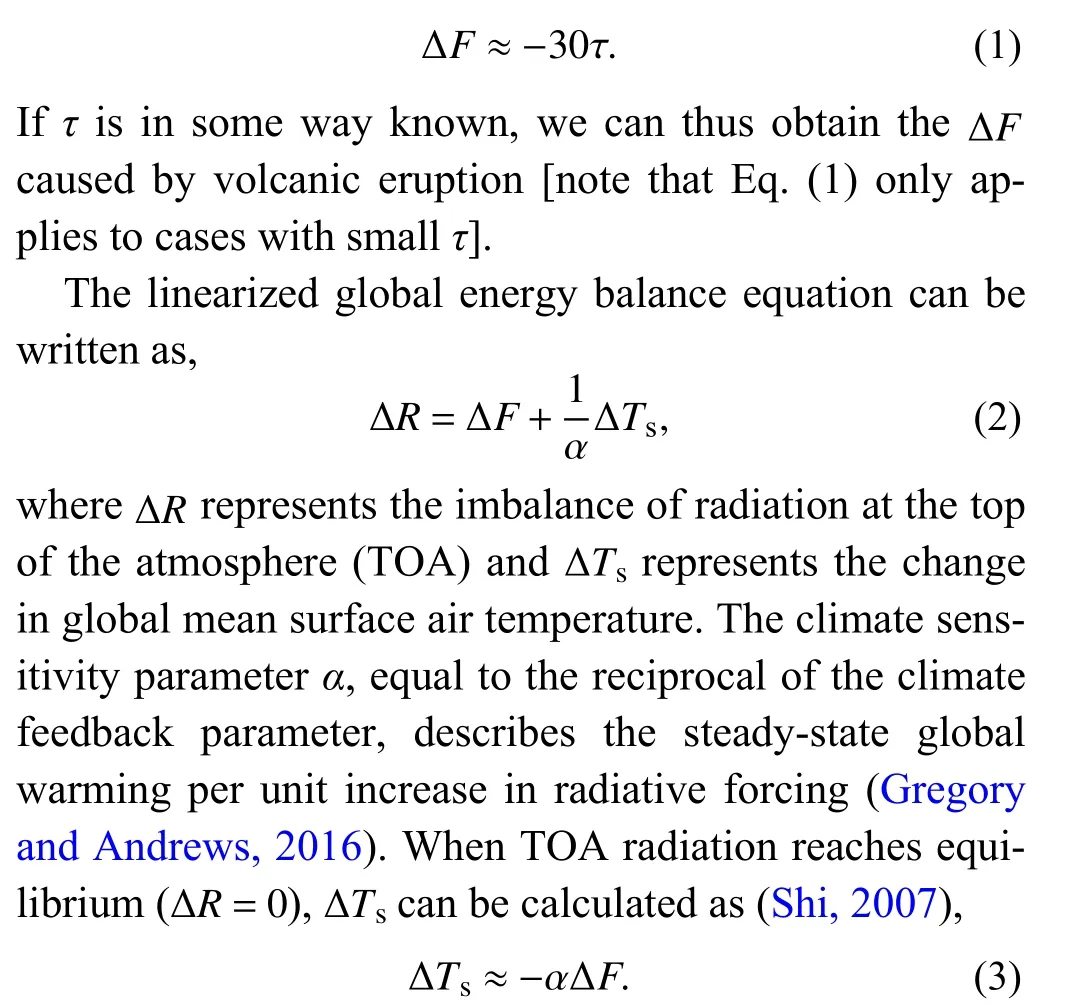
For historical volcanic eruptions,αis empirically set as−0.3 in unit of (W m−2°C−1)−1. For current and new eruptions, according to the Sixth Assessment Report of the Intergovernmental Panel on Climate Change (IPCC AR6), the very likely value range of the climate feedback parameter is −1.81 to −0.51 (best estimate −1.16)(Forster et al., 2021), i.e., the value of climate sensitivity parameterαis −1.961 to −0.552 (best estimate −0.862).
In sum, according to Eqs. (1)–(3),τis the critical variable for estimating ∆Ts.
2. A historical case—El Chichón (1982)
The explosive eruption of El Chichón in Mexico in 1982 produced a great deal of sulfate aerosols that had a substantial influence on the global climate, especially in the Northern Hemisphere (NH), and significantly cooled the earth. Taking El Chichón eruption with more related observational data for a reference in this work, we first estimate its impact on global mean surface air temperature and validate our result with observations.
Figure 1 shows the aerosol optical thicknessτat the 0.55-μm wavelength corresponding to six different volcanic indices for the NH and Southern Hemisphere (SH)in the past 150 years. The volcanic indices are used to describe the relative strength of past volcanic activities(Robock and Free, 1995), which include dust veil index(DVI), Mitchell index, volcanic explosivity index (VEI),Sato index, Khmelevtsov index, and ice core volcanic index (IVI) (Table 1). They are linked to aerosol mass,τ,and other properties of aerosols from volcanic eruption.
According to Fig. 1, we estimate that the global meanτgenerated by the El Chichóneruptionisapproximately 0.0325. Whenαis assumedtobe−0.3(Wm−2°C−1)−1,based on Eqs. (1) and (3), the ∆Fcaused by the El Chichón eruption is −0.975 W m−2, and theTsdecreases by 0.2925°C (Table 2), which is well consistent with the observational result of 0.3°C (Hofmann, 1987).

Fig. 1. Aerosol optical thickness (τ) at the 0.55-μm wavelength in association with six different volcanic indices for the (a) Northern and (b)Southern Hemispheres in the past 150 years [from Robock and Free (1995)]. The zoomed-in panels on the right show details of the relationship during the 1982 El Chichón eruption.
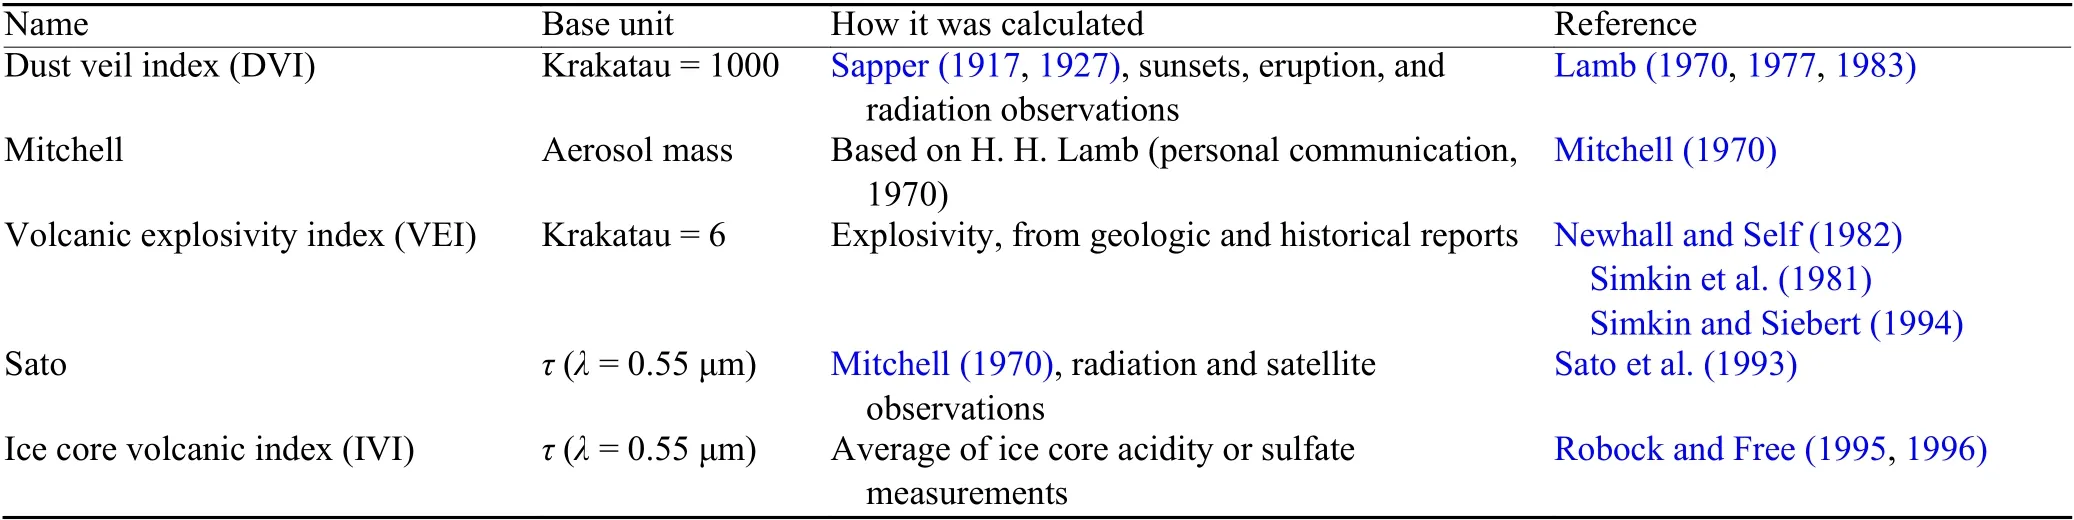
Table 1. Indices of past volcanic eruptions (Robock, 2000; Shi, 2007)

Table 2. Estimates of aerosol optical thickness (τ), radiative forcing (ΔF), and surface air temperature change (ΔTs) caused by volcanic eruptions of El Chichón (1982) and Tonga (2022, three scenarios)
Here is howτ= 0.0325 for El Chichón eruption is derived. According to Figs. 1a, b, by zooming in (as shown in the right panels), we obtain the values ofτcorresponding to DVI, Mitchell, Sato, and IVI indices in the NH and SH, and calculate the global meanτas the average of the NH and SH values (Table 3). Considering that the curves of VEI and Khmelevtsov indices are overlapped with those of the other four indices (see the zoomed-in panels of Fig. 1 on the right), we also give the maximum and minimumτvalues corresponding to the six indices, and calculate ∆Tsbased on Eqs. (1) and (3) (Table 3). As shown in Table 3, compared with the observation from Hofmann (1987), ∆Tswould be underestimated or overestimated if we only used one index to estimateτ. Only when the averageτfrom Sato and IVI (namely 0.0325) is used, is ∆Tsthe closest to the observation (Hofmann,1987). Therefore, we setτ= 0.0325 as the global mean stratospheric aerosol optical thickness caused by the El Chichón eruption in this work.
3. Impact of Tonga eruption (2022)

Table 3. Manual estimation of aerosol optical thickness (τ) according to Fig. 1, and the calculated [based on Eqs. (1) and (3)] ΔTs caused by El Chichón eruption [α = −0.3 (W m−2 °C−1)−1]

4. Conclusions and discussion
To sum up, the Tonga volcanic eruption has a VEI of about 5, and its intensity is similar to the El Chichóneruption in 1982. However, the stratospheric aerosol radiative forcing caused by the Tonga eruption is only−0.057 W m−2, and the global average surface temperature will decrease by about 0.0315–0.1118°C in the next 1–2 years. The Tonga eruption will slightly slow down the global warming in a short period of time, but it will not change the global warming trend in the long run.
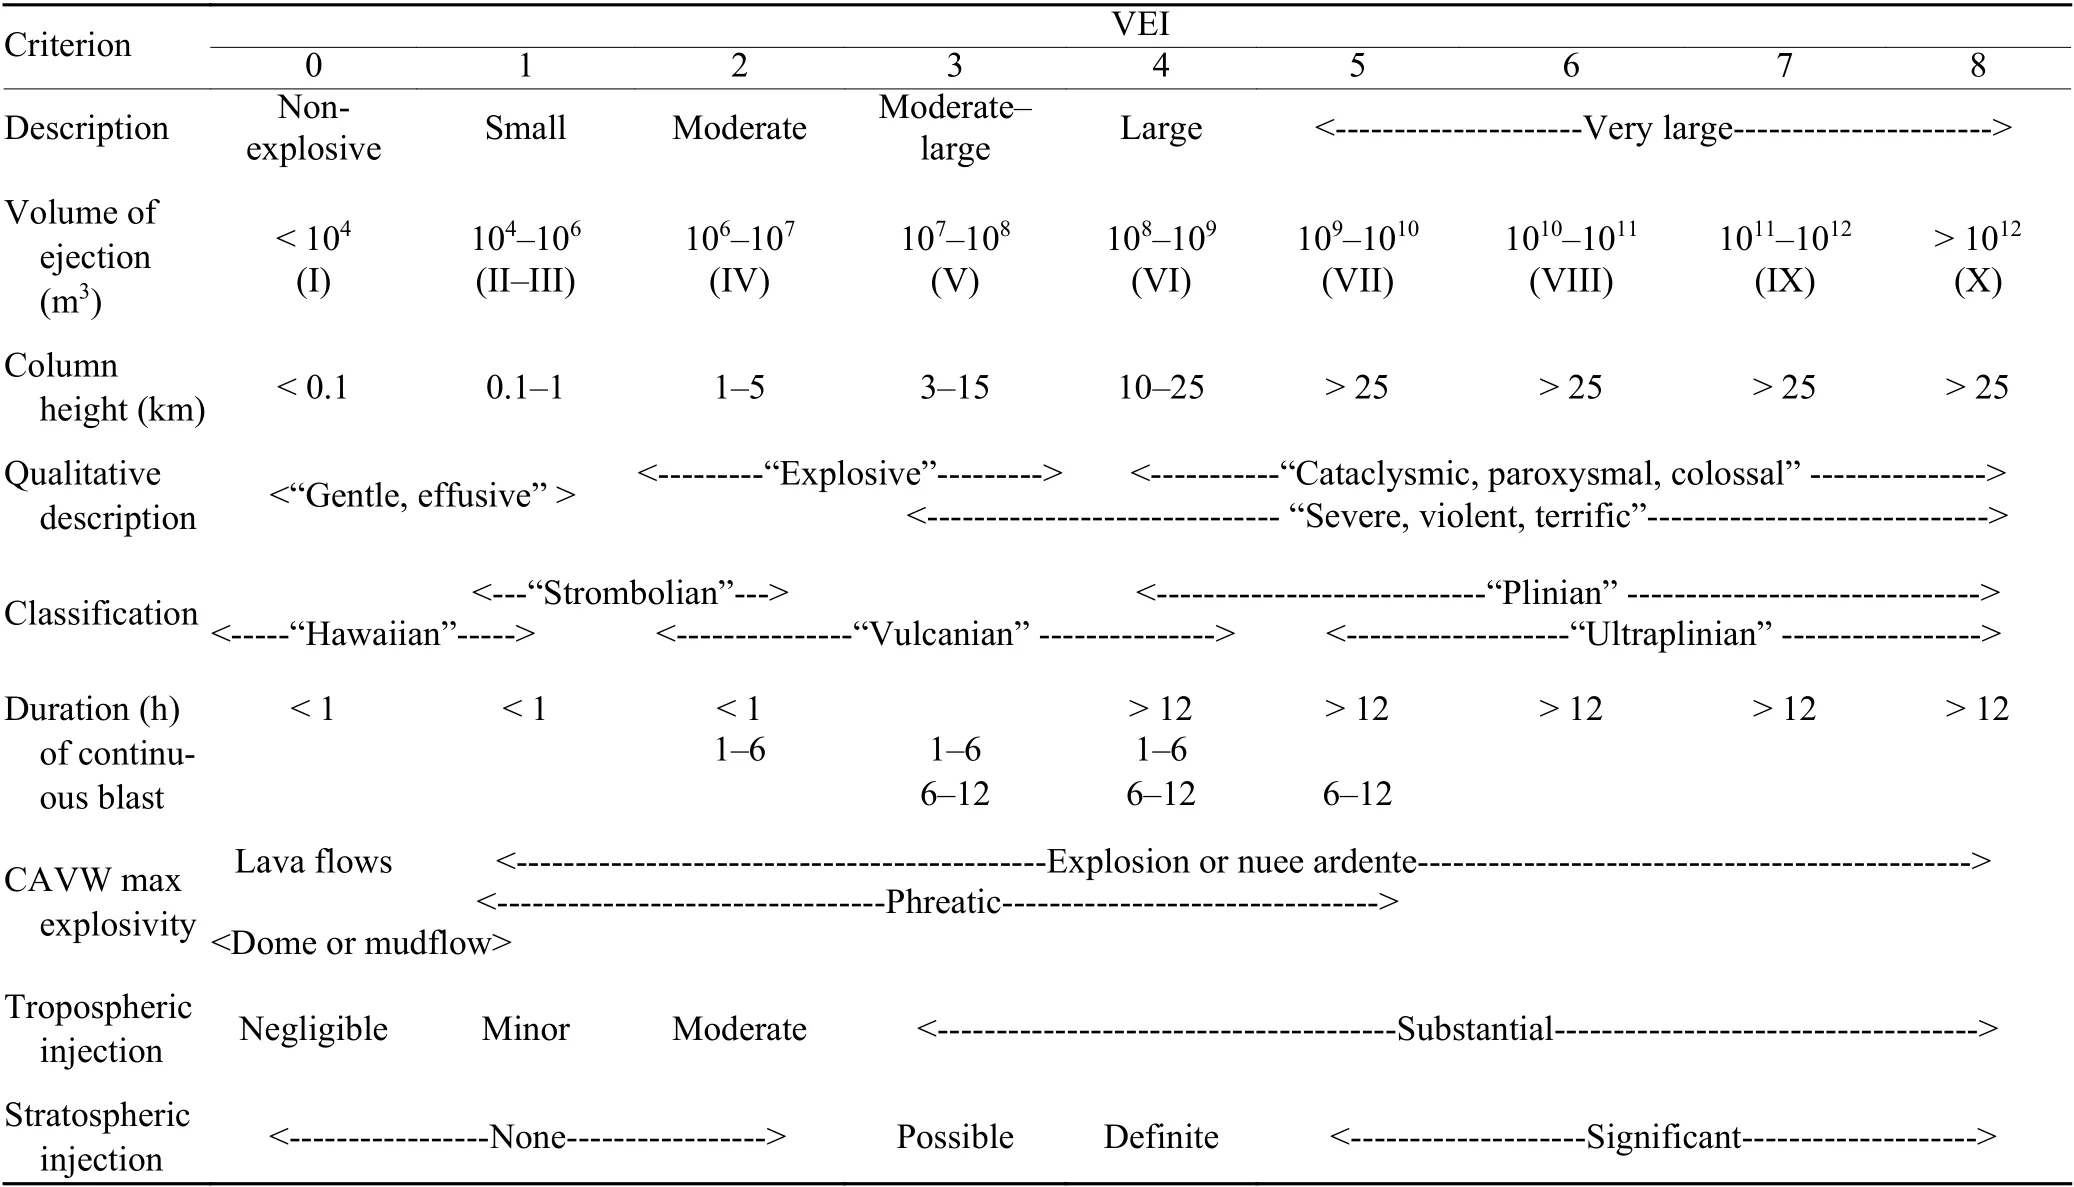
Table 4. Criteria for estimation of volcanic explosivity index (VEI) (Newhall and Self, 1982; Shi, 2007)
Based on the relevant information available so far and the quantitative estimates in this study, we conclude that the impact of the Tonga eruption on global warming is much smaller than the El Chichón eruption in 1982. The aerosol radiative forcing generated by the Tonga eruption is only 5.7% of the El Chichón eruption, and the surface temperature change caused by the former is only 11%–37% of the latter. In addition, we find out that the aerosol radiative forcing resulted from the Tonga eruption is only 1.5% of current greenhouse gas forcing (3.84 W m−2) assessed in IPCC AR6 (Forster et al., 2021).Therefore, we infer that the Tonga eruption in the SH has a minor effect on global warming trend in the future.However, if Tonga volcano erupts with the same or even twice the intensity once more in the near future, that is, it continues to inject 0.4 or 0.8 million tons of SO2into the stratosphere, it will have a significant influence on global warming, equal to the effect of the El Chichón eruption. Combined with the high climate sensitivity at present (Zhang et al., 2022), the impact caused by the Tonga eruption may exceed the El Chichón eruption, and our estimates show that the global surface air temperature will be reduced by up to 0.2235 or 0.3353°C if Tonga volcano continues to erupt in the near future (Table 2).
Considering the possible scenarios of future volcanic eruptions, we summarize and further propose a generalized approach, as shown in Fig. 2, for predicting and estimating volcanic eruption induced global mean surface air temperature change. This simple approach is based on the simplified radiation equilibrium of the earth system.It can be easily applied to quickly and quantitatively assess the climatic effect of any future volcanic eruptions.
It should be noted that the method used in this study can only estimate the stratospheric aerosol radiative forcing caused by volcanic eruption and the resulting global mean surface air temperature change in the next 1–2 years. More complex models are needed to analyze quantitative effects of volcanic eruption on atmospheric temperature, precipitation, atmospheric circulation, and so on at other temporal (such as months and seasons) and spatial scales (such as different regions).
Acknowledgments.We would like to thank Dr. Wei Ke from the Institute of Atmospheric Physics of Chinese Academy of Sciences for his helpful comments.
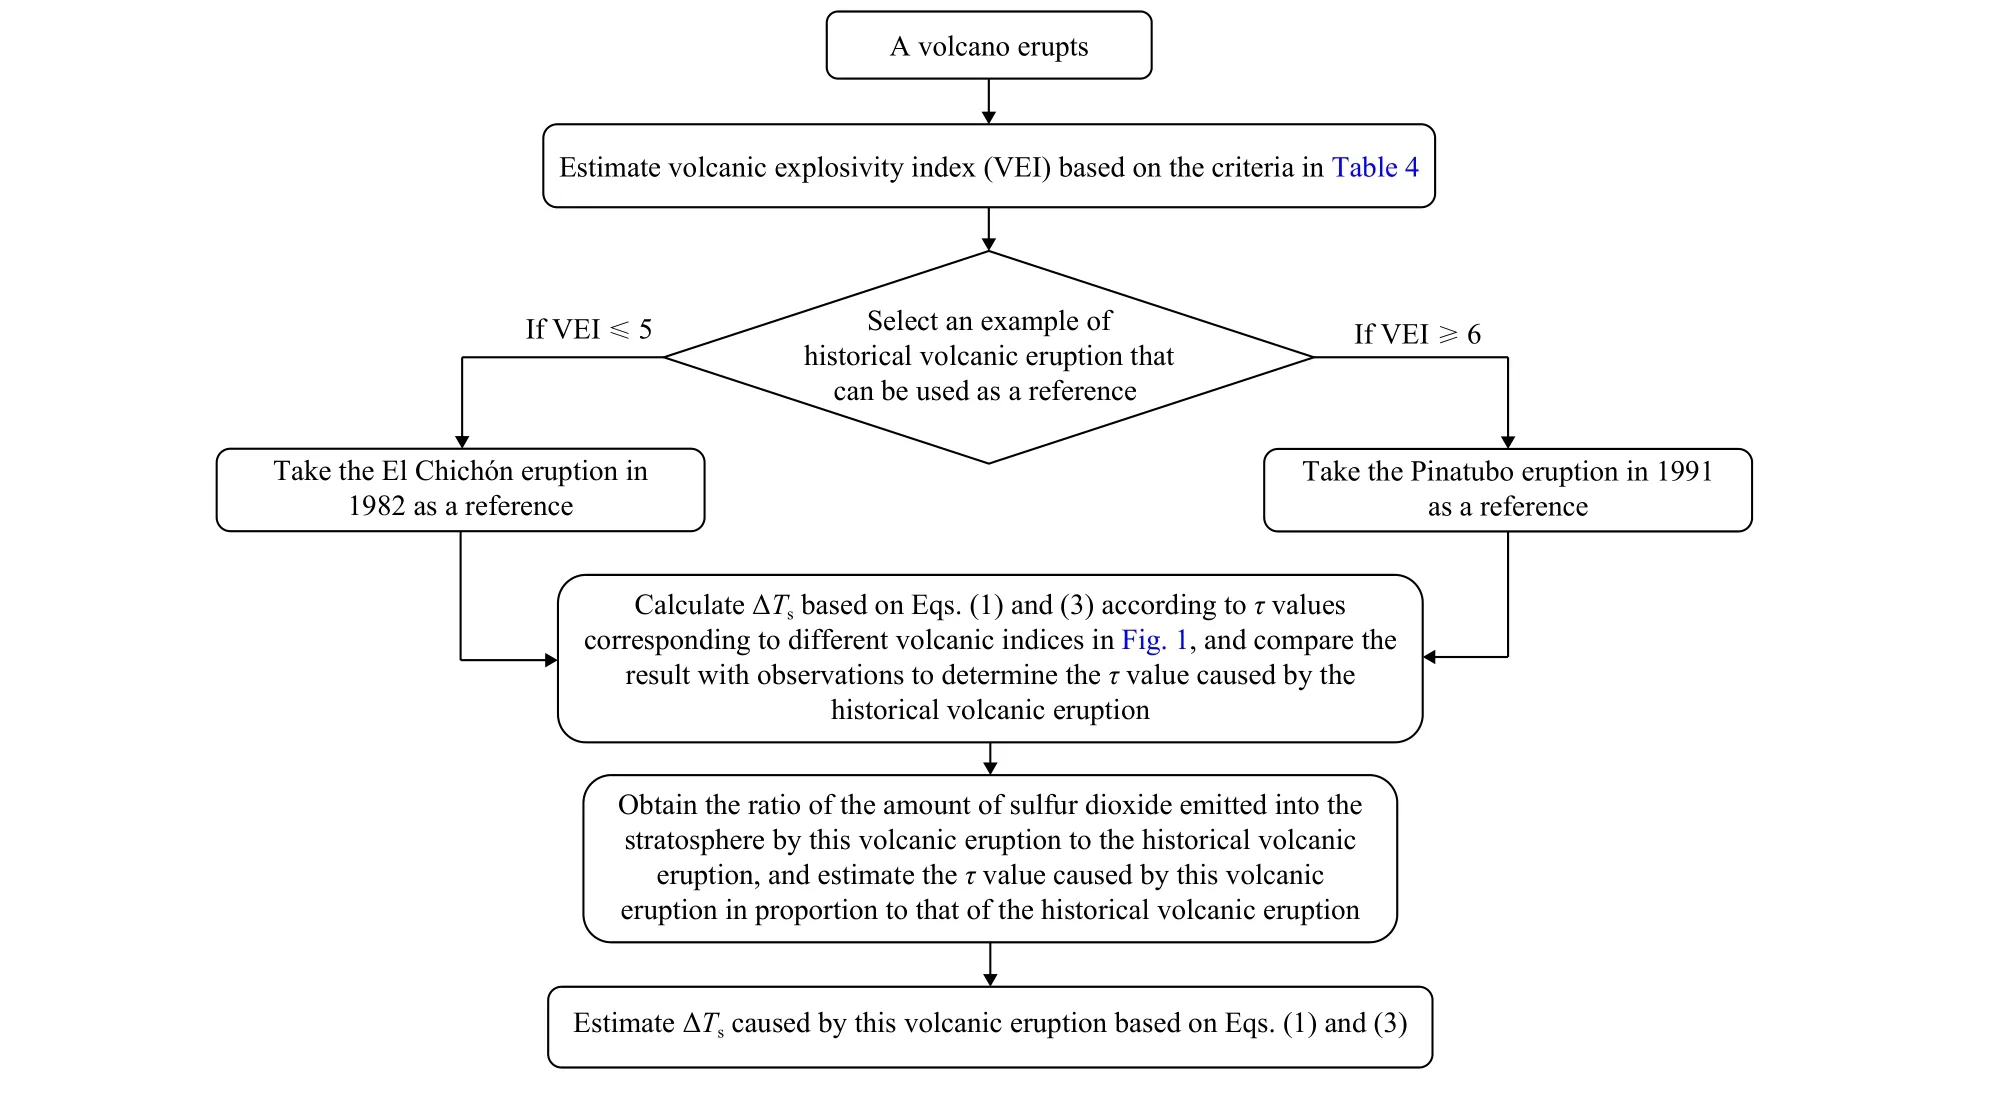
Fig. 2. Flow chart for estimating ∆Ts caused by a future volcanic eruption.
杂志排行

Journal of Meteorological Research的其它文章
- A Possible Dynamic Mechanism for Rapid Production of the Extreme Hourly Rainfall in Zhengzhou City on 20 July 2021
- Diagnosing the Dynamic and Thermodynamic Effects for the Exceptional 2020 Summer Rainy Season in the Yangtze River Valley
- Estimation of Chlorophyll-a Concentration in Lake Taihu from Gaofen-1 Wide-Fieldof-View Data through a Machine Learning Trained Algorithm
- A Case Study on the Rapid Rain-to-Snow Transition in Late Spring 2018 over Northern China: Effects of Return Flows and Topography
- Southwesterly Water Vapor Transport Induced by Tropical Cyclones over the Bay of Bengal during the South Asian Monsoon Transition Period
- Energetics of Boreal Wintertime Blocking Highs around the Ural Mountains