Development of a Label-Free Colorimetric Aptasensor with Rationally Utilized Aptamer for Rapid Detection of Okadaic Acid
2022-02-24YANXiaochenQIXiaoyanZHAOYinglinLILingMARuiWANGLeleWANGSaiandMAOXiangzhao
YAN Xiaochen, QI Xiaoyan, ZHAO Yinglin, LI Ling, MA Rui, WANG Lele,WANG Sai, *, and MAO Xiangzhao, 2)
Development of a Label-Free Colorimetric Aptasensor with Rationally Utilized Aptamer for Rapid Detection of Okadaic Acid
YAN Xiaochen1), QI Xiaoyan1), ZHAO Yinglin1), LI Ling1), MA Rui1), WANG Lele1),WANG Sai1), *, and MAO Xiangzhao1), 2)
1),,266003,2),266237,
Okadaic acid (OA) is a typical marine toxin with strong toxicity causing diarrheic shellfish poisoning (DSP). Aptamers show great advantages in toxin detection and attract increasing attentions in the field of food analysis. In this study, a label-free col- orimetric aptasensor was constructed for visual and rapid detection of OA in shellfish. To exploit the binding capability of the anti- OA aptamer, the inherent molecular recognition mechanism of aptamer and OA was studied, based on molecular docking, fluorescent assay, and biolayer interferometry. Consistent results showed that the stem-loop near the 3’ terminal of the aptamer exhibit dominate binding capacity. Based on the revealed recognition information, the aptamer was thus rationally utilized and combined with AuNPs and cationic polymer polydiallyl dimethyl ammonium chloride (PDDA) for the development of the label-free colorimetric aptasensor, in which the 3’ terminal was thoroughly exposed to OA. The aptasensor provided robust performance with a linear detection range of 100–1200nmolL–1, a limit of detection of 41.30nmolL–1, recovery rates of 91.6%–106.2%, as well as a high selectivity towards OA in shellfish samples. The whole detection process can be completed within 1h. To our best knowledge, this is the first time that the anti-OA aptamer was thoroughly studied, and a label-free colorimetric aptasensor was rationally designed in this way. This study not only provides a rapid detection method for highly sensitive and specific detection of OA, but also serves as a reference for the design of efficient aptasensors in the future.
aptamer; okadaic acid; colorimetric aptasensor; molecular docking; fluorescent assay; biolayer interferometry
1 Introduction
Okadaic Acid (OA, C44H68O13,. 805gmol–1) has been recognized as a major toxic compound in ocean, causing diarrheic shellfish poisoning (DSP) by inhibiting the ac- tion of protein phosphatase (Ramalingam., 2019; Kong., 2021) and resulting in a series of symptoms of diar- rheal poisoning, including nausea, vomiting, dizziness, diar-rhea, and abdominal pain (Paredes., 2011; Gu.,2017). Derived from some algae such asand, OA can be accumulated in the shellfish (Va- nessa., 2013), exposing high risk to the consumer health.The European Union stipulates the maximum allowable OA content in shellfish at 160µgkg–1, and the United States Food and Drug Administration has regulated a standard of total OA not higher than 200µgkg–1.
To ensure the human health, effective methods for the detection and monitoring of OA content are always need- ed (Campàs., 2007; Masanori., 2014; Wang., 2020). The traditional detection methods to detect OA in- clude mouse bioassays (MBAs) (Kjetil., 1988), high performance liquid chromatography-mass spectrometry (HPLC-MS) (Louppis., 2010), and immunoassays (Vdovenko., 2013; Kawatsu., 2014). Among them, MBAs were regarded as the standard method for OA quan- tification before 2011; however, these methods involve ani- mal ethics issues and have been banned in some countries. Although HPLC-MS achieves accurate quantitative and qua- litative analysis of OA (Wu., 2015), it requires com- plicated and professional operations, which makes the me-thod more suitable for the final verification analysis, whileit cannot meet the needs of rapid preliminary screening frommultiple samples. The immunoassays are developed based on the specific binding between antigen and antibody and have good potential to be applied for rapid detection of OA; however, the complicated producing process and difficult storage of the antibodies bring some challenges to such me- thods (Sassolas., 2013; Garibo., 2014). Moreover, with a low molecular size and high toxicity, it is more dif- ficult to produce the antibody of OA. Until now, there is still an urgent need of a simple and efficient method for ra- pid and preliminary detection of OA from food samples.
Aptamers are single-stranded DNA or RNA oligonucleo- tides, selected totallyby Systematic Evolution of Ligands by Exponential Enrichment (SELEX) (Ellington and Szostak, 1990; Tuerk and Gold, 1990). Termed as che- mical antibody (Toh., 2015), aptamers can fold into unique three-dimensional structures to bind specifically with various targets. In theory, aptamers towards all targets suchas metal ions (Yu and Jiang, 2011; Wang., 2019), pro-teins (Zhao., 2020), and even whole cells (Ardjoman- di., 2013; Hu., 2017) can be selectedby SELEX, with no limitation by the immunogenicity, size, or toxicity of the targets. Moreover, compared with the ge-neral antibodies, the aptamers have advantages of good che- mical stability, wide acceptability of modification, and lowsynthesis cost, and thus attracting more and more attentionfrom the fields of food safety, environment safety, diseasesdiagnosis, and so on (Song., 2008; Nutiu and Li, 2010; Farzin., 2017).
In recent years, several aptasensors have been develop- ed for OA since Eissa. (2013) reported the anti-OA aptamer. For example, Ramalingam. (2019) modified the screen-printed carbon electrode with lithium phospho- rence-gold nanocomposite and proposed an electrochemi- cal microfluidic chip to detect OA. Gu. (2017) de- scribed a competitive fluorescent aptasensor for OA, basedon signal amplification by rolling circle amplification. Wengand Neethirajan (2018) developed a nano-materials en- hanced multipurpose paper-based microfluidic aptasensor for the detection of OA. These aptasensors provide high sensitivity and selectivity. However, they need complex na- nomaterials or additional modifications. In addition, for most cases of studies on developing novel aptasensors, aptamers were directly applied and combined with various biosen- sing transducers, without any investigations of the molecu- lar recognition mechanism between the aptamer and the tar-gets. The correlation between the molecular recognition me- chanism of the aptamer and its practicality in the aptasen- sor is still in a vague exploration stage. Therefore, it is of great significance to understandhow the aptamers bind totargets before designing and developing efficient aptasensors.
In this study, a simple label-free colorimetric aptasen- sor was developed for rapid detection of OA. Gold nano- particles (AuNPs) were applied as the colorimetric trans- ducer, as AuNPs have many inherent optical properties (Wang., 2016; Pan., 2017; Qi., 2018; Ling., 2019). No complicated materials or modifications were needed. Before the development of the aptasensor, the molecular recognition mechanism of the anti-OA aptamer and OA was thoroughly investigated by molecular dock- ing, fluorescent assay, and biolayer interferometry to assistin the rational design. Then on the basis of understandingthe recognition mechanism, the aptamer, AuNPs, and poly-diallyl dimethyl ammonium chloride (PDDA) were com-bined to construct a colorimetric aptasensor for simple, ra-pid, and visual detection of OA in shellfish samples. To our best knowledge, this is the first time that the anti-OA aptamer isthoroughly studied, and a label-free colorimet- ric aptasensor is rationally designed in this way.
2 Materials and Methods
2.1 Materials and Equipments
All oligonucleotides were commercially synthesized by Sangon Biotech Co., Ltd. (Shanghai, China), manually di- luted and stored at−20℃. The OA aptamer was selected by Eissa(2013) with the following sequence: 5’- GGTCACCAACAACAGGGAGCGCTACGCGAAGGGTCAATGTGACGTCATGCGGATGTGTGG-3’. The apta- mer was modified with polyA, BHQ, or biotin. OA, gon- yautoxin 1/4 (GTX 1/4), saxitoxin (STX), neo saxitoxin (neo- STX) standards were purchased from National Research Council Canada. Polydiallyl dimethylammonium chloride (PDDA) and (2-hydroxyethyl)-1-piperazineethanesulfonic acid (HEPES) were obtained from Sigma Aldrich. Tween- 20 was obtained from Solarbio Life Sciences. Other re- agents were all domestic analytical reagents. The binding buffer was prepared with 50mmolL–1Tris, 150mmolL–1NaCl, 2mmolL–1MgCl2and 0.5% Tween-20 (pH 7.5). All chemicals were of analytical grade.
The computational molecular docking assay was per- formed with AutoDock Tools. The fluorescent signals were characterized with Shimadzu F-4600 fluorescence spec- trophotometer (Shimadzu, Japan). The UV-Vis absorption spectrum was obtained with UV-2550 Spectrophotometer (Shimadzu, Japan) and Multiskan Sky (thermo scientific, USA). The TEM image was obtained by JEM-2100 (JEOL, Japan). The hydrodynamic diameter was measured by Ze- tasizer Nano ZS 90 (Malvern, England). Concentrated Au- NPs were obtained by Centrifuge 5425 (Eppendorf, Ger- many). The dissociation constant Kd of the aptamer was obtained by Octet RED96e (Fortebio, USA).
2.2 Molecular Docking
Firstly, the PDB format file of the aptamer obtained from the Mc-fold/sym (https://www.major.iric.ca/MC-Pipe- line/) and mol2 file of the OA obtained from the Zinc web- site (http://zinc.docking.org/) were imported into the Auto- dock Tools software. Secondly, the two structures were pre- processed by setting the number of rotatable bonds, add- ing hydrogen and charge, and assigning atomic types. Third- ly, the grid parameters were set, with the active site box size of 32×38×104Å, the grid spacing of 1Å, and the cen-ter coordinates of the grid box of 1.433, 7.969, 44.208. The grid calculation parameter file was then built and run by the AutoGrid manipulated withcmd 4.0. Fourthly, the dock- ing parameters were set. The number of GA Runs was set to be 100, the population size was set to be 150, and the maximum number of evals was set to be 2500000. Fifthly, molecular docking with AutoDock 4.0 software was car- ried out based on the Lamarckian genetic algorithmto ob- tain the corresponding output file. Finally, according to theminimum free energy, the binding interaction was analyzed and displayed by Pymol, and the key binding sites was re- vealed. The secondary structure predicted by Mfold was used as reference.
2.3 Fluorescent Assay
The quencher-modified aptamer (BHQ-aptamer) and the fluorophore-modified complementary DNA (FAM-cDNA, TGGTGACC or CCACACAT) with the same concentra- tion (0.5μmolL–1) were denatured by heating at 95℃ for 5min and then slowly cooled to 25℃ to achieve hybridi- zation. Different concentrations of OA (0, 125, 500, 1000, 2000nmolL–1) were then addedand incubated for 30min. Then the fluorescent signalswere measured with F-4600 fluorescence spectrophotometer, with the emission range of 500–650nm under the 494nm excitation light.
2.4 Biolayer Interferometry
The SA-coated chip was firstly immersed in a binding buffer for equilibration. Then 250nmolL–1of biotin-mo- dified anti-OA aptamer was loaded and bound to the sur- face of the SA-coated chip. The anti-OA aptamer-func-tionalized chip was then immersed in a buffer solution anda sample solution containing OA (31.25–500nmolL–1), re- spectively. Due to the specific binding between the apta- mer and the target molecule, the biofilm layer thickness was further increased. Finally, the chip was immersedin a buffer solution for dissociation, with OA releasing from the chip surface, resulting in a decrease in the thickness of the biofilm layer. The assay process includes five steps:baseline, 120s; loading, 180s; baseline2, 180s; association,300s; dissociation, 300s. The BLI works based on moni- toring the light interference. Through real-time monitor- ing of the thickness of the biofilm layer and transducing it into BLI signal, and fitting the concentration-signal responsecurve, the dissociation constant of the aptamer and OA was thus obtained.
2.5 Preparation of the AuNPs
The 13nm AuNPs were prepared according to the clas- sical procedure, by reducing chloroauric acid with sodium citrate solution (Wang., 2016). The TEM image and hydrodynamic diameter of AuNPs were obtained by JEM- 2100 and Zetasizer Nano ZS 90, respectively. And the final concentration of AuNPs was measured based on the ab- sorbance at 520nm by UV-2550 Spectrophotometer and calculated based on Lambert Beer’s law. And the AuNPs were concentrated to 15nmolL–1before use.
2.6 Construction of the Label-Free Colorimetric Aptasensor
A final concentration of citrate buffer with a concentra- tion of 10mmolL–1(pH 3.0) was used to protonate the polyA-aptamer, followed by adding it into the 15nmolL–1AuNPs solution and incubating for 10min. Then30mmolL–1of HEPES buffer (pH 7.6) was added and incubated for 10min, adjusting the pH of the solution to be neutral. The polyA-aptamer-AuNPs complex was obtained thereof.
Then 20μL of OA was added to 80μL of polyA-apta- mer-AuNPs solution and incubated for 30min at room temperature. PDDA was added and incubated for another 10min, after which the absorbance of the solutions was measuredby a microplate reader. The ratio values of the peak absorbance at 520nm and 620nm were applied for the quantitation.
2.7 Pretreatment of Shellfish Samples
The pretreatment method of scallop samples refers to the method of Ramalingam. (2019). The scallop tissue was taken out and washed thoroughly with deionized water to remove excess impurities. After250mg of scallop tissue was homogenized by a blender, 1mL of 50% me- thanol was added and vortexed at room temperature for 5min and centrifuged at 4000rmin–1for 5min. The super- natant was separated into a new centrifuge tube, heated at 75℃ for 5min and centrifuged at 4000rmin–1for 5min. Finally, the supernatant was transferred to a new centri- fuge tube and stored at −20℃ for further experiments.
3 Results and Discussion
3.1 Schematic Illustration of the Study
Fig.1 shows whole design of this study. To exploit the binding capability of the anti-OA aptamer as much as pos-sible, the molecular docking (Fig.1A) was carried out to explore initially the binding interaction and recognition sites of anti-OA aptamer to OA, followed by the fluorescent as- say (Fig.1B) and the biolayer interferometry (BLI) (Fig.1C) to further verify the simulation results. The label-free co- lorimetric aptasensor was developed, after the molecular recognition mechanism of the OA aptamer was revealed.As shown in Fig.1D, the aptasensor responds based on theunique optical signal generated by the distance-dependent AuNPs. One terminal of the aptamer was connected with polyA (12nt). The protonated polyA immobilized the ap- tamer on the surface of the AuNPs, so that the binding site on the other terminal was fully exposed to OA. No label- ing wasneeded in the whole process. Moreover, the poly A-based immobilization is much more conductive to the ef- ficient, time-saving, and cost-effective preparation of AuNPs- aptamer complex. PDDA is a cationic polymer that cancause the aggregation of AuNPs (Shayesteh., 2019).The aggregation can be inhibited by free ssDNA aptamer, because PDDA can only bind with aptamer through elec- trostatic adhesion. However, in the presence of OA, the target will induce the adaptive conformational folding of the aptamer, leaving the PDDA free to be adsorbedonto the surface of the AuNPs, causing the aggregation of the AuNPs. Based on changes of color and absorbance, the ra- pid and visual detection was realized thereof.
3.2 Analysis of Molecular Docking
The molecular docking assay was performed to reveal the binding mechanism and binding sites. After the com- putational docking procedure, the optimal conformation was obtained, according to the principle of the lowest en- ergy value, with an energy value of −3.34kcalmol–1. As shown in Fig.2A, the white part represents the conforma- tional structure of the aptamer, and the pink represents the target OA. The target OA embedded in the major groove formed by the aptamer. In the partial enlarged diagram in Fig.2B, the gray part represents the structure of OA, and the adjacent bases, A8, C10, A11, A12, C13, T45, C46, T48, and G49, were the key binding bases simulated in the mo- lecular docking. Two hydrogen bonds were formed by C10- OA and T48-OA, with bond lengths of 2.087Å and 1.95Å (see the Fig.2C). Subsequently, in order to further con- firm the anti-OA aptamer binding site, the secondary struc- ture of the anti-OA aptamer was simulatedby Mfold on- line server. As shown in Fig.2D, there were four stem-loops which are generally considered to have high possibility to participate in the binding. Considering with all of the in- formation, it can be predicted that the stem-loops near the two terminals of the anti-OA aptamer play significant roles.

Fig.1 Schematic illustration the whole study. A, computational molecular docking; B, fluorescent assay; C, biolayer interferometry; D, schematic diagram of the label-free colorimetric aptasensor.

Fig.2 Computational simulation results of (A) molecular docking of anti-OA aptamer with OA; B and C, partial enlarged diagram of the key binding bases and hydrogen bond; D, secondary structure of the anti-OA aptamer.
3.3 Analysis of Fluorescent Assay and Biolayer Interferometry
To further verify the prediction results, a competitive fluorescent assay was performed to compare the binding ability of the two terminals,, 3’ and 5’ terminals. As shown in Fig.3A, when the aptamer modified with a quen- cher at the terminal was hybridized with its complemen- tary sequence modified with a fluorophore, the fluorophore and the quencher were drew close to each other, resulting in quenching of the fluorescent signals. And in the presence of OA, the terminals would participate in conformational folding in priority, and the complementary sequence was thus released to trigger the fluorescent signals. Fig.3B and Fig.3C exhibit the fluorescent signal spectra obtained bycomplementary competition at the 3’ and 5’ terminals of the aptamer after adding OA with different concentration gradients. With the increment of OA concentration, the fluo- rescent intensity gradually increased (Figs.3A, 3B), indi- cating the releasing amount of the complementary se- quences at the terminals of the aptamer, as well as the bind- ing capability of the terminals. Obviously, both the 3’ and 5’ terminals of the OA aptamer could bind with the target, which is in consistent with the simulation results. The con- centration-dependent change of fluorescent intensity was then used for comparison. The fluorescent signals before and after the target were measured, and the peak values were recorded as f1and f2, respectively. The rate of change of fluorescent intensity was then calculated through (f2−f1)/f1*100%. As shown in Fig.3D, the concentration-sig- nal change rate curves were obtained. The slope of the cur- ve (=24.28+11.97,2=0.9902) obtained with the com- petition at the 3’ terminal is obviously higher than that of the 5’ terminal (=17.61+1.463,2=0.9906), indicating the 3’ terminal of the anti-OA aptamer exhibit better bind- ing capability than the 5’ terminal, with the slope represent- ing the response sensitivity of the aptamer.
In order to further determine the binding ability of the two terminals, BLI was adopted for further verification. The anti-OA aptamer was immobilized with 3’ terminal that was close or away from the chip surface (Fig.4A). The response intensity caused by the binding was monitored.As shown in Fig.4B and Fig.4C, the signal responses in the two ways both increased with the OA concentration in-creasing. However, the dissociation constantmeasuredwith the 3’ terminal close to the chip surface (=2.02μmolL–1) was significantly higher than that (=1.320μmolL–1) with the 3’ terminal away from the chip surface, indicating that the 3’ terminal exhibit more significant rolethan the 5’ terminal, because the aptamer performed de- creased binding ability when the 3’ terminal was immobi- lized to meet with higher steric hindrance. And with the 3’ terminal away from the chip surface and exposed fully to OA, the aptamer showed better binding capability.
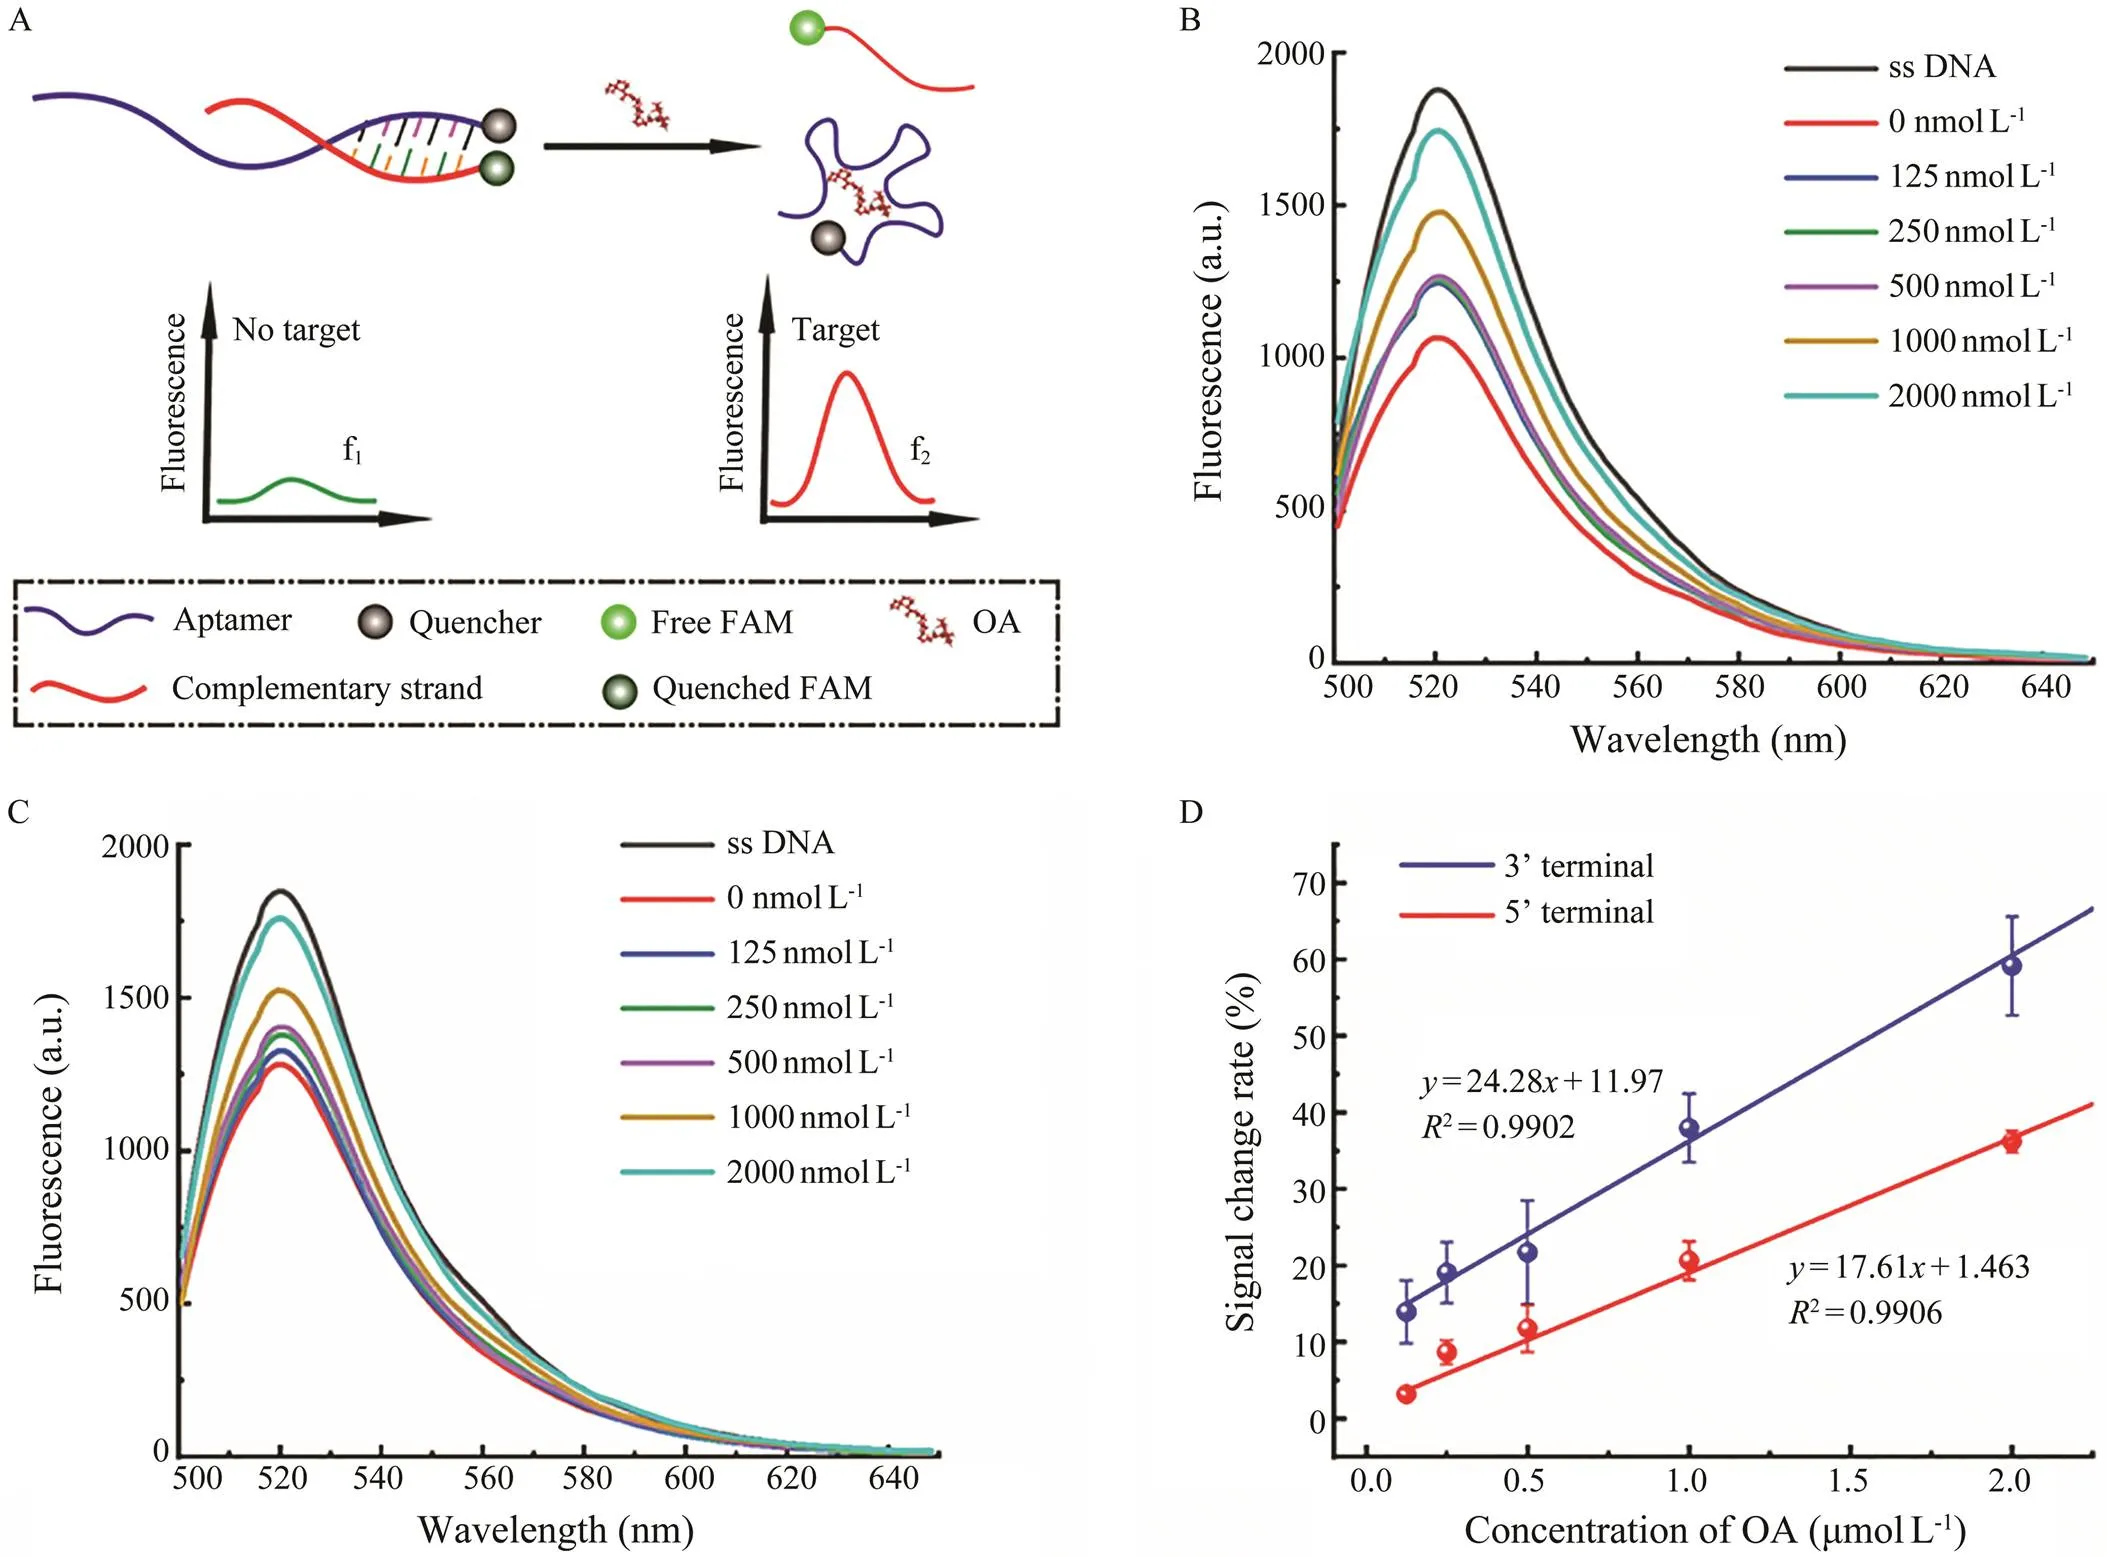
Fig.3 Schematic diagram and results of the fluorescent assay. A, schematic diagram; B, C, fluorescent spectra of the com- petition at the 3’ terminal and 5’ terminal; D, comparison of the signal change rates.
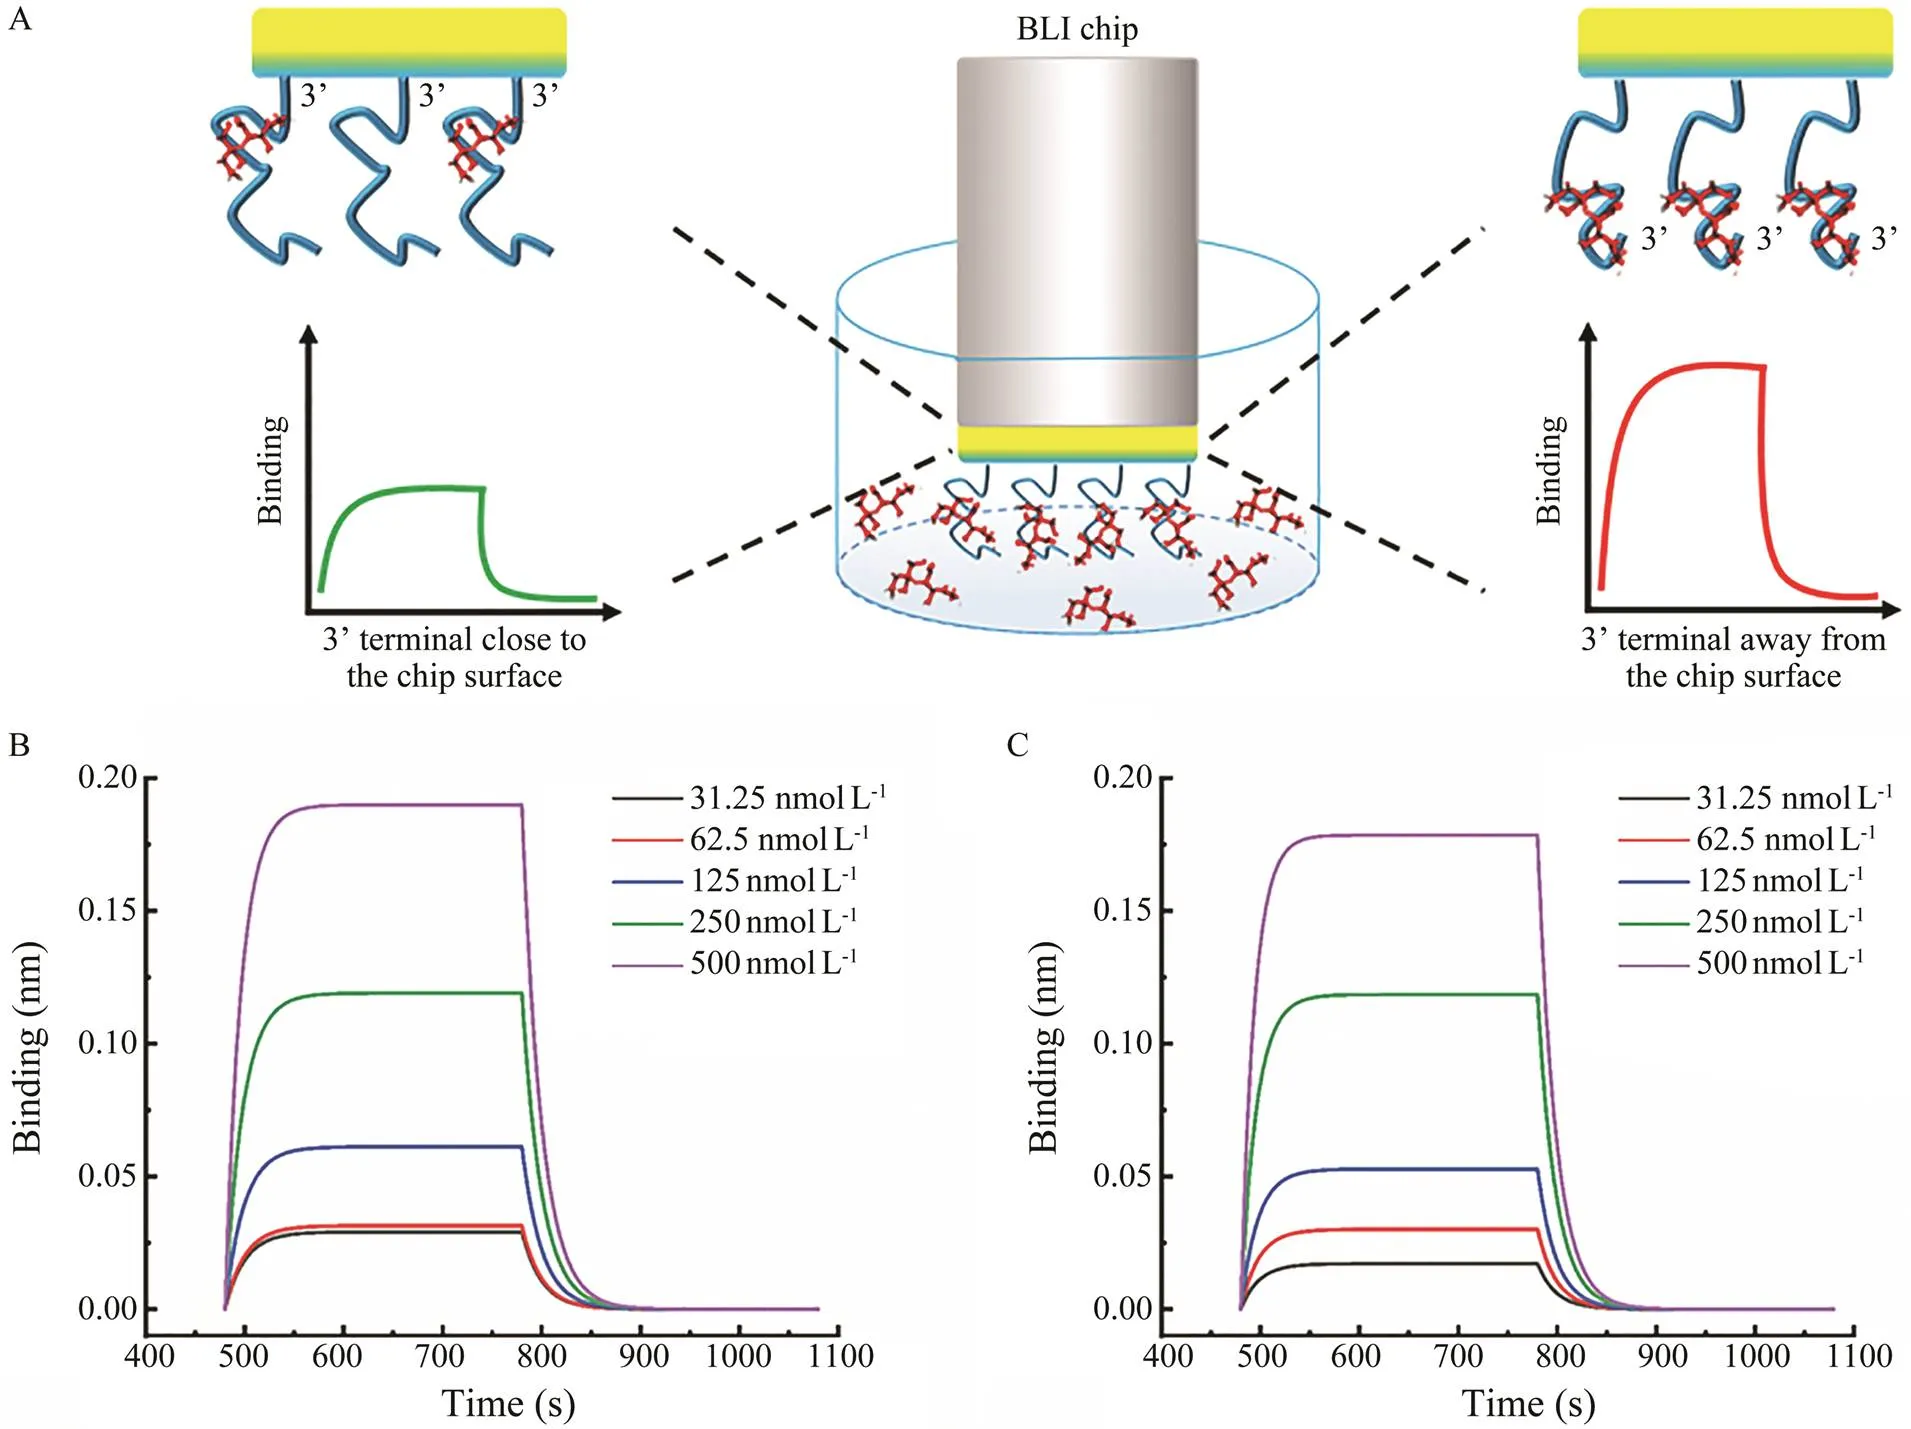
Fig.4 Schematic illustration and results of the biolayer interferometry. A, schematic illustration; B, C, the signal responses with 3’ terminal close (B) or away (C) from the chip surface.
3.4 Optimizations During the Development of the Label-Free Colorimetric Aptasensor
On the basis of the above results, the 3’ terminal was designed to be fully exposed to OA, and the 5’ terminal was modified with polyA to be absorbed on the surface of the AuNPs. In the absence of OA, the PDDA would bind with the aptamer, the solution color remained red. While inthe presence of OA, the free 3’ terminal folded to bind with OA in priority, making the whole aptamer responded sen- sitively, and the PDDA would absorb on to the AuNPs to induce aggregation.
The key parameters of the aptasensor and PDDA were optimized. Even without PDDA, the ion concentration in the binding buffer would destroy the charge distribution on the surface of the AuNPs. Therefore, the protective ef- fect of polyA in the polyA-aptamer on AuNPs was inves- tigated. As shown in Fig.5A, when the concentration of polyA-aptamer increased (0 to 2000nmolL–1), the color of the AuNPs solution gradually changed from blue to red.Finally,500nmolL–1was selected for the subsequent ex- periments, as the A620/A520 in Fig.5B reached saturated with the 500nmolL–1aptamer, indicating the good pro- tection of polyA against the ions.
Next, the concentration of PDDA was optimized. When excessive PDDA was added to the system, the positive charge of PDDA would adsorb onto the surface of the ne- gative charged AuNPs, causing the AuNPs to aggregate and turn blue (Shayesteh, 2020). The 500nmolL–1polyA- aptamers was used to protect the AuNPs.A suitable con- centration of PDDA was chosen, with which the aptamer just protected the AuNPs from aggregation. As shown in Fig.5C, when theconcentration of PDDA increased (0 to 10nmolL–1), the solution gradually changed from red to blue. A significance analysis of the ratio of A620/A520 was performed (Fig.5D).Finally, 1nmolL–1PDDA was chosen as no significant difference was observed when compared with the control group.
3.5 Calibration Curves and LOD of the Label-Free Colorimetric Aptasensor
OA with a series of concentrations (0–1200nmolL–1) was analyzed. As shown in Figs.6A, 6B, AuNPs aggre- gated gradually when the concentration of OA increased.The color of the solution changed from red to blue, and the responsesignal gradually increased. As shown in Fig.6C, A620/A520 is positively correlated with the OA concen- tration, and the linear equation is=0.8147+0.1747 (2=0.9791), with a linear range of 100–1200nmolL–1. The LOD of the colorimetric aptasensor was calculated to be 41.30nmolL–1by using the formula LOD=3α/S, where α represents the standard deviation from the blank, S re- presents the slope of the linear curve (Wu, 2012). The LOD was much lower than the maximum allowable addition amount specified by the European Union. More- over, compared with the existing methods, our developed aptasensor in this study showed great advantages. Immu- no-sensors, such as the electrochemical immunoassays, im- munochromatographic assays, enzyme-linked immunosor-bent assays depend on antibodies. For these methods, there are some disadvantages,such ascomplicated generation of antibodies, high cost, high requirement of specific stor- age conditions, and potential invalidation of the binding capability of the antibodies. The aptamer-based colorimet- ric sensor designed in the present study has the advan-tages of high sensitivity and selectivity, simple operation,rapid response with visualization, and low cost, showing great potential to act as powerful tool in the efficient de- tection of OA from real world samples.

Fig.5 Optimizations during the development of the colorimetric aptasensor. A, B, responses with different concentrations of polyA-aptamer; C, D, responses with different concentrations of PDDA. Significance analysis was characterized by P value using two-tailed T-tests.
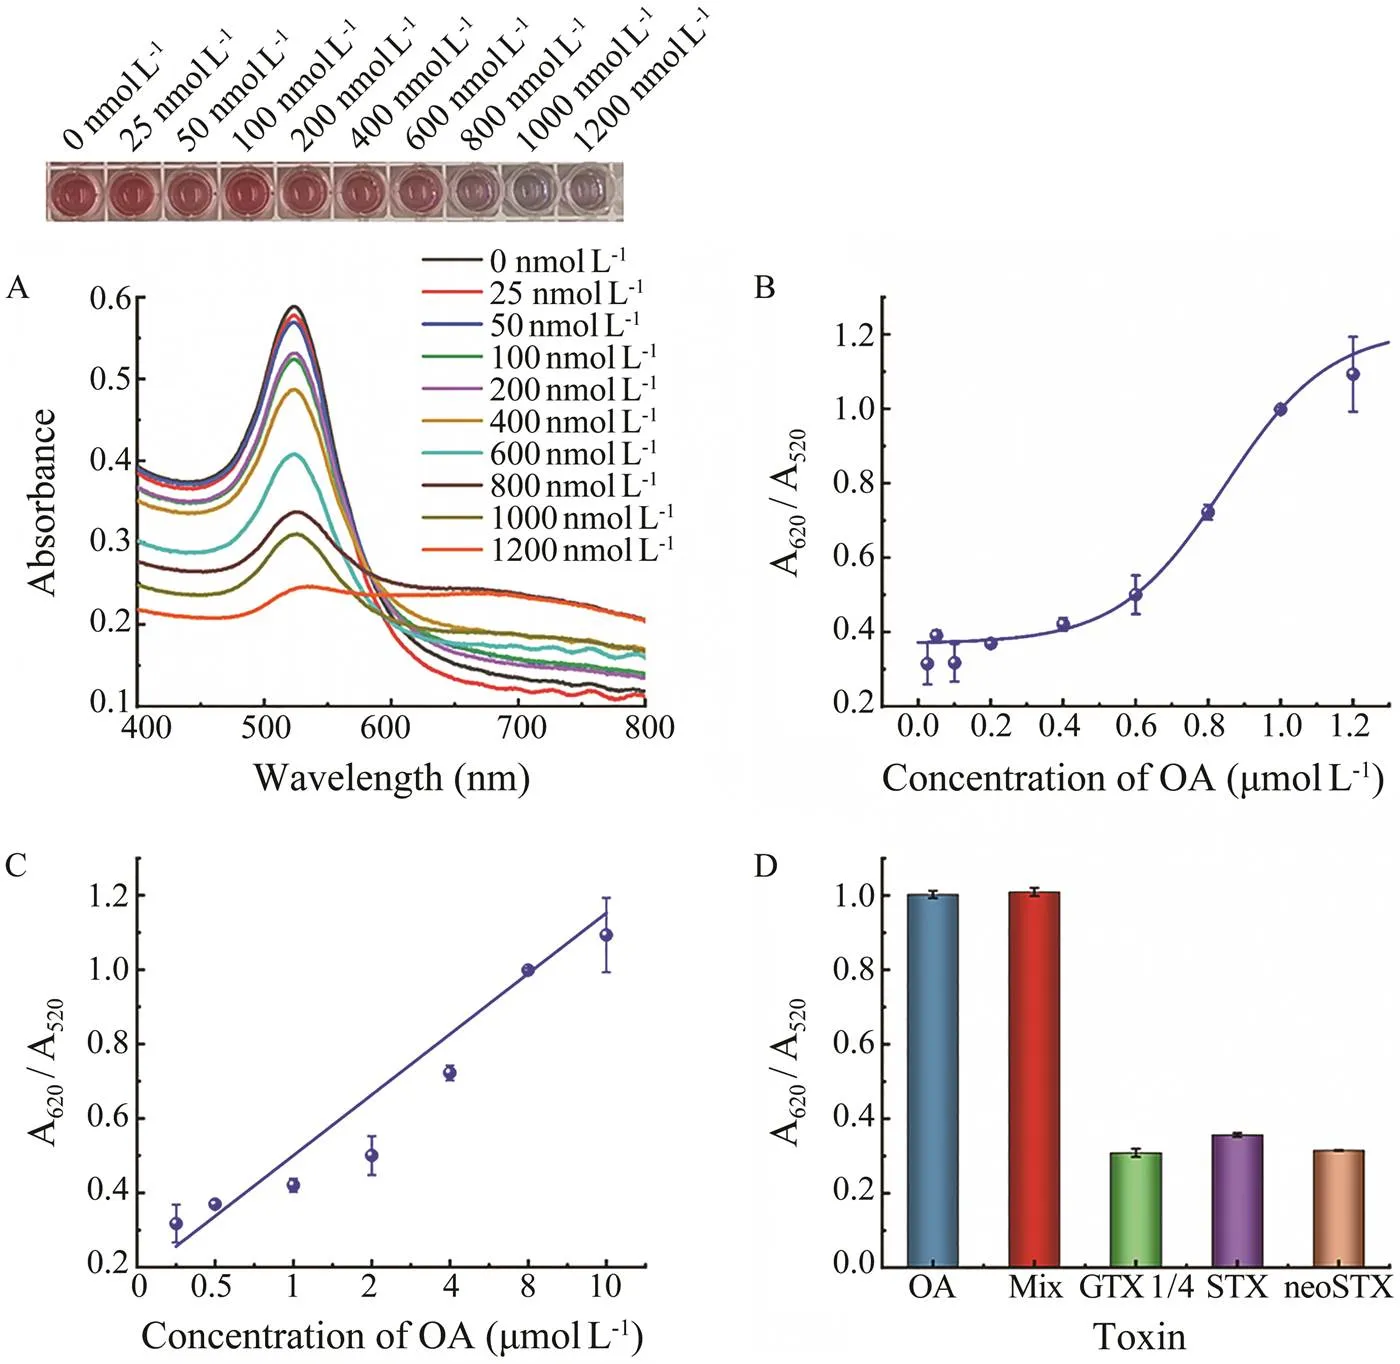
Fig.6 Responses and evaluation of the colorimetric aptasensor. A, absorbance spectra and colorimetric response; B, response curve; C, linear curve; D, sensitivity assay results.
3.6 Detection of OA in Real Samples
In order to verify the accuracy and repeatability of the colorimetric aptasensor in detecting OA, three OA samples with different concentrations (200, 400, 800nmolL–1) were added to shellfish samples and analyzed by the ap- tasensor. As shown in Table 1, the recovery rates of the ap-tasensor was between 91.6%–106.2%, with RSD below1.848%, indicating that the aptasensor had high accuracy and repeatability.
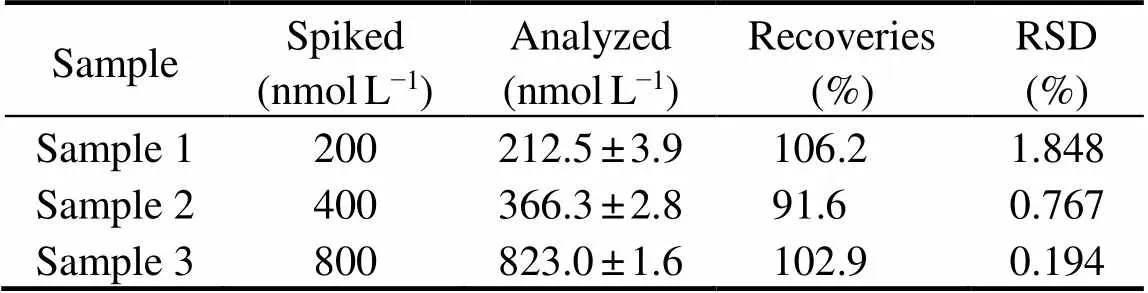
Table 1 Recovery assay results of the label-free colorimetric aptasensor
3.7 Selectivity of the Colorimetric Aptasensor
In order to explore the selectivity of the designed colori- metric aptasensor for OA, this colorimetric aptasensor was tested with 1000nmolL–1different marine toxins such as GTX 1/4, STX, and neoSTX. The signal response values obtained are shown in Fig.6D. It can be clearly indicated that the colorimetric aptasensor showed a strong selecti- vity towards OA rather than towards other toxins, as only samples containing OA caused significant responses.
4 Conclusions
In summary, a label-free colorimetric aptasensor towards OA was developed. The aptamer was rationally utilized in the aptasensor, based on the studies of the inherent mole- cular recognition mechanism by computational molecular docking, fluorescence assay, and biolayer interferometry. The 3’ terminal showed a dominate role, and the fully ex- posed 3’ terminal contributed greatly to the high sensitivity. The aptasensor provided a limit of detection of 41.30nmolL–1, which is much lower than the maximum allowable amount of the European Union.It also showed a wide li-near range of 100–1200nmolL–1, excellent recovery rates of 91.6%–106.2%,and good selectivity. The whole detec- tion process could be completed within 1h. Hopefully, thisstudy not only provides a novel rapid detection method for the highly sensitive and specific detection of OA, but also provides a reference for the further application of novel aptasensors in the field of food analysis.
Acknowledgement
This research was funded by the National Natural Science Foundation of China (No. 31801620).
Ardjomandi, N., Niederlaender, J., Aicher, W. K., Reinert, S., and Alexander, D., 2013. Identification of an aptamer binding to human osteogenic-induced progenitor cells., 23 (1): 44-61, DOI: 10.1089/nat.2012.0349.
1.2 实验材料 凝胶成像仪、PCR扩增仪、实时荧光定量PCR扩增仪、离心机、酶标仪购自美国BIO-RAD公司;Trizol、SYBR Green PCR premix购自美国Invitrogen公司;反转录试剂盒Revert Aid TM First strand cDNA synthesis Kit购自加拿大Fermentas公司。
Campàs, M., Prieto-Simón, B., and Marty, J. L., 2007. Biosen- sors to detect marine toxins: Assessing seafood safety., 72 (3): 884-895, DOI:10.1016/j.talanta.2006.12.036.
Eissa, S., Ng, A., Siaj, M., Tavares, A. C., and Zourob, M., 2013. Selection and identification of DNA aptamers against okadaicacid for biosensing application., 85 (24): 11794-11801, DOI: 10.1021/ac402220k.
Ellington, A. D., and Szostak, J. W., 1990.selection of RNA molecules that bind specific ligands., 346 (6287): 818-822, DOI: 10.1038/346818a0.
Farzin, L., Shamsipur, M., and Sheibani, S., 2017. A review: Ap- tamer-based analytical strategies using the nanomaterials for environmental and human monitoring of toxic heavy metals., 174: 619-627, DOI: 10.1016/j.talanta.2017.06.066.
Garibo, D., Campbell, K., Casanova, A., de la Iglesia, P., Fer- nández-Tejedor, M., Diogène, J.,., 2014. SPR immuno- sensor for the detection of okadaic acid in mussels using mag- netic particles as antibody carriers., 190: 822-828, DOI: 10.1016/j.snb.2013.09.037.
Gu, H., Hao, L., Duan, N., Wu, S., and Wang, Z., 2017. A com- petitive fluorescent aptasensor for okadaic acid detection as- sisted by rolling circle amplification., 184 (9): 1-7, DOI: 10.1007/s00604-017-2293-1.
Hu, X., Wang, Y., Tan, Y., Wang, J., Liu, H., Wang, Y.,., 2017. A difunctional regeneration scaffold for knee repair based on aptamer-directed cell recruitment., 29 (15): 1605235, DOI: 10.1002/adma.201605235.
Kawatsu, K., Kanki, M., Harada, T., and Kumeda, Y., 2014. A highly rapid and simple competitive enzyme-linked immuno- sorbent assay for monitoring paralytic shellfish poisoning to- xins in shellfish., 162: 94-98, DOI: 10.1016/j. foodchem.2014.04.038.
Kjetil, B., Wyman, J., Carmichael, W., and Dabholkar, A., 1988. Isolated rat liver perfusion studies with cyclic heptapeptide to- xins ofand(freshwater cyanobacteria)., 26 (9): 827-837, DOI: 10.1016/0041-0101(88)90324-8.
Ling, S., Li, X., Zhang, D., Wang, K., Zhao, W., Zhao, Q.,., 2019. Detection of okadaic acid (OA) and tetrodotoxin (TTX) simultaneously in seafood samples using colloidal gold immu- noassay.,165: 103-109, DOI: 10.1016/j.toxicon.2019. 04.011.
Louppis, A. P., Badeka, A. V., Katikou, P., Paleologos, E. K., and Kontominas, M. G., 2010. Determination of okadaic acid, di- nophysistoxin-1 and related esters in Greek mussels using HPLC with fluorometric detection, LC-MS/MS and mouse bioassay., 55 (4): 724-733, DOI: 10.1016/j.toxicon.2009.10.026.
Masanori, K., Toshihiko, Y., Michio, M., Takeshi, Y., Marie, K., Patrick, L.,., 2014. Okadaic acid as the causative toxin of diarrhetic shellfish poisoning in Europe., 50: 2853-2857, DOI: 10.1080/00021369. 1986.10867817.
Nutiu, R., and Li, Y., 2010.selection of structure-switch-ing signaling aptamers., 117 (7): 1085- 1089, DOI: 10.1002/ange.200461848.
Pan, Y., Wan, Z., Zhong, L., Li, X., Wu, Q., Wang, J.,., 2017. Label-free okadaic acid detection using growth of gold nanoparticles in sensor gaps as a conductive tag.,19 (2): 33, DOI: 10.1007/s10544-017-0162-7.
Paredes, I., Rietjens, I. M. C. M., Vieites, J. M., and Cabado, A. G., 2011. Update of risk assessments of main marine biotoxins in the European Union., 58 (4): 336-354, DOI: 10. 1016/j.toxicon.2011.07.001.
Qi, M., Tu, C., Dai, Y., Wang, W., Wang, A., and Chen, J., 2018. A simple colorimetric analytical assay using gold nanoparti- cles for specific detection of tetracycline in environmental wa-ter samples.,10 (27): 3402-3407, DOI: 10. 1039/C8AY00713F.
Ramalingam, S., Chand, R., Singh, C. B., and Singh, A., 2019.Phosphorene-gold nanocomposite based microfluidic aptasen- sor for the detection of okadaic acid.,135: 14-21, DOI: 10.1016/j.bios.2019.03.056.
Sassolas, A., Catanante, G. L., Hayat, A., Stewart, L. D., Elliott, C. T., and Marty, J. L., 2013. Improvement of the efficiency and simplification of ELISA tests for rapid and ultrasensitive detection of okadaic acid in shellfish., 30 (1): 144-149, DOI: 10.1016/j.foodcont.2012.05.028.
Shayesteh, O. H., and Ghavami, R., 2019. Two colorimetric am- picillin sensing schemes based on the interaction of aptamers with gold nanoparticles., 186 (7): 485, DOI: 10.1007/s00604-019-3524-4.
Shayesteh, O. H., and Khosroshahi, A. G., 2020. A polyA apta- mer-based label-free colorimetric biosensor for the detection of kanamycin in human serum., 12 (14): 1858-1867, DOI: 10.1039/D0AY00326C.
Song, S., Wang, L., Jiang, L., Fan, C., and Zhao, J., 2008. Apta- mer-based biosensors.27 (2): 108-117, DOI: 10.1016/j.trac.2007.12.004.
Toh, S. Y., Citartan, M., Gopinath, S. C. B., and Tang, T. H., 2015. Aptamers as a replacement for antibodies in enzyme-linked immunosorbent assay., 64: 392- 403, DOI: 10.1016/j.bios.2014.09.026.
Tuerk, C., and Gold, L., 1990. Systematic evolution of ligands by exponential enrichment: RNA ligands to bacteriophage T4 DNApolymerase., 249 (4968): 505-510, DOI: 10.1126/science. 2200121.
Vanessa, V., María, P. F., Eduardo, P., Josefina, M., and Blanca, L., 2013. Okadaic acid: More than a diarrheic toxin., 11 (11): 4328-4349, DOI: 10.3390/md11114328.
Vdovenko, M. M., Hung, C. T., Sakharov, I. Y., and Yu, F. Y., 2013. Determination of okadaic acid in shellfish by using a no- vel chemiluminescent enzyme-linked immunosorbent assay me-thod., 116: 343-346, DOI: 10.1016/j.talanta.2013.05. 057.
Wang, J., Wang, Y., Hu, X., Zhu, C., Ma, Q., Liang, L.,., 2019.Dual-aptamer-conjugated molecular modulator for detecting bioactive metal ions and inhibiting metal-mediated protein ag- gregation., 91 (1): 823-829, DOI: 10.1021/ acs.analchem.8b03007.
Wang, S., Gao, S., Sun, S., Yang, Y., Zhang, Y., Liu, J.,., 2016. A molecular recognition assisted colorimetric aptasensor for tetracycline., 6 (51): 45645-45651, DOI: 10. 1039/C6RA08262A.
Wang, Y., Rao, D., Wu, X., Zhang, Q., and Wu, S., 2020. Apta- mer-based microcantilever-array biosensor for ultrasensitive and rapid detection of okadaic acid., 60(Part A): 105644, DOI: 10.1016/j.microc.2020.105644.
Weng, X., and Neethirajan, S., 2018. Paper-based microfluidic ap-tasensor for food safety., 38 (1): e12412, DOI: 10.1111/jfs.12412.
Wu, Y., Zhan, S., Wang, F., He, L., Zhi, W., and Zhou, P., 2012. Cationic polymers and aptamers mediated aggregation of gold nanoparticles for the colorimetric detection of arsenic(III) in aqueous solution.,48 (37): 4459- 4461, DOI: 10.1039/c2cc30384a.
Wu, Z. Q., Wang, B. C., Sun, Y. B., and Liu, Y., 2015. Improve- ment of determination method of okadaic acid in shellfish by liquid chromatography-tandem mass spectrometry., DOI: 10.19812/j.cnki.jfsq11-5956/ts. 2015.01.046.
Yu, X., and Jiang, Z., 2011. Aptamer-based fluorescence nano- probe for sensitive and selective detection of potassium., 44 (5): 898-907, DOI: 10.1080/000327110037 90031.
Zhao, L. P., Yang, G., Zhang, X. M., and Ou, F., 2020. Develop- ment of aptamer screening against proteins and its applications., 48 (5): 560-572, DOI: 10.1016.S1872-2040(20)60012-3.
November 24, 2020;
January 22, 2021;
April 20, 2021
© Ocean University of China, Science Press and Springer-Verlag GmbH Germany 2022
. E-mail: wangsai@ouc.edu.cn
(Edited by Qiu Yantao)
猜你喜欢
杂志排行

Journal of Ocean University of China的其它文章
- Study of the Wind Conditions in the South China Sea and Its Adjacent Sea Area
- A Spatiotemporal Interactive Processing Bias Correction Method for Operational Ocean Wave Forecasts
- Characteristics Analysis and Risk Assessment of Extreme Water Levels Based on 60-Year Observation Data in Xiamen, China
- Underwater Target Detection Based on Reinforcement Learning and Ant Colony Optimization
- Polar Sea Ice Identification and Classification Based on HY-2A/SCAT Data
- Thermo-Rheological Structure and Passive Continental Margin Rifting in the Qiongdongnan Basin,South China Sea, China