Study on the sequence of morphological and angiographic changes due to intraocular pressure elevation in the optic nerve head
2022-02-18
Department of Ophthalmology,Tongji Hospital, Tongji Medical College, Huazhong University of Science and Technology, Wuhan 430030, Hubei Province, China
Abstract
• KEYWORDS: blood flow; optical coherence tomography; optic nerve head; deformation
INTRODUCTION
Two principal theories for the pathogenesis of glaucomatous optic neuropathy have been described for decades-a mechanical and a vascular theory. The laminar region of the optic nerve head (ONH) is the major site of damage to retinal ganglion cell (RGC) axons in glaucoma[1]. According to the mechanical theory, the biomechanical transmission of stress from intraocular pressure (IOP) generates detrimental effects on RGC axons, ONH astrocytes, and nutritional blood flow in the nerve head. However, up until now, whether or not an increased IOP has an effect on the retinal blood supply has not been determined. Recent studies using optical coherence tomography angiographys (OCTA) have demonstrated that the retinal blood flow in the ONH decreases significantly with a sharp increase in the IOP[2-4].
In animal experiments, the dynamic changes of retinal blood flow can be observed[5], while in glaucoma patients, the ONH blood flow differences represent only a given stage of glaucoma, and the blood flow change can be caused by the disc microcirculation disturbance itself or in conjunction with elevated IOP. Therefore, it is important to discuss the effect of a sharp IOP increase on optic disc perfusion healthy subjects. Measuring vessel density (VD) within the ONH and the macula, defined as the percentage of the angiocube occupied by retinal vessels, has increased in popularity and represents a promising early detection for primary open angle glaucoma[6]. Its reliability has been fully validated[7]. En face OCTA can be further postprocessed to obtain quantitative, objective metrics. Moreover, the enhanced depth imaging (EDI)-OCT B-scans clearly show enhanced imaging of the lamina cribrosa[8]. We performed VD measurements in the ONH and in the macular region by OCTA and ONH deformation measurements by EDI-OCT in healthy subjects during and after IOP elevation.
SUBJECTS AND METHODS
SubjectsThe study protocols were approved by the Ethics Committee of Tongji Hospital and registered with the Chinese Clinical Trials Registry (No.ChiCTR-ROC-16008832). Written informed consent was obtained prior to enrollment from all the participants, in accordance with the tenets set forth in the Declaration of Helsinki. This study comprised 34 left eyes from 34 healthy subjects, who were recruited from volunteers at Huazhong University of Science and Technology, China. All the subjects were interviewed regarding their detailed medical histories and underwent thorough ophthalmological examinations, which included best corrected visual acuity (BCVA), refractive status using autorefraction; central corneal curvature and axial length (AL) using IOL Master (version 3.01; Carl Zeiss Meditec, Jena, Germany).
ResearchProcedureIn the left eye of each subject in group A, the IOP was raised by using an ophthalmodynamometer (Luneau L150, Luneau Technology, Pont-de-l’Arche, France) held perpendicular to the anterior sclera to gently apply an external force through the temporal side of the lower eyelid. The force applied was 0.10 N (Newton) and then 0.15 N. During each IOP elevation, the IOP was held constant for two minutes and measured in the sitting position using an I-care rebound tonometer (I-Care Finland Oy, Vantaa, Finland). Meanwhile, the OCTA and OCT were measured while the indenter was held in place. There was a 30min interval between the two IOP measurements. In the left eye of each subject in group B, the IOP was raised by a force of 0.15 N for ten minutes and the same measurements as group A were taken.
OCTAImageAcquisitionandAnalysisOCTA images centered on the fovea and optic disc were obtained using spectral-domain optical coherence tomography (SD-OCT) (Spectralis, Heidelberg Engineering, Heidelberg, Germany). Images taken after the baseline visit were acquired using the follow-up function. The OCTA image acquisition parameters were as follows: scanning area of macula scanning area and automatic real-time (ART)=7, and scanning area of optic disc was 3×3 mm2/ 3×1.5 mm2and ART=5. OCTA images with poor quality (signal strength index of less than 30) or signal loss for more than three times due to eye movement were excluded from our research. Automatic segmentation of the full thickness, including internal limiting membrane to Bruch’s membrane (BM), retina vasculatures, superficial capillary plexuses (SCP), and deep capillary plexuses (DCP), were obtained by Spectralis Software (Heidelberg Eye Explorer, Version 1.9.11.0, Heidelberg Engineering, Heidelberg, Germany) and manually adjusted in the case of segmentation errors.
For the OCTA en face image, we used Photoshop to crop the optic disc, remove the first and second large-scale blood vessels, and then convert the full retinal en face image of the optic disc area into a grayscale image for binarization (threshold value=30). Then the ratio of blood vessel density was automatically calculated. A region of 256×256 pixels centered on the fovea were cropped and converted into a grayscale image using Image J 1.50 (National Institutes of Health, Bethesda, MD, USA) to binarize and calculate the ratio of blood VD. The Image J mean threshold, which automatically calculates the threshold as the mean of the local grayscale distribution, was applied to each image. The binarized 8-bit image was converted to an RGB color model. The macular area was contoured and colored to pure blue. White pixels were considered vessel, black pixels were considered background, and blue pixels were automatically excluded from the analysis. VD was calculated as the ratio between white pixels and the total pixels after macular region exclusion[9-10].
OCTImageAcquisitionandAnalysisSD-OCT to scan using enhanced depth imaging (EDI) mode. Horizontal and vertical images centered on the fovea and four radial OCT B-scans at intervals of 45 degrees centered on the optic disc were obtained (Figure 1A).
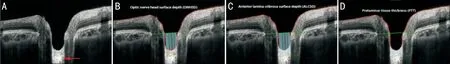
Figure 1 An OCT optic disc image A: The position of the anterior lamina was clear in OCT images. Even the hyporeflective sheets where the axons of the RGC pass through the pores of the lamina cribrosa (red arrow) can be seen; B: The ONHSD represents the perpendicular distances from the BMO reference line (green) to the ONH surface (red); C: The ALCSD represents the perpendicular distances from the BMO reference line (green) to the detectable LC surface (orange); D: Measurement of the PTT. The blue lines are for illustrative purposes and do not represent all the lines the software measured.
ONHParametersMeasurementThe scaling factor (micrometers/pixel) for individual scan was taken from the built-in software and applied in the customized program for calculation of the ONH. On each radial sector image, points were marked at the position of the edge of BM on either side of the disc and along BM away from the nerve head for several points. Each of these points was given (x, y) coordinates in micrometers, with the lower left portion of the image as (0, 0). The optic nerve head surface depth (ONHSD) represented the perpendicular distance from the reference line joining the Bruch’s membrane opening (BMO), to the ONH surface. It was calculated by dividing the ONH surface area by the BMO distance. The ONH surface area was defined as the area between the reference line joining the BMO and two perpendicular lines linking the ONH surface and the reference line (Figure 1B). The anterior lamina cribrosa surface depth (ALCSD) was calculated by dividing the anterior lamina cribrosa (LC) area (Figure 1C) by the BMO distance. The prelaminar tissue thickness (PTT) was the distance between the ONH and the detectable anterior LC surface (Figure 1D). We performed the curve fitting to establish the polynomial function of the anterior LC surface (y1=a1×x4+a2×x3+a3x2+a4x+a5) and the ONH surface (y2=a1×x4+a2×x3+a3x2+a4x+a5) using MATLAB software (R2016a, The Mathworks Inc., Natick, MA, USA). Therefore, the PTT was calculated as follows: PTT=|y1-y2|.
Table 1 Demographic and clinical characteristics of the 34 study participants
ChoroidalThicknessMeasurementChoroidal thickness is defined as the distance from the inferior margin of the retinal pigment epithelium to the choroid-sclera interface. The San Diego Automated Layer Segmentation Algorithm (SALSA) was used to define choroidal thickness in each B-scan. The subfoveal choroidal thickness (SFCT) and peripapillary choroidal thickness, which include a total of eight points at 1500 μm superior, inferior, nasal, temporal, superior-nasal, inferior-nasal, superior-temporal, and inferior-temporal areas to the edge of the optic disc, and the average of the eight measurements was calculated. Those with an OCT image quality of less than 30 were excluded. All the measurements were analyzed by two independent operators.
RESULTS
DemographicandClinicalCharacteristicsA total of 40 Chinese subjects were recruited, of whom 6 were excluded for the following reasons: 3 had tilted optic discs, 2 had poor image quality due to uncorrectable blood vessel shadowing, and 1 subject had amblyopia. Therefore, a total of 34 subjects were included, and all the subjects participated in the study without any side effects. The subjects’ characteristics were shown in Table 1.
During the first IOP elevation for group A, the SCP VD in the ONH decreased significantly from the baseline (P=0.004), and there were no changes of the BMO distance, the ONHSD, the anterior lamina cribrosa surface depth (ALCSD), the PTT, the VD in the macular region, or the SFCT. During the second IOP elevation for group A, the VD in both the ONH and in the macular region decreased (P<0.05), the BMO distance and the ONHSD increased (P<0.05), and the ALCSD, the PTT, and the SFCT did not change (P>0.05). The VD and ONH deformation returned to normal 30min after the IOP elevation (Table 2).
During the IOP elevation for group B, the VD in the ONH decreased significantly from the baseline (SCP: baseline 42.34±7.13%, after IOP elevation 39.57±5.83%,P<0.05), the VD in the macular region decreased (SCP: baseline 43.34±9.13%, after IOP elevation 39.27±6.51%,P<0.05). The BMO distance increased (baseline 1769.63±114.43 μm,after IOP elevation 1857±98.72 μm,P<0.05), the ONHSD increased (baseline 183.82±32.37 μm, after IOP elevation 217.20±47.23 μm,P<0.05), and the SFCT decreased (baseline 214.69±76.32 μm, after IOP elevation 198.14±81.12 μm,P<0.05). The ALCSD and the PTT did not change (ALCSD: baseline 421.45±112.57 μm, after IOP elevation 443.59±141.83 μm; PTT: baseline 183.82±32.37 μm, after IOP elevation 217.20±47.23 μm,P>0.05).

Figure 2 Correlation analysis A: There’s significant correlation of VD of SCP in macula and in ONH (r2 =0.38; P<0.01); B: There’s significant correlation of VD of SCP in macula and AL (r2 =0.464; P=0.02).
Table 2 Changes in IOP, VD in the ONH and the macular region, and ONH deformation and choroidal thickness of group A
CorrelationAnalysisWe evaluated the relationship between the VD in the ONH tissue and BMO distance increment and found that VD in the ONH tissue is not associated with BMO distance increment (r=0.050,P>0.05). We calculated VD only in the SCP to avoid projection artifacts seen with deep vessel density measurements of the DCP. A linear regression analysis showed that the VD in the retina had no correlations with the choroidal thickness (P>0.05). The Pearson correlation analysis showed that the VD in the macular region had significant correlation with the VD in the ONH (r2=0.382,P<0.01) (Figure 2A). The VD in the macular region was correlated with the AL (r2=0.464,P=0.02) (Figure 2B), but there was no correlation with spherical equivalent refraction (SER) (r=0.393,P=0.096). The VD in the ONH showed no correlation with the axial length (AL) (r=0.051,P=0.834) and no correlation with SER (r=0.036,P=0.882).
ReproducibilityAnalysisThe reproducibility analysis showed that intraobserver reproducibility was higher than interobserver reproducibility and that VD reproducibility was lower than the other parameters. If the value is less than 0.4, the repeatability is poor; if the value is greater than 0.75, the repeatability is satisfactory. Interscan reproducibility of the macular region area was very strong (ICC>0.85) at every plexus. All the ICC results noted below were satisfactory (Table 3).
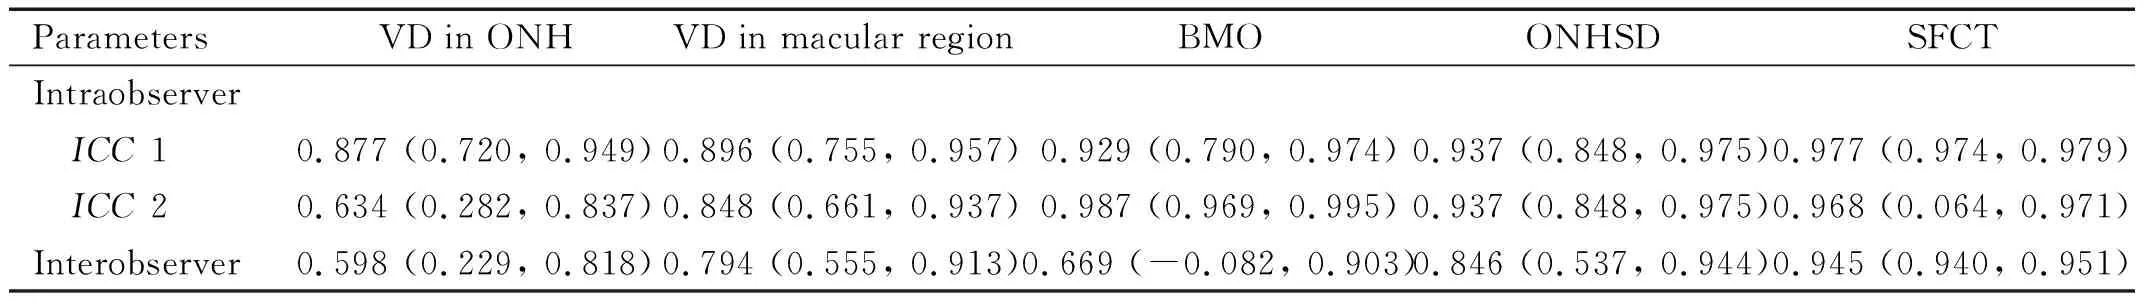
Table 3 Reproducibility of measurement parameters [ICC (95%CI)]
DISCUSSION
We found that when intraocular pressure rises sharply, theblood flow in the ONH is significantly reduced, consistent with other studies[11-12]. However, the research by Zhangetal[13]indicated that an acute IOP elevation less than 20 mmHg for one hour following laser peripheral iridotomy did not affect the vessel density in the macula or ONH when examined by OCTA in subjects with narrow anterior chambers, and suggested that only large IOP fluctuations could cause changes in blood flow. On the contrary, our study revealed that an IOP increase of 15 mmHg caused a decrease VD in ONH significantly. The reason for the inconsistent results may be that in our study, the IOP was increased by mechanical pressure instead of a complex change caused by inflammation. Our results revealed that an acute elevation of 35 mmHg in IOP had a stronger effect on the VD in both the ONH and the macular region.
In this study, the VD in the macular region did not change during the +15 mmHg phase but decreased significantly during the +30 mmHg phase, which suggested that the macular VD also responsed to temporary IOP fluctuation. Only a few studies have focused on macular vasculature density, and most of them have revealed a decreased VD in the macula[14-17], which supported our findings. The VD in the ONH decreased significantly during both the +15 mmHg and +30 mmHg phases, while the VD in the macular tissue decreased significantly only in the +30 mmHg phase. It is suggested that the VD in macular regions was less sensitive than the peripapillary VD. This is also consistent with the findings of Raoetal[18]study, in which the reduction in the peripapillary vessel density was nearly 14%, while it was about 6% in the parafoveal region in primary angle-closure glaucoma eyes. We conjecture that the hemodynamics in the ONH differ from in the macular tissue[19-20].
In several studies,after the IOP was acutely increased by a negative pressure suction cup on the sclera, the ONH VD reduction varied between approximately 15% and 50%; whereas we observed a reduction in VD of less than 10%[11,21]. The reason for this might be that this study took place in a homeostasis of blood flow regulation, or it might be due in part to discrepancy of measurement. In this study, the decreased VD in the macula or the ONH returned to normal half an hour after the IOP elevation, which showed the hemodynamic response to a sharp IOP elevation could be completely restored. When the IOP elevation lasted ten minutes (for the subjects in group B, the VD changes were similar to that of group A, which excluded viscoelastic effect and demonstrated that the duration of IOP elevation has little influence on hemodynamics in the retina.
According to the biomechanical theory, the LC is where retinal nerve fiber bundles exit from the eye and LC deformation plays an important role in the pathogenesis of glaucoma[22-23]. The position of the anterior lamina provides a recognizable contrasting border that delineates it from the prelaminar tissues. Thus, the anterior lamina cribrosa depth is considered to be a reliable parameter of the structural change and displacement of the lamina cribrosa[24]. In this study, the BMO distance and ONHSD increased with the increase of IOP, but ALCSD and PTT did not change significantly. These results demonstrate that there was posterior displacement of the ONH surfaces, but no posterior displacement of LC surfaces or prelaminar tissue thinning in the sharp IOP elevation. Perhaps the reason is that posterior deformation of the ONH surface was independent of prelaminar tissue loss and concomitant deformation of the anterior LC surface.
A more interesting question is whether there is a specific correlation of the reduction of ONH blood flow and the morphological change in the ONH tissue. Does the morphological change occur first and then impede the blood supply in the ONH tissue, or does it occur as a preexisting ischemic condition that primarily contributes to the mechanism of neural and connective tissue damage? Importantly, we found that VD in the ONH tissue had no correlation with BMO distance increment, and the VD in the ONH decreased significantly during both the +15 mmHg and +30 mmHg phases, while the BMO distance increased significantly only in the +30 mmHg phase. We speculated that hemodynamics is more sensitive to the IOP elevation than morphological change in the ONH tissue, and hemodynamics occurs first in a sharp IOP elevation. The reason may be that the nerve fiber bundles has strong compressive strength compared to vessels.
The choroid supports the oxygenation of the outer retina, but it remains unclear how thechoroidal blood supply participates in IOP regulation. Songetal[25]study revealed that peripapillary choroidal thickness was decreased in open angle glaucoma patients, and other studies[26-28]have considered increased choroidal thickness a risk factor for high IOP in primary angle-closure. However, we found that the choroidal thickness did not change during the IOP elevation. It is probably because that temporary IOP elevation does not lead to the choroidal thickness change.
The study has a few limitations. First, the accuracy of OCTA measurement was subject to certain limitations, as equipment from different manufacturers produce slightly different results and the interobserver reproducibility is relatively low. Second, out of consideration for the subjects’ safety and comfort, the IOP elevation lasted only up to ten minutes in this test, which could not fully reflect static autoregulation.
In conclusion, we observed VD reduction in the retina and choroid thickening in the ONH and in the macular region during IOP elevation at multiple IOP levels. Even more important, we observed the hemodynamics and mechanical change in the ONH at the same time and correlated them. This paper may thus provide a new approach to the missing links in the pathogenesis of high IOP by correlating the morphological evaluation of ONH structure with retinal blood flow.
