干旱绿洲农田无核白葡萄树蒸散发的分割研究
2022-01-26王尚涛赵楠张扬张琨朱高峰
王尚涛,赵楠,张扬,张琨,朱高峰
▪专家评述▪
干旱绿洲农田无核白葡萄树蒸散发的分割研究
王尚涛1,赵楠2,张扬2,张琨3,朱高峰2
(1.青海大学 水利电力学院,西宁 810016;2.兰州大学 资源环境学院,西部环境教育部重点实验室,兰州 730000;3.中国科学院 青藏高原研究所,北京 100101)
【】探究干旱绿洲区典型农田生态系统作物蒸腾蒸散特征及蒸腾占总蒸散的比值,为的研究提供数据支撑。联合运用树干液流(包裹式)、涡度相关法以及微气象观测系统于整个生长季(5—10月)对敦煌沙漠绿洲区无核白葡萄树(L.)的冠层蒸腾(Transpiration,)和总蒸散(Evapotranspiration,)特征进行了连续测定;并分析了不同生态系统及不同观测模拟手段下蒸散发的分割结果。生长季中,冠层蒸腾量从0.20 mm/d上升到生长中期的8.13 mm/d,然后逐渐下降至末期落叶时到达极小值,日均蒸腾量为3.32 mm/d。总蒸散发量由0.44 mm/d增加到9.97 mm/d,然后逐渐下降至末期到达极小值,日均总蒸散量为4.91 mm/d。生长季冠层蒸腾量()占总蒸散量()的值()约为63.5%。生长季内,干旱绿洲区农田系统无核白葡萄树冠层蒸腾是总蒸散的主要水分通量。
干旱绿洲区;无核白葡萄;树干液流;涡度相关;
0 引言
【研究意义】蒸散发主要包含土壤蒸发与植被蒸腾2个组分,其过程受植被根系分布、气孔导度和气象因素(辐射、水汽压差)等影响,是全球能水循环的重要环节[1-4]。研究表明,陆地生态系统每年通过蒸散发返回大气的降水有60%左右,而在干旱区农田生态系统高达90%[2, 5-7]。其中,蒸腾过程是蒸散发的主要分量,也是精准灌溉及水资源规划中不可或缺的数据之一[8]。因此,分析干旱绿洲区农田生态系统蒸腾及蒸散特征有助于理解区域水能循环过程,为揭示农田生态水文过程、精准灌溉等提供科学指导[9]。
【研究进展】目前,蒸散发的获取方法有水量平衡法(如蒸渗仪法)[10-12,16]、微气象法(涡度相关法、空气动力学法等)[13-15, 21-22]、各类数学模型(如大叶模型、双源模型、陆面过程模型)等[27-30],而其分割方法主要有稳定同位素法[8]、联合涡度相关与树干液流技术[14-15,31-32]、模型模拟等[7, 43, 45, 47]。【切入点】树干液流技术可以在野外精准连续测量单株耗水,然后进行升尺度处理,即可获得冠层尺度蒸腾[20, 23-26],再将其与涡动相关法所得总蒸散结果相比较,可进一步揭示区域农田生态系统蒸腾及总蒸散特征。【拟解决的关键问题】基于涡度相关和树干茎流技术,进行干旱绿洲农田无核白葡萄树蒸散发的分割研究,为进一步研究干旱绿洲农田生态水文过程、实施精细灌溉及提高水资源利用率提供依据[6]。
1 材料方法
1.1 研究区概况
研究区(94°06′E,39°55′N)位于敦煌市西南沙漠绿洲区境内,属暖温带干旱性气候。土壤类型为沼泽土和盐渍土等,多年平均0约2 400 mm,年日照时间3 115~3 247 h,年平均气温约为9.3 ℃,年均降水量36.9 mm[41]。地表植被均质,地势平坦,地下水埋深10~50 m。研究区灌溉水源来自河水补给,无核白葡萄为当地最主要作物[14-15, 33-34]。
试验田规模450 m×160 m(图1(a),图1(b)),篱架式栽植,架高约2.5 m,垄间距3 m,西北-东南朝向,棵间距约0.6 m,整个生长季长约180 d左右(4—10月),地表无其他覆盖物。研究区不同深度土壤干体积质量约为1.19~1.62 g/cm3,饱和持水率(质量含水率)约为25.77%~47.54%,田间持水率约为(质量含水率)18.99%~35.07%。试验地平均每20 d漫灌1次,灌溉水源稳定,灌水均匀度较好。观测期为整个生长季。

图1 研究区概况图,其中(a)、(b)、(c)、(d)、(e)分别表示研究区位置、试验田概况、葡萄园、树干液流以及涡度相关系统
1.2 试验设计
1.2.1 树干液流
采用包裹式茎流计(Dynamax, Houston, USA)测定(图1(b),图1(d))。选具有代表性不同胸径的6棵葡萄树(表1),生长季内连续监测。

表1 代表性葡萄树属性
液流速率(,g/s)计算式为:

式中:p为水的比热;Pn为总的输入热量(W);v和r分别为径向和竖向传导的热量(W);d为热电偶电压和的平均值()。上述参数可通过传感器测量、计算而得到。
冠层蒸腾速率(, mm/h)用“叶面积指数法”[14-15, 31],计算式为:

式中:为第棵树的叶面积(m2);为监测时段的叶面积指数;为样本量;为第样本的液流速率(kg/h),由式(1)中液流速率(,g/s)经量纲换算而得到。
1.2.2 蒸散发
采用涡度协方差法测定总蒸散发(图1(b)、图1(e))。冠层高度约2.0 m,仪器高度距地面4.0 m。如图1所示,研究区主风向为北风~东北风为主(60.7%),80%贡献度稳定-非稳定层结的源区长度约为150~250 m,满足要求。因此,研究区所测的通量数据基本来自葡萄下垫面[14,36]。采用EddyPro 6.0软件进行数据处理,剔除降水当天的数据[32, 36-38]。数据缺失2 h以内的采用线性插值,缺失较多的采用人工神经网络法插补[36]。涡度数据能量闭合率达到87%。符合70%~90%的可接受范围,数据质量良好[17-19]。
1.2.3 气象因子
实验样地内布设小型气象站(图1(e))。温湿度传感器用于测量不同高度的冠层温度和相对湿度;二维风速仪(5103, R. M. Young, USA)测量风速;传感器(LI-190R, LI-Cor, USA)获取光合有效辐射。此外,采用土壤水分传感器(ML2x, Delta T, UK)连续测量了不同深度处的体积含水率(图2(b))。采用翻斗式雨量筒(TE525, Texas Electronics, USA)测量降水。上述数据均用CR1000(Campbell, Logan, UT, USA)采集,0.5 h间隔。
1.2.4 土壤蒸发
采用内径10cm的PVC管制成的小型蒸渗仪进行测定。每次试验设置4~5个小型蒸渗仪,分别置于不同的位置。20 d左右测1次,每次连续测1~2 d,每隔半小时采用0.01 g电子天平称其质量变化,从而得到其土壤蒸发(,mm/d)。
2 结果与分析
2.1 气象因子变化特征
从图2可知,冠层温度(a,℃)、参考作物蒸散(0,mm/d)、饱和水汽压差()及光合有效辐射()的变化均随时间呈先增大后减小的趋势,平均温度、0、、分别为19.69 ℃、4.27 mm/d、1.38 kPa和34.55 mol/(m2·d),相对湿度()在生长季内波动较为明显,受降水等事件的影响较大。生长季内总降雨为86.4 mm,不同深度的土壤含水率也随降水等事件而波动。这也与该地区多年气候变化状况相吻合。

2.2 蒸散发及其组分变化特征
从图3可知,干旱绿洲区葡萄树冠层蒸腾和总蒸散均表现为先增大后减小的波动特征。生长季中,葡萄日尺度冠层蒸腾从初期0.20 mm/d增加到中期8.13 mm/d,然后逐渐下降至末期到达极小值,日均冠层蒸腾3.32 mm/d。而总蒸散发从生长初期0.44 mm/d增加到中期9.97 mm/d,然后逐渐下降,末期降至极小值,日均总蒸散发为4.91 mm/d。从季节变化差异性来看,生长季前期和末期,蒸腾占总蒸散发的比值相对较低,而生长季中期(约7—8月)的蒸散发则以植被蒸腾为主。
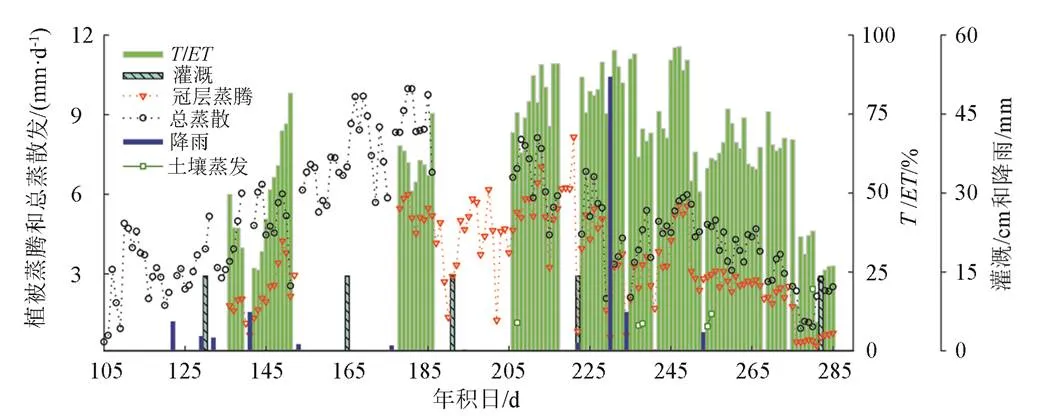
图3 生长季葡萄树冠层蒸腾/蒸散发的季节变化
2.3 蒸腾与总蒸散的比值(T/ET)
生长季葡萄树平均的值为63.5%,结合图4可知,干旱绿洲区农田葡萄树的范围约为59.7%~63.5%[6]。表明干旱绿洲区作物蒸腾是总蒸散的主要水通量。同时,综合175个研究结果对不同生态系统及不同观测模拟手段下蒸散发的分割结果进行了分析[6, 43, 46-47],发现本结果与前人树干液流和涡度相关分割的结果相符合(图4)。陆地植被冠层的范围约为60%~80%[46]。同时,水文学方法得到的超过50%,同位素法约为70%,甚至可达到80%~90%,而模型估计的比例约为50%,已在许多研究中得到证实[8, 43]。

图4 不同生态系统与不同方法总蒸散(ET)分割结果[6, 43, 46-47]
3 讨 论
气象因子方面,相对于a,0变化波动较大,说明0可能受外界因素的影响较明显。生长季10 mm以上的降雨只发生过1次(52.1 mm),同时,小的降雨事件(低于10 mm)对土壤含水率的动态变化影响很小[33]。而从不同土壤深度来看,表层5 cm受降雨影响最显著,而50 cm则受降水影响变化不大,而大于50 cm的土壤水分仅在强降水或灌溉事件发生后才会产生一定的滞后响应。
与其他研究[32, 39-42]相比,蒸腾与蒸散发的结果较高,这可能由于研究区强辐射提供了充足的能量,加上充分灌溉以及较大的潜在蒸散发0和高的冠层郁闭度以及绿洲平流效应而导致的[6]。生长季葡萄树的值为63.5%,结合图4可知,干旱绿洲区葡萄树的范围约为59.7%~63.5%[6]。这表明,干旱绿洲区作物蒸腾是总蒸散的主要水通量。本结果相对于滴灌葡萄的结果偏低,同时比低覆盖度葡萄的结果偏高[41, 44-45, 52],可能是由于滴灌的高水分利用效率和低覆盖度导致的。从及的季节性变化特征可知,由于生长季前期主要是展叶期,叶面积和冠层覆盖度较小,因此的值较低,此时土壤蒸发占主导地位。到生长季中期,随着净辐射和冠层温度的进一步增大,致使饱和水汽压亏缺增大,导致蒸腾拉力迅速升高,其及的数值同时增大。同时叶面积迅速增大,盖度升高,土壤蒸发在叶片遮蔽下逐渐减小,此时总蒸散以冠层蒸腾为主[15, 32, 45]。到生长季末期,叶片生理活性、叶面积指数、太阳辐射、盖度及冠层温度等因子逐渐下降,导致气孔水汽交换减弱,葡萄树冠层蒸腾逐渐减小至极小值。同时,土壤蒸发亦同时减弱,然而,干旱区植被蒸腾特征不仅受胸径、叶面积等因素的影响,还受制于太阳辐射、气孔内外水汽压差、降雨和土壤含水率等因素,因此可能下降更快,导致该阶段的比值相对较低[49-51]。另外,受特殊外界条件的影响,可能导致个别的比值过低或过高[14-15]。
从生态系统类型和研究方法方面来看,本结果低于热带雨林而偏高于大部分稀疏草原、地中海灌木等。这可能是由于热带雨林降水充足,叶面积指数大,辐射强,而该区域CO2的影响也可能导致较高的蒸腾[43,46-47]。在农田,作物的生长阶段、环境因子、叶面积特征也对作物的蒸腾作用有较大影响,因此,需要针对不同生态系统类型对的范围做出估算。另外,不同的方法也可能会带来不同的结果。研究表明,同位素方法得到的范围较其他方法略高(约70%,甚至80%~90%)[8],这可能是由于同位素分馏效应的影响。而树干液流、涡度相关方法分配的结果往往高于模型模拟。如本研究与前人树干液流和涡度相关法所得到的结果相符合,而偏低与于同位素方法所得结果。因此,的结果受叶面积特征、生态系统类型、研究方法的影响较大。
4 结 论
1)干旱绿洲区葡萄树生长季与的季节变化特征均为生长季中期高、前期和末期较低。同时,由于强辐射、充分灌溉、高冠层郁闭度以及绿洲平流等效应,导致干旱绿洲区葡萄树生长季与的结果较其他地区高。
2)干旱绿洲区葡萄树的范围约为59.7%~63.5%,该类地区蒸腾是总蒸散的主要水通量。
[1] JUNG M, REICHSTEIN M, CIAIS P, et al. Recent decline in the global land evapotranspiration trend due to limited moisture supply[J]. Nature, 2010, 467(7318): 951-954.
[2] AVISSAR R, SCHMIDT T. An evaluation of the scale at which ground-surface heat flux patchiness affects the convective boundary layer using large-eddy simulations[J]. Journal of the Atmospheric Sciences, 1998, 55(16): 2 666-2 689.
[3] WANG K C, DICKINSON R E. A review of global terrestrial evapotranspiration: Observation, modeling, climatology, and climatic variability[J]. Reviews of Geophysics, 2012, 50(2): RG2005.
[4] ZHU G F, ZHANG K, LI X, et al. Evaluating the complementary relationship for estimating evapotranspiration using the multi-site data across North China[J]. Agricultural and Forest Meteorology, 2016, 230/231: 33-44.
[5] 张琨. 遥感蒸散发模型参数敏感性分析与优化方法研究[D]. 兰州: 兰州大学, 2018.
ZHANG Kun. Parameter sensitivity analysis and optimization for remote sensing based evapotranspiration model[D]. Lanzhou: Lanzhou University, 2018.
[6] 王尚涛. 干旱绿洲区农田葡萄树蒸散耗水及水分利用策略研究[D]. 兰州: 兰州大学, 2019.
WANG Shangtao. Characteristics of evapotranspiration and water up take of grapevine in an arid oasis ecosystem in northwest China[D]. Lanzhou: Lanzhou University, 2019.
[7] ZHU G F, LI X, SU Y H, et al. Simultaneously assimilating multivariate data sets into the two-source evapotranspiration model by Bayesian approach: Application to spring maize in an arid region of northwestern China[J]. Geoscientific Model Development, 2014, 7(4): 1 467-1 482.
[8] JASECHKO S, SHARP Z D, GIBSON J J, et al. Terrestrial water fluxes dominated by transpiration[J]. Nature, 2013, 496(7445): 347-350.
[9] 夏永秋, 邵明安. 黄土高原半干旱区柠条(Caragana korsh inskii)树干液流动态及其影响因子[J]. 生态学报, 2008, 28(4): 1 376-1 382.
XIA Yongqiu, SHAO Ming’an. The Sap flow dynamics of Caragana korshinskii and the influence of environmental factors in semi-arid region of the Loess Plateau[J]. Acta Ecologica Sinica, 2008, 28(4): 1 376-1 382.
[10] 曾辰. 极端干旱区成龄葡萄生长特征与水分高效利用[D]. 杨凌: 中国科学院研究生院(教育部水土保持与生态环境研究中心), 2010.
ZENG Chen. The growth characteristics and high water use efficient on mature grape under extremely drought region[D]. Yangling: Institute of Soil and Water Conservation, CAS&MWR, 2010.
[11] 张建君. 农田日蒸散量估算方法研究[D]. 北京: 中国农业科学院研究生院, 2009.
ZHANG Jianjun. Estimation of cropland daily evapotranspiration[D]. Beijing: Graduate University of Chinese Academy of Agricultural Sciences, 2009.
[12] 孙树臣. 农田和灌丛生态系统蒸散发过程及水分利用效率研究[D]. 杨凌: 中国科学院教育部水土保持与生态环境研究中心, 2016.
SUN Shuchen. Study on evapotranspiration and water use efficiency of farmland and bushwood ecosystem[D]. Yangling: Institute of Soil and Water Conservation, CAS&MWR, 2016.
[13] THORNTHWAITE C W, HOLZMAN B. The determination of evaporation from land and water surfaces[J]. Monthly Weather Review, 1939, 67(1): 4-11.
[14] 白岩, 朱高峰, 张琨, 等. 基于树干液流及涡动相关技术的葡萄冠层蒸腾及蒸散发特征研究[J]. 生态学报, 2015, 35(23): 7821-7831.
BAI Yan, ZHU Gaofeng, ZHANG Kun, et al. Research of transpiration and evapotranspiration from a grapevine canopy combining the Sap flow and eddy covariance techniques[J]. Acta Ecologica Sinica, 2015, 35(23): 7 821-7 831.
[15] 白岩. 干旱绿洲农田生态系统葡萄冠层蒸腾耗水研究[D]. 兰州: 兰州大学, 2016.
BAI Yan. Transpiration and water consumption in A grapevine canopy in an arid oasis ecosystem[D]. Lanzhou: Lanzhou University, 2016.
[16] ALLEN R G, PEREIRA L S, HOWELL T A, et al. Evapotranspiration information reporting: I. Factors governing measurement accuracy[J]. Agricultural Water Management, 2011, 98(6): 899-920.
[17] DING R S, TONG L, LI F S, et al. Variations of crop coefficient and its influencing factors in an arid advective cropland of northwest China[J]. Hydrological Processes, 2015, 29(2): 239-249.
[18] FOKEN T. The energy balance closure problem: An overview[J]. Ecological Applications, 2008, 18(6): 1 351-1 367.
[19] ONCLEY S P, FOKEN T, VOGT R, et al. The energy balance experiment EBEX-2000. part I: Overview and energy balance[J]. Boundary-Layer Meteorology, 2007, 123(1): 1-28.
[20] ZHANG H D, WEI W, CHEN L D, et al. Effects of terracing on soil water and canopy transpiration of Pinus tabulaeformis in the Loess Plateau of China[J]. Ecological Engineering, 2017, 102: 557-564.
[21] YANG P J, HU H C, TIAN F Q, et al. Crop coefficient for cotton under plastic mulch and drip irrigation based on eddy covariance observation in an arid area of northwestern China[J]. Agricultural Water Management, 2016, 171: 21-30.
[22] 邱国玉, 熊育久. 水与能: 蒸散发、热环境及其能量收支[M]. 北京: 科学出版社, 2014.
QIU Guoyu, XIONG Yujiu. Water versus energy Water versus energy[M]. Beijing: Science Press, 2014.
[23] BAKER J M, VAN BAVEL C H M. Measurement of mass flow of water in the stems of herbaceous plants[J]. Plant, Cell & Environment, 1987, 10(9): 777-782.
[24] BUCKLEY T N, TURNBULL T L, ADAMS M A. Simple models for stomatal conductance derived from a process model: Cross-validation against Sap flux data[J]. Plant, Cell & Environment, 2012, 35(9): 1 647-1 662.
[25] GRANIER A, BOBAY V, GASH J H C, et al. Vapour flux density and transpiration rate comparisons in a stand of Maritime pine (Pinus pinaster Ait.) in Les Landes forest[J]. Agricultural and Forest Meteorology, 1990, 51(3/4): 309-319.
[26] NADEZHDINA N, VANDEGEHUCHTE M W, STEPPE K. Sap flux density measurements based on the heat field deformation method[J]. Trees, 2012, 26(5): 1 439-1 448.
[27] BASTIAANSSEN W G M, PELGRUM H, WANG J, et al. A remote sensing surface energy balance algorithm for land (SEBAL): Part 2: Validation[J]. Journal of Hydrology, 1998, 212/213: 213-229.
[28] FISHER J B, TU K P, BALDOCCHI D D. Global estimates of the land-atmosphere water flux based on monthly AVHRR and ISLSCP-II data, validated at 16 FLUXNET sites[J]. Remote Sensing of Environment, 2008, 112(3): 901-919.
[29] NORMAN J M, KUSTAS W P, HUMES K S. Source approach for estimating soil and vegetation energy fluxes in observations of directional radiometric surface temperature[J]. Agricultural and Forest Meteorology, 1995, 77(3/4): 263-293.
[30] SU Z B. A surface energy balance system (SEBS) for estimation of turbulent heat fluxes from point to continental scale[J]. Hydrology and Earth System Sciences, 2002, 6(1): 85-99.
[31] SOEGAARD H, BOEGH E. Estimation of evapotranspiration from a millet crop in the Sahel combining Sap flow, leaf area index and eddy correlation technique[J]. Journal of Hydrology, 1995, 166(3/4): 265-282.
[32] ZHANG Y Q, KANG S Z, WARD E J, et al. Evapotranspiration components determined by Sap flow and microlysimetry techniques of a vineyard in northwest China: Dynamics and influential factors[J]. Agricultural Water Management, 2011, 98(8): 1 207-1 214.
[33] 孙朋. 极端干旱区沙漠包气带降水入渗与蒸发规律模拟研究[D]. 兰州: 兰州大学, 2017.
SUN Peng. Modeling the water infiltration and evaporation in unsaturated zone of the extremely arid area[D]. Lanzhou: Lanzhou University, 2017.
[34] 白岩, 朱高峰, 张琨, 等. 敦煌葡萄液流特征及耗水分析[J]. 中国沙漠, 2015, 35(1): 175-181.
BAI Yan, ZHU Gaofeng, ZHANG Kun, et al. Analysis of variation of Sap flow velocity and water consumption of grapevine in the Nanhu oasis, Dunhuang, China[J]. Journal of Desert Research, 2015, 35(1): 175-181.
[35] MA J Z, HE J H, QI S, et al. Groundwater recharge and evolution in the Dunhuang Basin, northwestern China[J]. Applied Geochemistry, 2013, 28: 19-31.
[36] 张琨, 朱高峰, 白岩, 等. 基于人工神经网络的涡度相关仪观测蒸散量的数据插补方法[J]. 兰州大学学报(自然科学版), 2014, 50(3): 348-355.
ZHANG Kun, ZHU Gaofeng, BAI Yan, et al. Gap filling for evapotranspiration based on BP artificial neural networks[J]. Journal of Lanzhou University (Natural Sciences), 2014, 50(3): 348-355.
[37] 王介民, 王维真, 奥银焕, 等. 复杂条件下湍流通量的观测与分析[J]. 地球科学进展, 2007, 22(8): 791-797.
WANG Jiemin, WANG Weizhen, AO Yinhuan, et al. Turbulence flux measurements under complicated conditions[J]. Advances in Earth Science, 2007, 22(8): 791-797.
[38] 徐自为, 刘绍民, 宫丽娟, 等. 涡动相关仪观测数据的处理与质量评价研究[J]. 地球科学进展, 2008, 23(4): 357-370.
XU Ziwei, LIU Shaomin, GONG Lijuan, et al. A study on the data processing and quality assessment of the eddy covariance system[J]. Advances in Earth Science, 2008, 23(4): 357-370.
[39] NETZER Y, YAO C R, SHENKER M, et al. Water use and the development of seasonal crop coefficients for Superior Seedless grapevines trained to an open-gable trellis system[J]. Irrigation Science, 2009, 27(2): 109-120.
[40] ORTEGA-FARIAS S, POBLETE-ECHEVERRÍA C, BRISSON N. Parameterization of a two-layer model for estimating vineyard evapotranspiration using meteorological measurements[J]. Agricultural and Forest Meteorology, 2010, 150(2): 276-286.
[41] POBLETE-ECHEVERRÍA C A, ORTEGA-FARIAS S O. Evaluation of single and dual crop coefficients over a drip-irrigated Merlot vineyard (L.) using combined measurements of Sap flow sensors and an eddy covariance system[J]. Australian Journal of Grape and Wine Research, 2013, 19(2): 249-260.
[42] RANA G, KATERJI N, INTRONA M, et al. Microclimate and plant water relationship of the “overhead” table grape vineyard managed with three different covering techniques[J]. Scientia Horticulturae, 2004, 102(1): 105-120.
[43] SUTANTO S J, VAN DEN HURK B, DIRMEYER P A, et al. HESS Opinions “A perspective on isotope versus non-isotope approaches to determine the contribution of transpiration to total evaporation”[J]. Hydrology and Earth System Sciences, 2014, 18(8): 2 815-2 827.
[44] LÓPEZ-URREA R, MONTORO A, MAÑAS F, et al. Evapotranspiration and crop coefficients from lysimeter measurements of mature ‘Tempranillo’ wine grapes[J]. Agricultural Water Management, 2012, 112: 13-20.
[45] ZHAO P, LI S E, LI F S, et al. Comparison of dual crop coefficient method and Shuttleworth-Wallace model in evapotranspiration partitioning in a vineyard of northwest China[J]. Agricultural Water Management, 2015, 160: 41-56.
[46] SCHLESINGER W H, JASECHKO S. Transpiration in the global water cycle[J]. Agricultural and Forest Meteorology, 2014, 189/190: 115-117.
[47] KOOL D, AGAM N, LAZAROVITCH N, et al. A review of approaches for evapotranspiration partitioning[J]. Agricultural and Forest Meteorology, 2014, 184: 56-70.
[48] WILLIAMS D G, CABLE W, HULTINE K, et al. Evapotranspiration components determined by stable isotope, Sap flow and eddy covariance techniques[J]. Agricultural and Forest Meteorology, 2004, 125(3/4): 241-258.
[49] CHEN D, WANG Y K, LIU S Y, et al. Response of relative Sap flow to meteorological factors under different soil moisture conditions in rainfed jujube (Ziziphus jujuba Mill.) plantations in semiarid Northwest China[J]. Agricultural Water Management, 2014, 136: 23-33.
[50] TIE Q, HU H C, TIAN F Q, et al. Environmental and physiological controls on Sap flow in a subhumid mountainous catchment in North China[J]. Agricultural and Forest Meteorology, 2017, 240/241: 46-57.
[51] JIAO L, LU N, SUN G, et al. Biophysical controls on canopy transpiration in a black locust (Robinia pseudoacacia) plantation on the semi-arid Loess Plateau, China[J]. Ecohydrology, 2016, 9(6): 1 068-1 081.
[52] FANDIÑO M, CANCELA J J, REY B J, et al. Using the dual-Kc approach to model evapotranspiration of Albariño vineyards (L. cv. Albariño) with consideration of active ground cover[J]. Agricultural Water Management, 2012, 112: 75-87.
Changes in Transpiration and Evapotranspiration of Grapevines (L) in Arid Oasis in Northwestern China
WANG Shangtao1, ZHAO Nan2, ZHANG Yang2, ZHANG Kun3, ZHU Gaofeng2
(1. School of Water Resources and Electric Power, Qinghai University, Xining 810016, China; 2. Key Laboratory of Western China’s Environmental Systems with the Ministry of Education,College of Earth and Environmental Sciences, Lanzhou University, Lanzhou 730000, China; 3. Institute of Tibetan Plateau Research, Chinese Academy of Sciences, Beijing 100101, China)
【】The ratio of transpiration () to evapotranspiration () varies with plants and their growth stages. The aim of this paper is to experimentally study T and ET, as well as their temporal variations.【】The experiment was conducted at a grapevine vineyard in an arid oasis in northwestern China. The transpiration and evapotranspiration of the grapevines (L.) were measured using sap-flow sensor, microclimatic station and eddy-covariance methods, respectively, at different growth stages.【】During the whole growth season, the transpiration increased from the initial 0.20 mm/d to 8.13 mm/d at the middle of growth season; it then dropped gradually to 3.32 mm/d when the leaves started falling. In comparison, the associated evapotranspiration increased from initial 0.44 mm/d to 9.97 mm/d before gradually decreasing to 4.91 mm/d. The averageratio was approximately 63.5%.【】Transpirationis the dominant soil water loss during the growth season of the grapevines (L.) in arid oasis in northwestern China.
arid oasis area;L.;sap flow; eddy covariance; transpiration-evapotranspiration ratio
TV93
A
10.13522/j.cnki.ggps.2021228
1672 - 3317(2021)12 - 0001 - 06
2021-06-01
国家自然科学基金面上项目(41871078);国家重点研发计划重点专项项目(2018YFC0406602);青海省重点研发与转化计划项目(2021-SF-134)
王尚涛(1985-),男,甘肃平凉人。硕士生导师,博士,主要从事生态-水文过程研究。E-mail: wangsht@qhu.edu.cn
王尚涛, 赵楠, 张扬, 等. 干旱绿洲农田无核白葡萄树蒸散发的分割研究[J]. 灌溉排水学报, 2021, 40(12): 1-6.
WANG Shangtao, ZHAO Nan, ZHANG Yang, et al. Changes in Transpiration and Evapotranspiration of Grapevines (L.) in Arid Oasis in Northwestern China[J]. Journal of Irrigation and Drainage, 2021, 40(12): 1-6.
责任编辑:赵宇龙