Prediction of epidemics dynamics on networks with partial differential equations: A case study for COVID-19 in China∗
2021-12-22RuQiLi李汝琦YuRongSong宋玉蓉andGuoPingJiang蒋国平
Ru-Qi Li(李汝琦) Yu-Rong Song(宋玉蓉) and Guo-Ping Jiang(蒋国平)
1School of Computer Science,Nanjing University of Posts and Telecommunications,Nanjing 210003,China
2College of Automation and College of Artificial Intelligence,Nanjing University of Posts and Telecommunications,Nanjing 210023,China
Keywords: partial differential equations,intervention measures,Baidu Migration Data,COVID-19 prediction
1. Introduction
The rapid development of complex network theory has effectively enhanced people’s understanding of the transmission mechanisms of the outbreak of infectious diseases. There is a significant body of research on the spread of infection diseases on complex networks with various approaches including statistical and mathematical models to understand and predict infectious scales over a time period in complex networks.[1–3]Mathematical modeling based on epidemiological characteristics is playing an important role in the research on the spread of infectious diseases.
Recently,in response to the current COVID-19 pandemic,scholars have proposed many epidemic models to analyze and predict the impact of COVID-19 in the outbreak area.[4–7]For example,Taoet al.[8]relied on the classical SIR model to evaluate the basic reproductive number of COVID-19 outbreaks in China and the United States. de Sousaet al.[9]used SEIR model to simulate different intervention scenarios in Brasilia for predicting the growth trend of cases. The extended classical model also includes generalized growth models[10]or age-stratified model.[11]Although the smooth prediction curve produced by this type of ordinary differential equation(ODE)model can reflect the overall trend of COVID-19 cases, the fluctuation in a small range of cases under the overall increase or decrease trend cannot be described in detail due to the factors of policy or human activities,which leads to the relatively low prediction accuracy.
In this paper, we propose a novel computational model for studying the spread of epidemic on networks based on partial differential equations(PDE).The proposed model captures epidemic diffusion along the edges of a network and extends the PDE models on social networks in Ref. [12] where PDE models are used to describe information diffusion and epidemic spread between clusters of the underlying networks.Many spatio-temporal models describe the transmission characteristics of infectious diseases by PDEs,and capture spatiotemporal information for infectious diseases.[13–16]For example,Wanget al.[17]applied the PDE model to analyze and predict regional COVID-19 in Arizona. The PDE model we develop in the present work focuses on the spread of COVID-19 across a city network and incorporates the factors of city traffic lockdowns and social distancing. The PDE model provides a new way for quantifying the effectiveness of the government policies toward controlling COVID-19 cases.
In addition,the difference between our model and the existing PDE models is that we use real-time human mobility data provided by Baudu,[18]which includes the travel intensity within Wuhan and the scale of population migration from Wuhan to other cities in China. The use of population outflow data from epidemic areas and epidemiological data can further demonstrate the role of population movement in the early spread of COVID-19 in various cities and how these control measures affect the spread from Wuhan to other cities. Although a large number of literatures have applied partial differential equations to the spatio-temporal propagation modeling of epidemiology, to our knowledge, this paper is the first attempt to combine the Baidu migration data and the PDE model to predict COVID-19 and evaluate how the local intervention has affected the spread of COVID-19.
2. COVID-19 outbreak in China
Large-scale population migration in the short term can spread from local outbreaks into widespread epidemics.[19–22]On January 26,2020,at a Wuhan press conference,the mayor stated that about 5 million people had left Wuhan due to the Spring Festival travel and epidemic factors.[23]In order to control the development of the epidemic,China has implemented an unprecedented intervention strategy from January 23,2020.The entire Wuhan City has been quarantined and strict travel restrictions have been implemented.[24]Although epidemic prevention measures have been adopted in cities across China,a series of factors such as population movements,geographical and social characteristics may lead to different characteristics of the spread of COVID-19 in various cities.
Before introducing specific methods and assumptions,let us point out an important fact. The number of confirmed cases in various regions is largely affected by the outflow population before the closure of Wuhan. Table 1 shows the population outflow index of the top-50 cities with maximum outflow population from Wuhan during the two weeks before the closure and the cumulative number of confirmed cases as of February 25, 2020. Figure 1 shows the correlation between the population outflow index and the cumulative number of confirmed cases in the 50 cities. It can be seen that the relationship between them is almost linear, and the corresponding Pearson correlation coefficient is as high as 0.972.
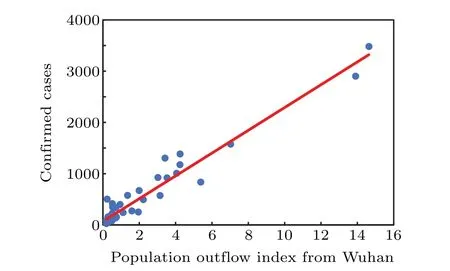
Fig.1. The relationship between the cumulative number of confirmed cases in the top-50 cities with maximum population outflow index from Wuhan and corresponding population outflow index. Cities are represented by data points and the linear fitting is represented by the red line(R2=0.945).

Table 1. The six columns respectively show the names of the top-50 cities with maximum outflow population from Wuhan during the two weeks before the closure,the population outflow index,the cumulative number of confirmed cases as of February 25,2020.
To further verify the ability of population mobility to predict the growth of COVID-19 cases,we conducted the Granger causality test. The significance of Granger causality test is to test whether the lag value(past information)of a variable has predictive effect on the explained variable. Considering the lagging effect of population mobility on case growth, we use the daily population outflow from Wuhan two weeks before Wuhan closure on January 23, 2020 and the confirmed cases summed across top-50 cities with maximum population outflow from Wuhan two weeks after Wuhan closure. Unit root test shows that the two time series are stationary.Select the default lag period of 2 for Eviews 8 software,and the results of Granger causality test are shown in Table 2. It can be seen that the concomitant probability of population migration does not Granger cause cases is less than 0.05,so it rejects the null hypothesis,that is,population migration is the Granger causality of cases,and population migration data has the ability to predict the confirmed case data,which also verifies the rationality of the PDE prediction model driven by population flow.
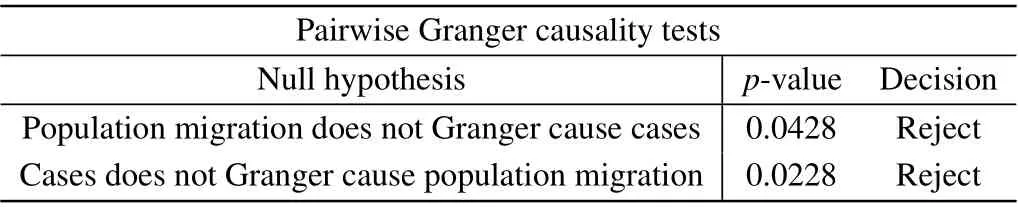
Table 2. Granger causality test results.
Based on the above observations,we focus on the China city network and choose eight cities with different population flows centered on Wuhan and use the proposed model to predict the spread of COVID-19 at a city level. In terms of China’s per capita COVID-19 infection rate, Hubei province has a higher per capita infection rate. As shown in Fig. 2,we select Xiaogan and Jingzhou in Hubei province close to Wuhan. In the southern part of Hubei, we select Changsha and Guangzhou, which locate at a long distance away from Wuhan; similarly, in the eastern part of Hubei, Nanjing and Shanghai are chosen; in the western part, Chongqing is chosen; in the north part of China, Beijing is selected. Note that we are focusing on the overall flow of people in each city rather than individual tracking.
We use the city-level COVID-19 data provided by the China Data Lab on Harvard Dataverse for some time.[25]To smooth the data, we use the seven-day rolling average of the cumulative city level data. In addition, we also incorporate the Baidu Migration Index into our model, which includes the Wuhan migration index,the traffic intensity within Wuhan, and the proportion of the population outflow index from Wuhan to each city from January 10, 2020 to March 15, 2020. Then, we calculate the daily change of input from Wuhan for each city by multiplying the Wuhan migration index by the proportion of moving in destinations from Wuhan.In the days before the Lunar New Year and the establishment of quarantine measures,the flow of people leaving Wuhan began to increase and reached a peak on the eve of the Lunar New Year on January 24, 2020, and then quickly reduced to almost no activity. The travel ban seems to have blocked the movement in and out of Wuhan to celebrate the Chinese New Year and has minimized the further spread of SARS-COV-2 exported from Wuhan.
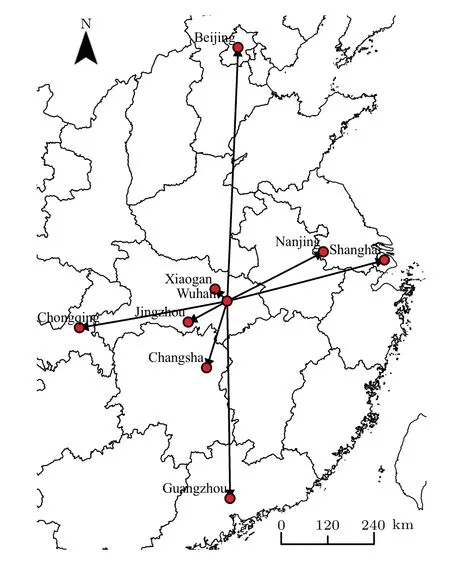
Fig.2. Geographical distribution of nine cities.
3. A new prediction framework of epidemic on networks
The efficiency,speed,and coverage of modern transportation networks play a significant role in the spread of epidemics.As a result,we focus on the spread of epidemics along the edges of a network which often represent roads or traffic routes.
From a mathematical point of view, the spread of infectious diseases can be modeled by diffusive differential equations. Given a network can be presented by a graph. To be more precise we consider a finite,simple,connected graphGwithmedgese1,...,emandnverticesv1,...,vn. The edgejis isomorphic to the interval [0,1] and spatial variablexon it, wherex=0,1 represent the two ends. Here we only consider undirected graphs and the two ends of an edge can be either 0 or 1. To capture the spread of epidemic between nodes on the network,a system of diffusion equations are proposed to predict the infection on the networks. On each edgeej,j=1,...,m,we have

If a vertex is connected to multiple edges,u(t,·) at the vertex is the average ofu(t,·)computed from the edges. Here we think ofuj(t,x) as a function defined on thej-th edgeejwhich indicates the infection level edgeej,j=1,...,m. and impose that, for eacht ≥0, (u1(t,·),...,um(t,·)) is continuous on the graph,i.e.,that the values ofuj(t,·)are compatible at the vertices if we assume that the constantεis sufficient small. HereFj(t,x,u) can be viewed as local growth of the infection andψj(x) is the initial function on each edge. The existence and uniqueness of such evolutionary systems on networks have been studied by many authors.[26,27]
From a computational point of view,model(1)is computationally efficient as it allows us to compute each edge concurrently. Model (1) is also an extension of PDE models on social networks in Ref.[12]where the entire networks or some clusters are embedded into a Euclidean space and PDE models are used to describe information diffusion and epidemic spread between clusters of the underlying networks. If a network exhibits significant clusters, then model (1) can be applied to its cluster networks for taking the advantage of spatiotemporal modeling on networks. In this paper,we will use the spatio-temoral modeling framework to examine the outbreak of COVID-19 at 9 major cities in China.
4. PDE model for China city network
Based on the prediction framework(1),we propose a specific PDE model to analyze the spatio-temporal dynamics of COVID-19 cases in the China city network. We now focus on each edge which links the Wuhan and other eight cites as shown in Fig.3 where only the edge between Wuhan and Xiangan is shown. The spatio-temporal model can describe the two transmission processes of COVID-19: the local process(local cases caused by the community transmission within a city)and the global process(imported cases caused by crossborder transmission between cities).
LetC(x,t)represent the number of the COVID-19 cases in a China cityxat timet. Through the combination of the two processes in Fig. 3, the differential dynamic equation of the COVID-19 prediction model is constructed as follows:
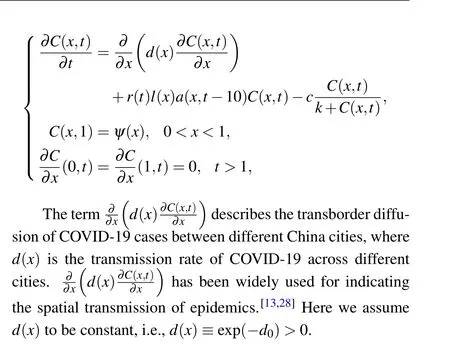

Fig.3. Spread of epidemic between one of the edges of the China city network.
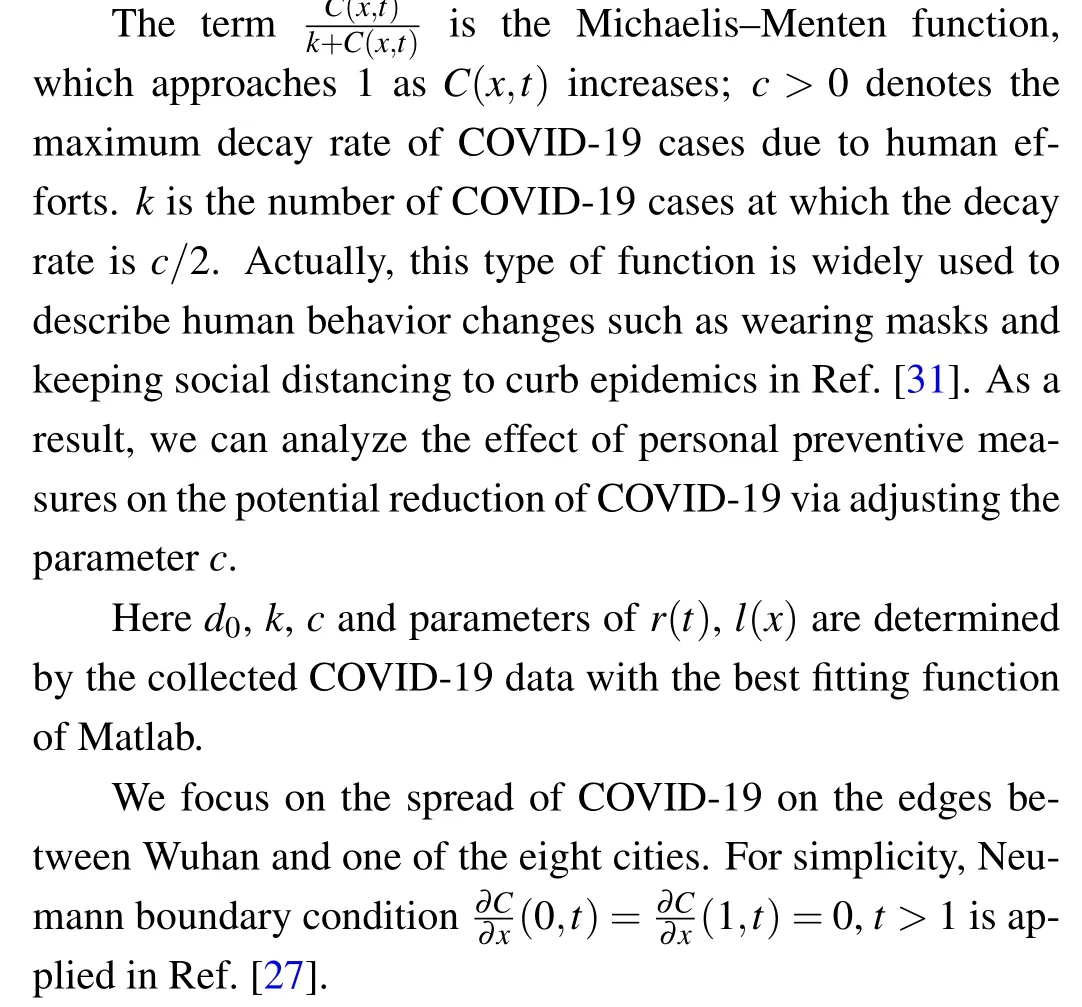
Recall that the mathematical expression of population growth in Ref. [28], such as bacteria and tumors,r(t)l(x)a(x,t −10)C(x,t) denotes the local diffusion caused by the second generation reproduction of infected cases within each China cityxat timet.
(i) Ther(t)>0 is the infection rate that changes with timetwithin a city,and it increases with the increase of confirmed casesC(x,t). Therefore,r(t) can be expressed as the functionr(t)=g(b0+b1t)andg(u)=1/(1+exp(−u))with parametersb0>0,b1>0 for describing the pattern.
(ii)Thel(x)is a dimensionless location function that indicates different cities in China’s city network, and it is built through a cubic spline interpolation, which satisfiesl(xi)≡li,i=0,1,wherexirepresents cityi.
(iii) Thea(x,t −10) is the population outflow data from Wuhan to Xiaogan (or one of the China cities) whenx=1,which will lead to the increase of COVID-19 cases.t −10 represents the lag period in which the population movement affects the epidemic. Here we assume that it takes ten days for the effect of population movement on changes in confirmed cases,which covers the incubation period of most cases simultaneously.[29,30]Whenx=0,a(x,t −10)is the traffic intensity within Wuhan.
Initial functionψ(x) represents the initial counts of COVID-19 cases between Wuhan and one of the eight cities,i.e.,ψ(x)=C(x,1),which can be constructed from the historical case data by cubic spline interpolation.
5. Prediction process and evaluation
To forecast the COVID-19 of a given day, we use population mobility data and historical COVID-19 case data from nine cities to solve the inversion problem of PDE model (2).In the current work,we use the training data set of seven days for predicting the COVID-19 cases of the following day, i.e.,days 1–7, 2–8, ..., are used as the training data, and we predict the number of COVID-19 cases for the following days 8, 9, ..., respectively. Specifically, we adopt a hybrid approach: First a tensor train global optimization[32]is used to search the parameter space for locating the starting points,and then Nelder–Mead simplex method[33]is used to further explore the local optimization,where the Nelder–Mead simplex method depends on the fminsearch function in MATLAB(version R2020a). Once the model parameters are determined,we apply the fourth-order Runge–Kutta method to solve the PDE for one-step forward prediction in time dimension numerically.
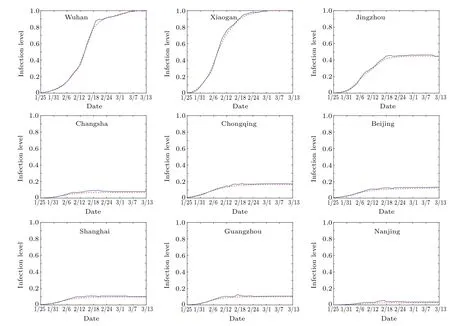
Fig. 4. Predicted versus actual cases growth in nine cities from January 25, 2020 to March 13, 2020. Blue lines: predicted data. Red lines:actual data.
Figure 4 shows the cumulative COVID-19 case prediction for nine cities in China from January 25, 2020 to March 13,2020,and the data is normalized to between[0,1]. Due to the large gag in case numbers between Wuhan and other cities,Wuhan’s data is based on the maximum value of Wuhan,and the other eight cities are based on the maximum value of Xiaogan. Obviously,there is a consistent trend between the predicted cases and the actual data. The estimated parameters are different for each time step. Using the bootstrap method,here we only provide the population mean,confidence interval andp-value of the estimated parameters in the last prediction for the nine city on March 13,as shown in Table 3.
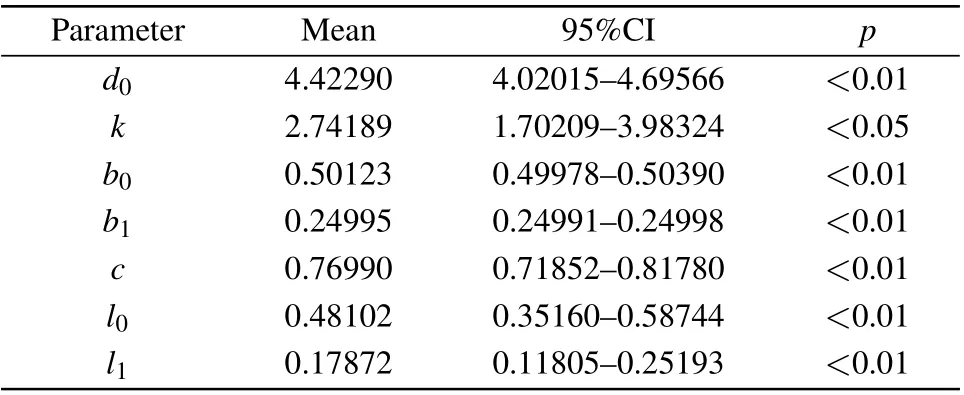
Table 3. Parameter estimates of the PDE model on March 13,2020.
As we can see from Fig.4,after two key dates,January 23(Wuhan was quarantined)and January 24(Lunar New Year’s Eve, outbound holiday travel is typically completed before this evening), the confirmed cases of COVID-19 in several cities began to increase rapidly and eventually reached saturation. On February 11, the COVID-19 control headquarters of Wuhan made an announcement to further strengthen source control and minimize the flow of people. As a result,the city’s communities were closed for management from that time.About a week later,on February 18,we can see the effect of this measure. The number of confirmed cases had changed from an exponential increase to a logarithmic increase,and the growth rate had slowed down significantly.
Figure 4 also indicates that Xiaogan has the largest case number next to Wuhan. On February 5, Xiaogan, which had a population of more than 2 million less than Huanggang,surpassed Huanggang’s cumulative number of COVID-19 confirmed cases, becoming second in China, second only to Wuhan. The investigation found 11524 feverish persons,4509 of whom returned from Wuhan.As of January 31,among the confirmed and suspected cases,returnees from Wuhan accounted for 60%and 66%, respectively. On February 14, the Xiaogan Municipal Government decided to comprehensively upgrade the prevention and control measures throughout the city: all communities would be fully closed for management.After the implementation of this measure lasted for about a week, the number of confirmed cases gradually approached saturation. Although the permanent population of Jingzhou is 650000 more than that of Xiaogan, the inflow population from Wuhan in Jingzhou is only half of that in Xiaogan. This may be the main reason why Jingzhou’s infection level did not reach the top line. Cities in other provinces have basically maintained the infection level below 0.2, which may be the common result of lower inflow from Wuhan,staying at home,and wearing masks.
6. Prediction comparison of mathematical models
6.1. Statistical model
In this section,we compare the stochastic PDE model and a statistical ARIMA model[34]which is most suitable for univariate time series modelling. The ARIMA model contains three parameters,namely,p,dandq,wherepis the lag of the time series used in the prediction model,dis the difference number when the time series is stationary, andqis the lag of the prediction error. Mathematically the formula for ARIMA could be represented as

whereytandεtare the actual data and the error terms at timet,φiandθi(i=1,2,3,...) are model coefficients, andcis a constant.
To facilitate model comparison, we use daily new cases from January 20, 2020 to February 29, 2020 summed across the above 8 cities excludes Wuhan for predicting new cases one day ahead.The augmented Dicky Fuller test(ADF)shows that the time series is stationary after the first-order difference.The parameterspandqcan be determined via the autocorrelation function (ACF) and partial autocorrelation function(PACF).The coefficientsφiandθiof model(2)are evaluated via the least square method using Eviews 8 software, and the optimal model is selected in accordance with the relative minimum of AIC(Table 4). Therefore,the ARIMA(1,1,1)model can describe the time series.
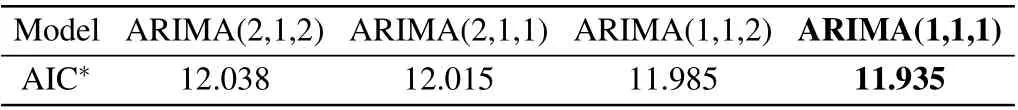
Table 4. Candidate statistical models with different order p and q. The chosen model is shown in bold face.
6.2. ODE model
Ordinary differential system has been widely used in the study of epidemic spread. Here we evaluate the prediction results by fitting an SEIR model[35]to the total number of daily new confirmed cases from eight cities. The model is shown as

whereS,E,I,andRare the number of susceptible, exposed(latent),infectious,and removed individuals on dayt.Nis the total population in eight cities.β,σ,andγare the transmission rate, the daily probability of an exposed individual becoming infectious, and the daily probability of recovery or death of an infected individual. Prior estimates ofβ,σ, andγare derived from epidemiological surveys[32]and the values are 0.6,0.163,and 0.215,respectively. The initial number of infected isI(0)=1. Model fitting is performed using the Monte Carlo method with the MATLAB(version R2020a).
6.3. PDE model with noise interference
In social network, the disturbance of infectious disease dynamics mainly comes from the change of network topology due to human activities. Considering the influence of environmental fluctuation,we establish the stochastic model by introducing the additive noise term into the population mobilitydriven PDE. Here we assume that the daliy migration index of cityxis interfered and the interference could be described as additive noise. Therefore, we introduce randomness into the deterministic model(2)by perturbing population mobility itema(x,t −10)bya(x,t −10)+σζ(x,t −10)to capture the following stochastic PDE model:

and〈·〉represents the overall average,δ(·)is the Dirac-δfunction,σis the noise intensity which describes the stability of population mobility,andσ=1.
Meanwhile, we use the daily new cases data from January 20,2020 to February 29,2020 summed across the above 8 cities excludes Wuhan city and the corresponding population outflow from Wuhan to train our PDE model with noise interference. To ensure the robustness of the conclusions,we also evaluate bootstrap estimates of the population mean,confidence interval andp-value of the model parameters(Table 5).

Table 5. Parameter estimates of the PDE model.
6.4. Results comparison
Figure 5 shows the prediction curves of several mathematical models from January 20, 2020 to February 29, 2020.As seen from Table 6, the prediction performance of PDE model is better than ARIMA model in the view of mean absolute error (MAE) and mean absolute percent error (MAPE),but is slight worse in the view of root mean squared error(RMAE). Compared with ODE model, the prediction performance of PDE model is better in the view of RMSE and MAE.Significantly, our model is in the social network to naturally describe the relative distribution of cases across different geographic areas over time, which is fundamentally driven by the population outflow from Wuhan. Secondly, the proposed model involves community transmission within a city, crossborder transmission between cities and variable human behavior, which well simulates the impact of government intervention and personal prevention on COVID-19 cases,as shown in the next section.

Fig.5.Predictions of COVID-19 daily new cases from January 20,2020 to February 29,2020.

Table 6. The statistical comparison of the predicted results of mathematical models.
7. Effects of lockdown and social distancing
To measure the effectiveness of interventions such as lockdown and social distancing on reducing COVID-19, we predict the COVID-19 cases with a decreaseda-value which represents the effect of the traffic within Wuhan and the outflow from Wuhan, and an increasedc-value which represents the effect of social distancing.It is general believed that sparse traffic flow and appropriate social distancing can effectively reduce COVID-19 cases. Specifically, based on the fact that the parameters in the model(2)remain unchanged,we multiply thea-value by 0.2 and thec-value by 2,which means that reduction of traffic flow from Wuhan by 80% and each city add double effort for social distancing.
Figure 6 describes COVID-19 case prediction under measures of lockdown and social distancing in Wuhan, Xiaogan and Jingzhou from January 25, 2020 to March 13, 2020, and demonstrates that the final confirmed cases under such double interventions may be 10% to 19% less than the actual cases.Therefore,our results validate that active intervention can effectively inhibit the growth of COVID-19 and curb the wider spread of emerging pathogens. In fact, China’s multifaceted response may have prevented worse situation from happening,which also provides useful information for the rest of the world.
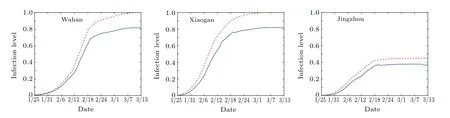
Fig.6. Effect of interventions on case growth in three cities of Hubei province from January 25,2020 to March 13,2020. Blue lines: predicted cases. Red lines: actual cases.
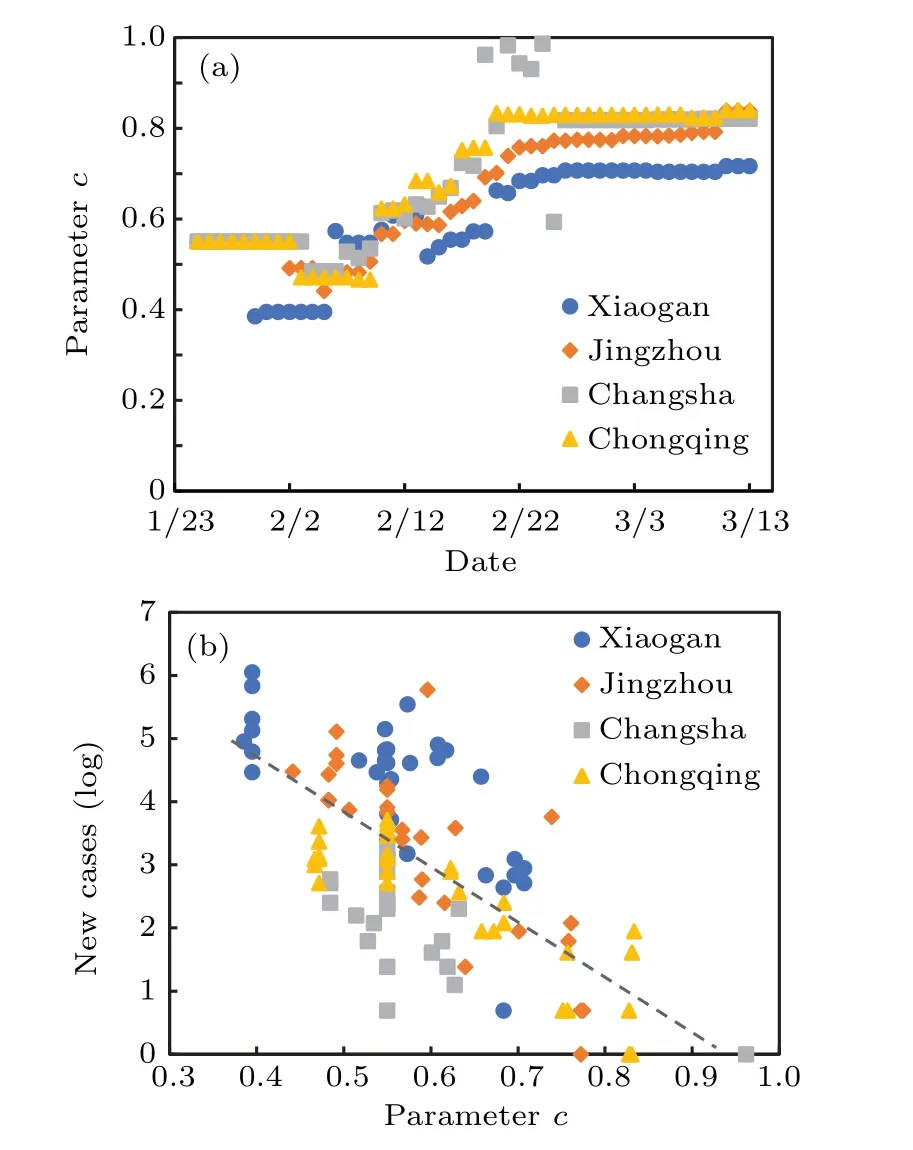
Fig. 7. The relationship between parameter c and new cases by city from January 25,2020 to March 13,2020.
Figure 7 illustrates the relationship between estimated parametercand new confirmed cases for Xiaogan, Jingzhou,Changsha and Chongqing from January 25,2020 to March 13,2020. We see that thec-value of Fig. 7(a) for the four cities increases over time and eventually tends to saturated, which indicates that personal prevention awareness is constantly improving. Therefore, the relationship between the daily new cases and the parametercin the four cities in Fig.7(b)shows a evident negative correlation,and the Pearson coefficients are−0.706,−0.786,−0.667 and−0.864, respectively. In fact,these parameters provide a new way for quantifying the effectiveness of the government policies toward controlling COVID cases.For example,the curve of Fig.7(a)for Xiaogan is lower than that of Jingzhou, Changsha and Chongqing, which indicates that the mitigation policies at Xiaogan is less effective than others. This could be one of the reasons why Xiaogan has more COVID-19 cases than the other cities.
Unfortunately,on July 20,2021,Nanjing broke the“zero increase”of local COVID-19 cases,and the strain that caused the Nanjing epidemic was Delta virus.[36]The continuous variation of SARS-CoV-2 results in various transmission characteristics. For this we estimate the characteristics of the Delta virus via fitting PDE model to confirmed cases in Nanjing from July 20, 2021 to August 12, 2021. As shown in Table 7, the results suggest that compared with the initial epidemic wave in Nanjing in early 2020,the personal prevention awarenessc2021=0.350 is lower thanc2020=0.627. Indeed,Chinese cities including Nanjing implemented unprecedented interventions for controlling the outbreak of COVID-19 in early 2020. In addition, we find that the fitted transboundary transmission rated(x)2021=exp(−2.60448)=0.074 is much higher than that ofd(x)2020=exp(−4.80041)=0.008,which indicates that Delta strain is more infectious. And, indeed,a recent study shows that the relative viral loads of cases infected with the Delta variant are 1260 times higher than those for the 2020 infections with clade 19A/19B viruses.[37]As a result,our comparative analysis demonstrates the effectiveness and scalability of the PDE-based prediction model in diverse modes of infectious diseases.

Table 7. Model parameter estimates of the second wave and the initial epidemic wave in Nanjing under the same epidemic time (24 days,duration of the second epidemic wave).
8. Discussion
In this paper,we developed a new computational network model based on PDEs to characterize the spread of COVID-19 in China and to predict COVID-19 cases. The proposed model incorporates Baidu migration data to capture the spread of epidemics along the edges of the city network. To ensure high COVID-19 prediction accuracy, we used historical case data,and included the human active interventions such as city lockdowns and social distancing into the model. As a result,our model can demonstrate the spread of COVID-19 in China and the reduction of the transmission of COVID-19 under the dual efforts of lockdown and social distancing,which provides a new way for quantifying the effectiveness of the government policies toward controlling COVID-19.
In the present work, we have selected eight cities with different geographical locations and social characteristics centered on Wuhan. One may be able to use statistical models or ODE models on multiple patches to predict COVID-19 cases.Here, we choose PDEs based network modeling mainly because the approach can accurately predict the COVID-19 cases for these cities,and further quantify the impact of human behavior on changes of COVID-19 cases in the city network.In addition, it is found that 57% of the early cases reported outside Wuhan had travel history to Wuhan before Wuhan was quarantined(before January 23,2020).[22]This highlights that the outflow from Wuhan is the main driving force for the spread of COVID-19 in China. In this regard, the developed epidemic model framework with PDE incorporated the outflows from Wuhan is suitable for describing the process of spreading along the discoverer of the outbreak to other cities in the city network.
Our approach can be extended to other data set that captures population flows (e.g., train ticket or road traffic data)to assist policy decisions,such as the allocation of manpower and resources for specific geographic regions based on the predicted epidemic trend,and hoping to provide localized results to suppress the ongoing COVID-19 epidemic or other sudden outbreaks of infectious diseases in the future.
杂志排行

Chinese Physics B的其它文章
- Transient transition behaviors of fractional-order simplest chaotic circuit with bi-stable locally-active memristor and its ARM-based implementation
- Modeling and dynamics of double Hindmarsh–Rose neuron with memristor-based magnetic coupling and time delay∗
- Cascade discrete memristive maps for enhancing chaos∗
- A review on the design of ternary logic circuits∗
- Extended phase diagram of La1−xCaxMnO3 by interfacial engineering∗
- A double quantum dot defined by top gates in a single crystalline InSb nanosheet∗