Sensitivity to external optical feedback of circular-side hexagonal resonator microcavity laser∗
2021-12-22TongZhao赵彤ZhiRuShen申志儒WenLiXie谢文丽
Tong Zhao(赵彤) Zhi-Ru Shen(申志儒) Wen-Li Xie(谢文丽)
Yan-Qiang Guo(郭龑强)1,2, An-Bang Wang(王安帮)1,2,3, and Yun-Cai Wang(王云才)3,4,‡
1Key Laboratory of Advanced Transducers and Intelligent Control System,Ministry of Education and Shanxi Province,Taiyuan University of Technology,Taiyuan 030024,China
2College of Physics and Optoelectronics,Taiyuan University of Technology,Taiyuan 030024,China
3Guangdong Provincial Key Laboratory of Photonics Information Technology,Guangzhou 510006,China
4School of Information Engineering,Guangdong University of Technology,Guangzhou 510006,China
Keywords: sensitivity,optical feedback,microcavity laser,nonlinear dynamic
1. Introduction
Optical feedback used to be considered as a nuisance at the beginning of laser development due to its undesirable and unpredictable effects on laser output.[1–3]After researchers analyzed the nonlinear dynamics of semiconductor laser subject to optical feedback in early 1980,[4]enormous research effort was initiated, especially when they realized these behaviors could be useful.[5–7]Among these behaviors, chaos has attracted much attention since the properties of random oscillation and wide bandwidth could be applied in random number generation,[8–10]secure communication,[11,12]key distribution,[13,14]high speed information processing,[15,16]ranging,[17–19]and so on.
Optical feedback is the simplest and most widely used method to generate chaotic laser.[20,21]But the feedback delay time can be acquired which is named as “time delay signature (TDS)”.[22]The TDS seriously affects the security of chaotic laser in communication since it implies a periodicity and weakens the randomness of the chaotic laser. This inspired researchers interest on how to suppress or eliminate the TDS,[23–25]but they found it is hard to accomplish without additional elements or devices.[26,27]
Our research group noticed that, the TDS is not totally adverse for chaotic laser application. In 2015, we took the advantage of the TDS to precise locate the fiber fault in time-division multiplexing passive-optical-network(TDMPON).[28]The fault reflection provides the feedback light to semiconductor laser for chaos generation, and the TDS reflects to the fault position. In this way, the fault reflection is detected by the semiconductor laser rather than the photodetector,avoiding the high sensitivity requirement for weak reflection power in other fault detection approaches. The dynamic range just depends on the sensitivity to the feedback level of the semiconductor laser. Moreover,the spatial resolution and detection accuracy of fiber fault are close to the technique of chaotic optical time domain reflectometer.[17]Therefore,higher sensitive to feedback will lead to excellent performance on fiber fault location with this TDS detection method.
In this paper, we use circular-side hexagonal resonator(CSHR) microcavity laser which has smaller internal cavity round-trip time to improve the sensitivity on optical feedback strength. Using Lang–Kobayashi equations, the output dynamics are numerically simulated and the critical feedback strength value for each state transformation is analyzed in detail. We define the sensitivity to the optical feedback strength in two aspects for fault detection and compare the sensitivity of CSHR microcavity laser with traditional distributed feedback(DFB)laser.The CSHR microcavity laser can respond to 0.07%feedback level which means−63-dB feedback strength and 1.001 variation degree on 1%feedback level change. Furthermore,the influence of some internal parameters on the sensitivity of CSHR microcavity laser is also demonstrated.
2. Theoretical model
Figure 1 shows the schematic diagram of CSHR microcavity laser with optical feedback, whereRis the side length of the laser active region andτfis the round-trip time of the external cavity. The sensitivity of CSHR microcavity laser with optical feedback is numerically simulated based on modified Lang–Kobayashi equations,[4]which are shown as follows:[29,30]
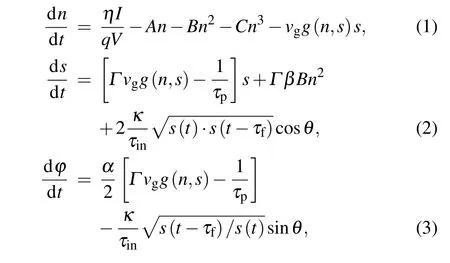
wherenandsare the carrier density and photon number density inside the microcavity,θ=ωτf+φ(t)−φ(t −τf) is the feedback optical phase,Iis the bias current,Vis the volume of the active region (V=πR2d),vg=c/ngis the group velocity of the lasing mode.κis the feedback level which is defined as amplitude reflection coefficient, andτinis defined asτin=2πngR/c.
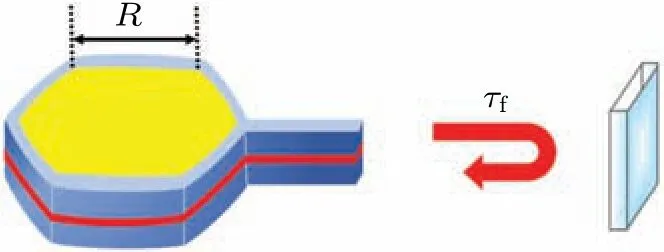
Fig.1. Schematic diagram of CSHR microcavity laser with optical feedback.
The gain coefficientg(n,s) is a logarithmic function related to three parameters(Ntr,Ns,g)to more accurately fit the gain of the quantum well material, and the nonlinear gain effect is taken into account. The expression of gain coefficient is presented as follows:

whereg0is the material gain coefficient,εis the gain suppression factor,Ntris the transparency carrier density,andNsis the gain parameter.
The rate equations (1)–(3) are calculated by the fourthorder Runge–Kutta method and parameter descriptions and values are shown in Table 1.

Table 1. Parameter values for CSHR microcavity laser used in our simulations.[29,30]
3. Simulation results
3.1. Dynamic states
The CSHR microcavity laser with different feedback levels shows five dynamic states,which are stable,period-1 oscillation(P1),switching between stable and period(S-P switching), quasi-period oscillation (QP), and chaotic state, respectively. Figure 2(a) demonstrates the feedback levelκboundaries of states diagram under 1.3Ithpump current with external cavity round-trip timeτfchanging from 2 ns to 20 ns. Very weak feedback bellowing 0.02%cannot disturb CSHR microcavity laser to transform into unstable state,shown as gray region. As shown in blue and green regions,when the feedback level increases above the boundary but still under 0.055%,the laser output will transform to period-1 state or switching between these two states. Quasi-period state emerges after S–P switching state with the feedback level increasing, which is followed by the chaotic state when the feedback level exceeds 0.08% boundary. Although higher feedback level will make output transfer to stable state again, this is beyond the scope of our sensitivity study. Moreover,theτfonly has a little impact on the boundary value except theτfis very small. As shown in Fig.2(a),the feedback level boundary fluctuates dramatically when the external cavity below 3.5 ns,and gradually becomes flat in long cavity length. In the application of TDMPON fault detection,the fiber length is far more than the short cavity definition for chaos generation.

Fig.2. (a)The feedback level boundary of each state with different external cavity round-trip time τf in optical feedback CSHR microcavity laser biased at 1.3Ith. (b)–(e)The time series,power spectrum, and auto-correlation function(ACF)of each state with I=1.3Ith, τf =5 ns. P1: period-1 oscillation; S–P switching: switching between stable and period states;QP:quasi-periodic oscillation.
Figures 2(b)–2(e)respectively show the four states of P1,S–P switching, QP, and chaotic state with 5-ns external cavity length and 1.3Ithpump current. The time series, power spectrum, and auto-correlation curve of each dynamic state are demonstrated in the figures, respectively. In the state of P1,the laser output with single period in 2.32 GHz which are shown in Figs.2(b1)–2(b2), and the auto-correlation curve is similar with time series(Fig.2(b3)). The power spectrum has a peak at the relaxation oscillation frequency(fR=2.32 GHz).Figure 2(c) shows the S–P switching state which is similar with the phenomenon reported by Chan.[31]In time series, it is shown as periodic switching between periodic and stable states(Fig.2(c1)). The repetition period is the external cavity round-trip time. Harmonics of the external cavity frequency appear in the power spectrum, as shown in Fig. 2(c2). The auto-correlation function curve appears as a slow modulation period ofτf(Fig.2(c3)).
The period oscillation in the S–P switching state will be replaced by irregular fluctuation,named as QP state when the feedback level is further increased, as shown in Figs. 2(d1)–2(d3). In Fig. 2(d2), more frequencies appear in the power spectrum. Figures 2(e1)–2(e3) show the characteristics of the chaotic state. The time series waveform fluctuates in larger amplitude irregularly, the spectrum becomes broaden and flatten, and respectively represented in Figs. 2(e1) and 2(e2). Some sharp peaks appear in the auto-correlation function curve at the positions of 0 ns and±5 ns,corresponding to 0 and external cavity roundtrip time,as shown in Fig.2(e3).
3.2. Critical feedback level
We use the definition of the critical feedback levelκc,which is the boundary of the laser output transforming to unstable state,to explain the relationship between the sensitivity to feedback level and laser parameters. The critical feedback level proposed by Acketet al.in 1984,[32]and further simplified by Helms and Petermann in Ref.[33], is shown in the following expression:
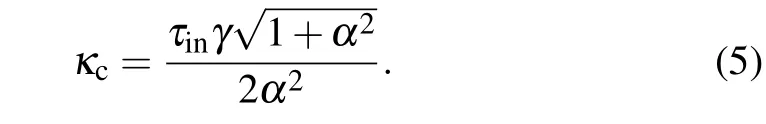
Only three parameters of the laser are involved in this equation: the linewidth enhancement factorα, the damping rateγ,and the internal cavity round-trip timeτin. We analyze the critical feedback level through characters of laser output by changing the parametersτinandα, and other parameters are still the same as before (I=1.3Ith,τf=5 ns). In Fig. 3,the red dots are the simulation results with red solid line fixed,and the dashed line represents prediction results of Eq. (5).As shown in Fig. 3(a), the simulation and calculation results are highly consistent, representing the linear relationship betweenκcandτin. Whenτindecreases to 0.25 ps, the critical feedback level can reach to 0.01%. Different from the linear relationship, whenαincreases,κcdecreases rapidly first and then tends to be flat,as shown in Fig.3(b). The simulation results gradually close to the results of Eq.(5)whenαincreases to 4. When the value ofαis above 4,the two results coincide with each other completely.
The comparation between the simulation and prediction results indicates a good agreement for our following sensitivity analyzation based on this simulation.
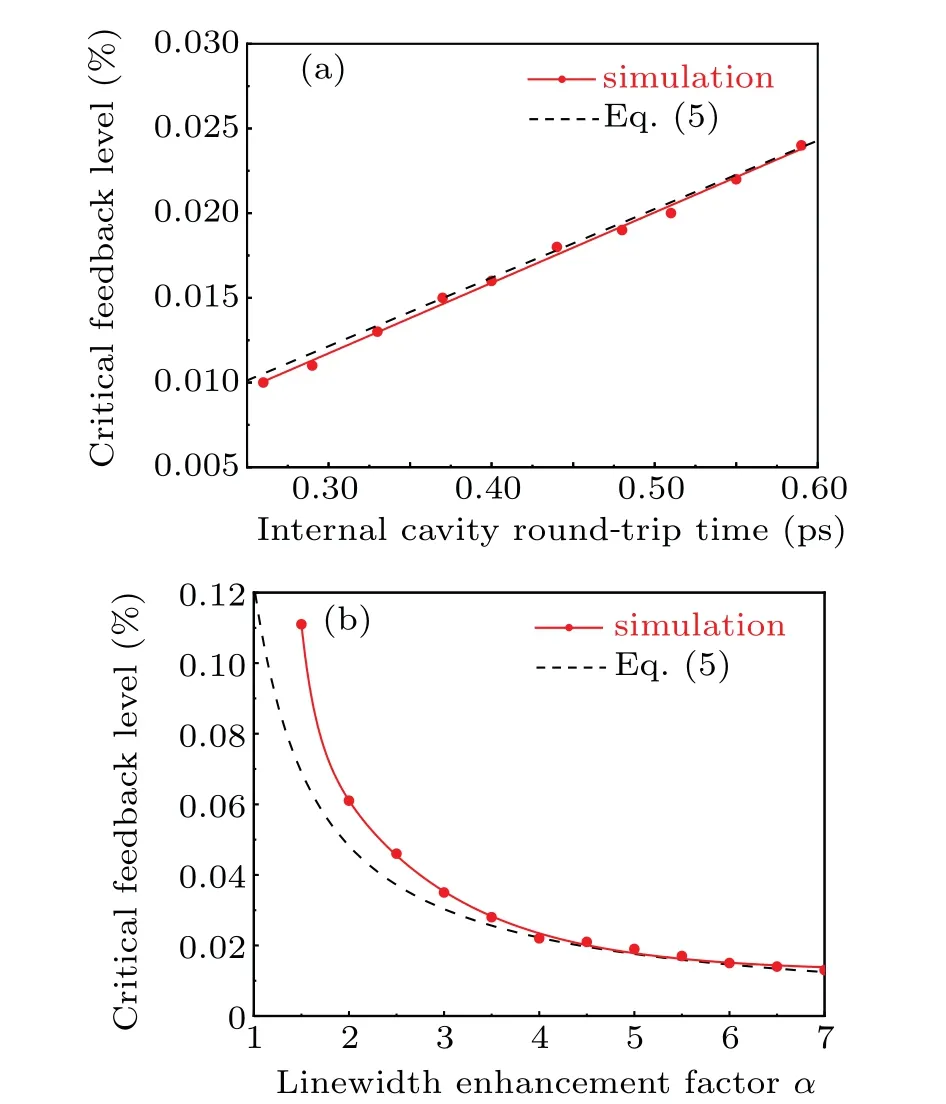
Fig. 3. Critical feedback level versus the internal cavity round-trip time τin(a) and linewidth enhancement factor α (b). Red solid curves: fixed simulation results (red dots) with τf =5 ns. I =1.3Ith; black dashed curves:prediction results calculated by Eq.(5).
3.3. Time delay signature
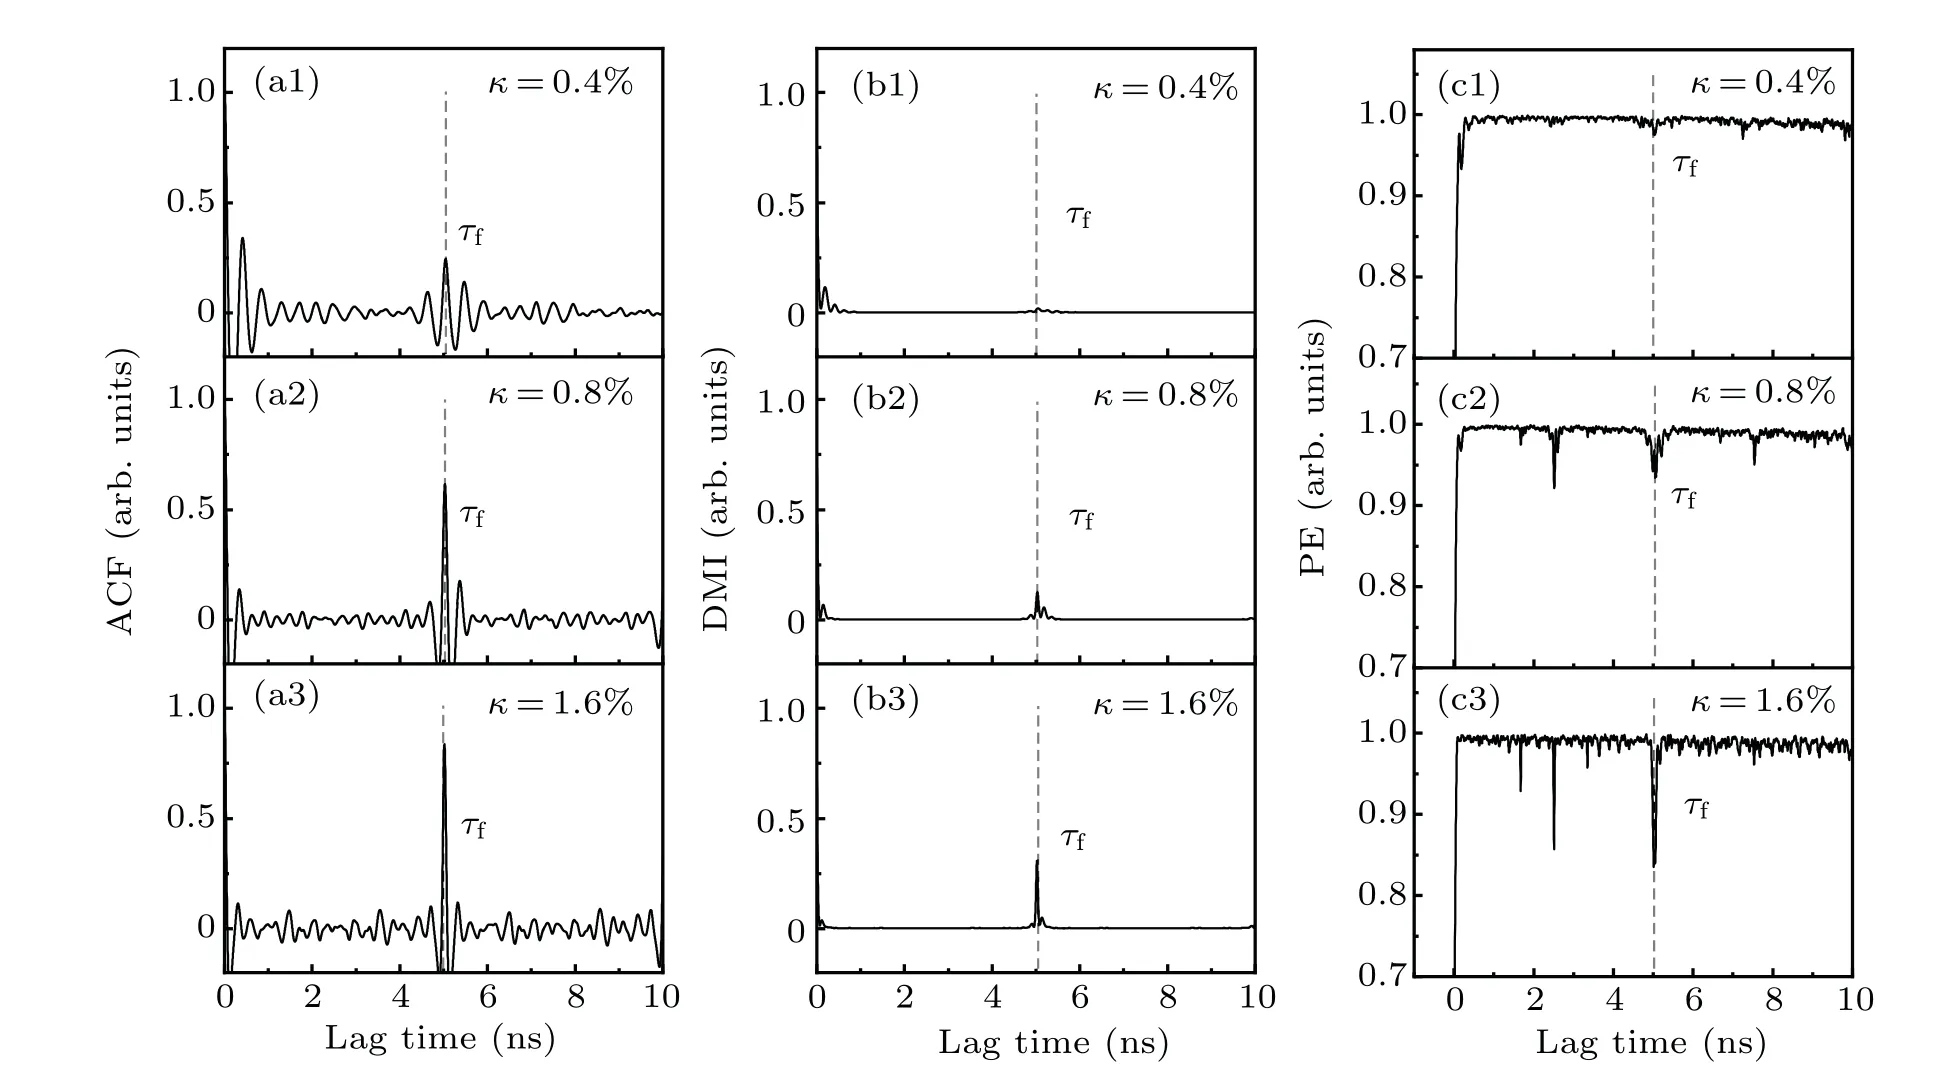
Fig.4. The ACF(a),the DMI(b),and the PE(c)as a function of κ for the optical feedback. I=1.3Ith,τf=5 ns. (I):κ=0.4%,(II):κ=0.8%,and(III):κ =1.6%.
In previous work on fiber fault location using TDS detection method,[28]the feedback level provided by fault reflection must reach a certain intensity to make the output of laser to be QP or chaotic state. Only in these two states, the TDS can be acquired. Here,we analyze the TDS variation in auto-correlation function (ACF), delayed mutual information(DMI) and permutation entropy (PE) with different feedback levels. In this section, the bias current of laser and the external cavity round-trip time are respectivelyI= 1.3Ithandτf=5 ns. Figures 4(a1)–4(a3) show the ACF curve of laser output under three different feedback levels: 0.4%,0.8%,and 1.6%. It is observed that,the TDS which corresponds toτfoccurs at position of 5 ns and the level of TDS increases withκ.Similar tendency, that is the peak level of TDS increasing as feedback level,also appears in DMI and PE curves,as shown in Figs.4(b1)–4(b3)and 4(c1)–4(c3).
One obvious difference between ACF and DMI or PE is that the TDS hardly to observe by DMI or PE when the feedback level is weak(0.4%),as shown in Figs.4(b1)and 4(c1).Once the feedback level becomes strong,the peak level of TDS rises faster as presented in Fig.4(b2). In Figs.4(c2)and 4(c3),there are more peaks emerge before TDS (position of (1/2)τfand (1/3)τf) in PE curves, and these peaks will influence the judgment of TDS position. Thus, the TDS analyzation based on PE curves is not suitable for fiber fault location.
The results shown in Figs. 4(a) and 4(b) also demonstrate the different change degrees of TDS in ACF and DMI methods. In the TDS analyzation-based ACF, the peak level increases from 0.24 to 0.84 when the variation of feedback level is 1.2%. But in DMI method, a growth of peak level of TDS ranges from 0.02 to 0.31 under the same feedback level change range. This variation degree reflects the sensitivity to the smallest change on feedback level of CSHR microcavity laser. Therefore,the sensitivity on this variation degree is also included in our sensitivity study.
3.4. Sensitivity to feedback level
In this section,we define the sensitivity criterion from two aspects.
(i)Determining the minimum feedback level. Only when the laser enters into QP or chaotic state,can TDS be observed in ACF or DMI curve. In fiber fault location, this property will be helpful to detect the weak light, and has the potential to improve the dynamic range or detection distance.
(ii)Finding the variation degree of TDS peak levelversusthe feedback level changing. The variation degree represents the laser responsivity on slight change in feedback level,which means the measurement accuracy of fault reflectivity.
By measuring the TDS level in ACF and DMI curves to quantificationally investigate the sensitivity to feedback level of CSHR microcavity laser. The sensitivity of DFB laser is also studied as a comparison. The pump current and external cavity round-trip time of CSHR microcavity laser and DFB laser are same (I=1.3Ith,τf=5 ns) and the internal cavity round-trip time(τin)of these two lasers are different(CSHR:τin=0.55 fs, DFB:τin=7.4 fs). Other parameters of DFB laser refer to the reference paper.[23]
Figure 5(a) demonstrates the peak level of TDS in ACFversusfeedback level of CSHR microcavity laser (red curve)and DFB laser(black curve),respectively. Similar to the previous research on TDS,[22,28]the curve looks like a well decreasing to the bottom and then rising as feedback level increases. One significant difference is that the TDS appears in ACF curve of CSHR microcavity laser much earlier than DFB laser with the feedback level increasing, due to the smallerτin. The inset plots the magnified view of the red curve. It shows that the minimum feedback level for CSHR microcavity laser reduces to 0.07% and at 0.27% when the TDS level decreases to the bottom. From this point on,the CSHR microcavity laser output transforms from QP state to chaotic state.The TDS level increases rapidly and is followed by a slowly rise to stable value. But in the result of DFB laser, the curve starts at feedback level of 0.7%, down to the lowest point at 2.8%,and then rise as the same trend with CSHR microcavity laser. Although the bottom value of these two curves is different,the existence of TDS satisfies the requirement for the fault location in our study, due to the high insertion loss in TDMPON.Similar phenomena also appear in the DMI analyzation curves, as shown in Fig. 5(b). The critical points (minimum and inflection points) of feedback level are the same as the points in Fig.5(a),because the laser output enters in the same state.
According to the above illustration, the sensitivity to the minimum feedback level (criterion (i)) of CSHR microcavity laser is much higher than DFB laser.Similar as the analyzation of critical feedback level by Eq. (5), the huge improvement on sensitivity attributes to the shorter internal cavity roundtrip time of CSHR laser rather than DFB laser. Depending on the ‘20log’ calculation rule, the amplitude feedback level of 0.07%corresponds to the feedback strength of−63 dB,which improve about 20 dB for the optical feedback detection compared with DFB laser.

Fig. 5. The influence of feedback level on the TDS of CSHR microcavity laser(red dot)and DFB laser(black square)subject to optical feedback. The TDS level in(a)ACF and(b)DMI with the changing of feedback level,and the curves are the data fitting. The curves of CSHR microcavity laser are magnified in the insets. CSHR: τin =0.55 fs, τf =5 ns, I =1.3Ith; DFB:τin=7.4 fs,τf=5 ns,I=1.3Ith. The unit a.u. is short for arb. units.
Moreover, in order to study the TDS variation degree to the feedback level changing (criterion (ii)), we fix the curve slopeKwhen the laser output enters in chaotic state,shown as blue dashed line. Obviously, the slope of CSHR microcavity laser is greater than DFB laser whatever in ACF curve or DMI curve. In Fig. 5(a), the slope value of 1.001 means a 1.001 increasement with 1% feedback level changing in CSHR microcavity laser, and the slope of DFB laser is just 0.056. But in DMI curve, there is only one order of magnitude difference between these two values (0.26 and 0.017). Therefore,the ACF is more suitable for the analyzation on TDS variation sensitivity.
Depending on Eq.(5),the laser sensitivity to feedback is mainly related to three critical parameters(τin,γ,andα). Figure 6 illustrates the influence of these critical parameters on the slopeK. In the structure of CSHR microcavity laser, the internal cavity round-trip time is determined by the active region side lengthR. We changeRinstead ofτinto analyze theKof TDS level variation with feedback level change,like the blue dashed line in Fig. 5. As shown in Fig. 6(a), the slope decreases withRincreasing from 3.5 µm to 8 µm as a linear relationship, which means the sensitivity to the feedback level variation of CSHR microcavity laser is higher in small volume.
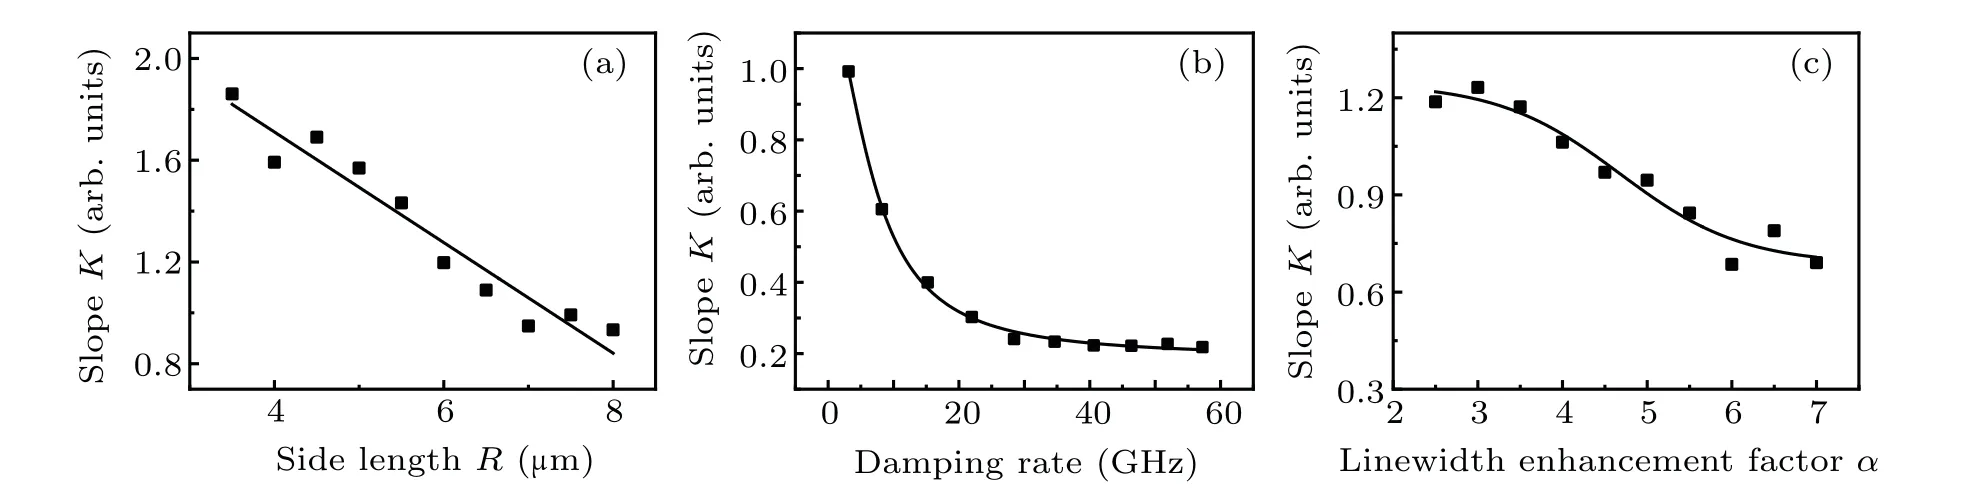
Fig. 6. The influence of (a) active region side length, (b) damping rate, (c) linewidth enhancement factor of CSHR microcavity laser on the feedback level variation sensitivity I=1.3Ith,τf=5 ns.
The relationship betweenKandγis demonstrate in Fig. 6(b). After a rapid decline, the slope tends to be flat around 0.2 when the damping rate increases to 25 GHz. The higher damping rate means a faster response to transfer to one output state,and thus the laser sensitivity to feedback variation will maintain at a fixed level when this response speed reaches a threshold. The linewidth enhancement factorαplays an important role in the dynamic characteristics of the laser.A gradually decreasing curve illustrates the impact ofαon the slopeK, as shown in Fig. 6(c). Therefore, minor volume, slow response,and small linewidth enhancement factor of the CSHR microcavity laser can induce a higher sensitivity to the optical feedback.
4. Conclusion and perspectives
Higher sensitivity for optical reflection will play an important role in fiber fault detection,especially in the wide coverage TDM-PON with vast branch. In our previous research,the TDS,which is a unique property for chaotic laser,is used to realize fiber fault location. The high spatial-resolution performance is similar with chaotic optical time domain reflectometry, and the structure is simpler because the fault reflection is received by laser rather than photodetector. However, the sensitivity to the optical feedback of the laser is determined by some critical parameters, including internal cavity round-trip time.
In this study, we numerically simulated the sensitivity to feedback level of CSHR microcavity laser which owns a smaller internal cavity round-trip time than DFB laser. We analyze the sensitivity from two aspects which are the minimum feedback level for TDS emerging and the variation degree of TDS level on feedback level changing. Compared to DFB laser,the sensitivity for the minimum feedback level of CSHR microcavity laser is improved at least one order of magnitude,corresponding to the increase of 20-dB feedback strength.The increasement of 1.001 on TDS level in auto-correlation function curve just requires 1%feedback level changing for CSHR microcavity laser. This variation degree is much higher than the value of 0.056 for DFB laser. In addition,we demonstrate the influence of active region side length, damping rate and linewidth enhancement factor on this variation degree,respectively.
In fiber fault location, the improvement of 20-dB sensitivity corresponds to 20-dB dynamic range or 100-km fiber length, and this performance could change the present situation of weak light detection. Although the respond scope of CSHR microcavity laser is shrunk rather than DFB laser(Fig.5),it cannot affect the use in massive branch optical network due to the branch splitting. Furthermore,the large variation degree on feedback level changing could enhance the accuracy of fiber sensing system.
猜你喜欢
杂志排行

Chinese Physics B的其它文章
- Transient transition behaviors of fractional-order simplest chaotic circuit with bi-stable locally-active memristor and its ARM-based implementation
- Modeling and dynamics of double Hindmarsh–Rose neuron with memristor-based magnetic coupling and time delay∗
- Cascade discrete memristive maps for enhancing chaos∗
- A review on the design of ternary logic circuits∗
- Extended phase diagram of La1−xCaxMnO3 by interfacial engineering∗
- A double quantum dot defined by top gates in a single crystalline InSb nanosheet∗