Proton loss of inner radiation belt during geomagnetic storm of 2018 based on CSES satellite observation∗
2021-12-22ZhenXiaZhang张振霞XuHuiShen申旭辉XinQiaoLi李新乔andYongFuWang王永福
Zhen-Xia Zhang(张振霞) Xu-Hui Shen(申旭辉) Xin-Qiao Li(李新乔) and Yong-Fu Wang(王永福)
1National Institute of Natural Hazards,MEMC,Beijing 100085,China
2Institute of High Energy Physics,Chinese Academy of Sciences,Beijing 100049,China
3Institute of Space Physics and Applied Technology,Peking University,Beijing 100871,China
Keywords: proton loss,the inner radiation belt,CSES satellite,field line curvature scattering
1. Introduction
The Earth’s magnetosphere is filled by charged particles forming the inner and outer radiation belts. The acceleration or loss mechanisms of particles in the radiation belts are hot topics in the inner magnetosphere physics. The majority of past studies concentrated on the evolution of energetic electrons and protons in the outer radiation belt associated with the occurrences of geomagnetic storms.[1–7]However,the storms also often affect the particle population disturbance in the inner radiation belt and the South Atlantic anomaly(SAA),which is a region filled with a weakened magnetic field located on the coast of Brazil.[8]
As is well known, the protons in the inner radiation belt are considerably stable for a lengthy period of time,and usually vary with the 11-year solar activity cycle.[9]However,the proton flux level is also often affected by strong geomagnetic storm when the induced disturbances reach very lowL-shell values. It has been pointed out that the proton loss in the inner belt possibly consists of three kinds of mechanisms during geomagnetic storms:[10,11]magnetic field curvature scattering,[12–14]Coulomb collision due to neutral atmosphere density variation,[15,16]and source variation induced by cosmic ray albedo neutron decay,i.e., CRAND.[17]In mechanism of magnetic field curvature scattering the proton fluxes can decrease or disappear at aroundL-shells of 2 and the influence tends to be energy-dependent. It is thought that the increase in the magnetic field curvature can induce a trapped proton loss through the adiabatic motion breakup of particles,which mainly occurs in the outer boundary of the inner radiation belt. However,it has ever been mentioned that the stormterm variation in the two SAA parameters could not be caused by the flux variation of cosmic rays during storms due to the small flux of cosmic rays and the slow response to the Forbush decrease of cosmic ray flux.[10]Therefore, the mechanism of field curvature scattering and Coulomb collision probably play much more important roles in proton loss in the inner belt during storms.
The CSES mission launched the first satellite[18]in China in February, 2018 to measure geophysical fields, which will have a lot of application prospects in the study of seismology, geophysics, space sciences, and so on. Based on the CSES satellite data (also named as ZH-1 satellite), our research group has reported the relativistic electron (1 MeV–3 MeV)flux enhancement accelerated in an extremely lowLshell (L ∼3) by a chorus wave during the storm of August,2018.[19]During the main phase of this storm, the energetic electrons are injected into the inner magnetosphere, and the plasmasphere is suppressed into an extremely low position ofL ∼2.5.
In this paper, based on the observational advantage of CSES satellite,with the sun-synchronous polar orbit and better energy resolutions for high-energy particle detectors compared to other similar low-orbit satellites, we will investigate proton evolution in the inner radiation belt and SAA region during severe geomagnetic storm of 2018 as well as the potential interpretations of the driving mechanism.
2. Introduction of high energy particle detection onboard CSES satellite
The sun-synchronous CSES satellite was launched in February 2018, with the inclination of 97◦flying at an altitude of 507 km. The onboard high energy particle package instruments consist of the low-energy detector(HEPP-L)and the high-energy detector(HEPP-H).[20]HEPP-L can measure the electron fluxes with energy range from 0.1 MeV to 3 MeV and the proton fluxes with energy 2 MeV–20 MeV. The energy ranges are divided into 256 energy channels with energy resolution≤8.9%@1 MeV for electron. HEPP-H can measure the electron fluxes in energy 1.5 MeV–50 MeV and proton fluxes in energy 15 MeV–200 MeV.The energy resolution for proton detection is≤10%@15 MeV–200 MeV.The high energy particle package instruments also have a good electron/proton identification efficiency. For HEPP-L, based on the 207Bi radiation source and the tandem accelerator beam,according to the ratio of the deposited energy on the first layer and the second layer of silicon chips of detectors, the correct proton selection efficiency is better than 92.98%. For HEPPH, the species of particles are discriminated using the ratio∆E/Eof deposited energy in the silicon strip detector and incident energy measured by the calorimeters.The identification efficiency can reach up to 99%for protons in HEPP-H.[20]
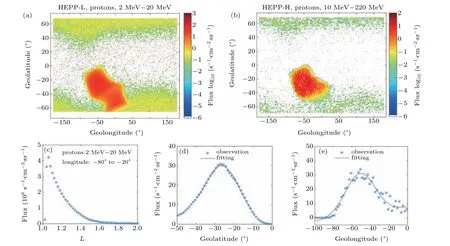
Fig.1. [(a)and(b)]Map of proton distribution in SAA observed by HEPP-L and HEPP-H particle detector onboard CSES satellite. (c)Proton flux distribution with L-shell corresponding to longitude range −80◦∼−20◦. [(d)and(e)]The central value of geophysical latitude and longitude for protons by the gaussian fitting. Star-dotted distributions come from observation,and blue lines come from fitting results.
The particle instruments are turned off when the satellite flies at a latitude>65◦both in the southern and northern hemispheres. The sun-synchronous orbit has a descending node at 14:00 MLT and an ascending node at 2:00 MLT,with an orbit cycle of 94.6 min. It should be noted that the features of the sun-synchronous orbit of ZH-1 determine the narrowly covered MLT range of observations. The ascending orbits are concentrated at approximately 1:00–3:00 MLT on the nightside, and the descending orbits corresponding to approximately 13:00–15:00 MLT on the dayside.
TheL-shell value used in this paper is calculated according to Mcllwain’sL-shell method[21]based on the IGRF model[22]combining with external field T04s model[23]which is more suitable to be adopted during large magnetic storm.The detailed calculation resorts to the code provided by the free library.[24]
3. Map of proton distribution and precise observation of SAA region
Figure 1 shows the overview contour of proton population observed by HEPP-L and HEPP-H detectors onboard CSES satellite using one month-observed data from July 22 to August 22,2018 during quiet space weather condition,in which the SAA is clearly displayed. Figures 1(a) and 1(b) exhibit proton map in geographical latitude and longitude at pixel 1◦×1◦,with proton energy range 2 MeV–20 MeV and energy range 10 MeV–220 MeV, respectively. From the flux distribution withL-shell corresponding to longitude−80◦∼−20◦shown in Figs. 1(c) and 1(d), we can see that the proton flux maximum locates aroundL ∼1.06, which is consistent with previous reports.[25]
Using the comparatively more stable proton distribution,we can define the SAA region by observations. We project the proton flux distribution in latitude direction corresponding to longitude range−20◦∼−80◦and derive the central latitude value of a proton flux peak at 26.6◦by gaussian fitting.The fitted central longitude value is−51.8◦corresponding to latitude range−45◦∼−10◦.
The trapping and distribution of energetic particles are controlled by the Earth’s magnetic field configuration. So the distribution or the change of geomagnetic field can lead to a drift of the trapped particles in SAA. Compared with the results that Gautamet al.[26]has ever measured for the central latitude value 31◦and longitude value−45◦in 1995, we can calculate that SAA shift westward at a speed of 0.29◦±0.07◦per year in the past 23 years. The westward shift speed is approximately consistent with the result reported in 1995 which is thought to be strongly anti-correlated with space weather index F10.7.[9,27–31]Some studies have ever suggested that the central proton flux position drifts southward during high solar activity period and drifts northward during low solar activity period.[32]So precise drift situation in latitude direction needs more detailed investigations according to the space weather conditions covering a long-term observation of at least several solar activity years,which goes beyond our study scope of this paper and remains to be studied in the future. Therefore in this section we investigate the extensive distribution feature of SAA in order to mainly prepare some important information for the following analysis of electron and proton evolution during storm. On the other side, the good accuracy of SAA position provides an evidence of high qualified detection of high energy particles by ZH-1 satellite.

Fig.2. (a)Solar wind pressure,(b)KP index,(c)geomagnetic storm index Dst,(d)IMF Bz.
4. Observed proton loss of the inner radiation belt during storm
During the period of 25 August to 1 September in 2018,a major geomagnetic storm occurred with the miminum Dst≈−179 nT at around 06:00 UT on 26 August,as shown in Fig.2.During the initial phase of the geomagnetic storm,the dynamic pressure of solar wind rose toP ≈7 nPa, and the interplanetary magnetic field (IMF) shifted between the northward and southward directions,with a negative(or southern)maximum Bz≈−15 nT.
4.1. Proton loss inside SAA region
Firstly, we investigated the proton flux evolution with a lower energy range(2 MeV–20 MeV)observed by HEPP-L in the SAA region. From an overview observation of the SAA region in Fig. 1, we define the SAA region locating at geographical latitude (−10◦,−45◦) and longitude (−20◦,−80◦),which will be used in the following analysis.
Figure 3 shows the proton energy spectra within the range of 2 MeV–20 MeV corresponding to the SAA region observed by HEPP-L on the dayside and nightside. From the energy spectra of Fig. 3(a), we can see that the the proton flux decreased by around 2 times during the main phase of the storm on August 26,and then recovered rapidly again during the recovery phase. The feature of proton evolution at the nightside before and after the storm is similar to that on the dayside,but the flux did not rapidly recover to an original level during the recovery phase. One aforementioned possible mechanism is that, as a result of the enhanced neutral atmospheric density during storm,the frequency of Coulomb collision between the trapped protons and atmospheric particles increases,resulting to the extra losses of the inner belt protons. Krausset al.have studied the neutral mass density variations triggered by geomagnetic storm on 26 August 2018 using GRACE Follow-On data shown in Fig.8 of their paper.[33]It provides the evidence that the neutral mass density was indeed enhanced significantly during the storm occurrence. It has also been reported in Ref.[10] by CHAMP satellite observations that the global thermospheric density near 410 km exhibits a large enhancement during the severe 2003 geomagnetic storm.[10,15]What is more, nighttime density disturbances more readily propagate to equatorial latitudes,possibly facilitated by the predominant equatorward flow in both hemispheres due to the diurnal tides driven byin situEUV heating. This is just agreement with the phenomenon in our this work that the flux in nighttime did not rapidly recover back as in daytime during the recovery phase.Therefore we think this mechanism of Coulomb collision due to the neutral atmospheric density variation may play an important role in proton loss of SAA region and also explain why the variations of protons in dayside and nightside are different.However the real fact must come from many kinds of mechanisms due to the complicated space environment, a further accurate and quantitative analysis is indeed beyond our scope of study and we remain to be investigated in the future.
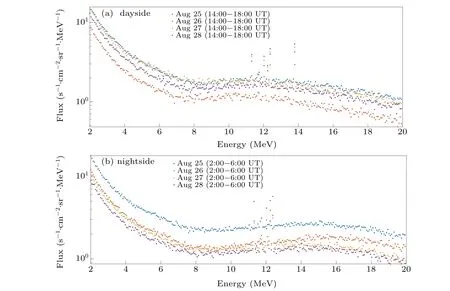
Fig.3. The proton energy spectra evolution in SAA observed by HEPP-L at dayside and nightside,during initial phase,main phase,and recovery phase of storm of August 2018.
4.2. Proton loss in outer boundary of inner radiation belt
This part is about the higher energy proton variation feature in the inner radiation belt during storm occurrence. Figure 4 shows the temporal evolution of protons in the inner radiation belt (outside of the the SAA) during the storm observed by HEPP-H, including four energy ranges (10 MeV–35 MeV,50 MeV–60 MeV,100 MeV–110 MeV,and 180 MeV–220 MeV).The proton measurements are color coded based on the logarithm and sorted inL-shell(Lbin width: 0.1). We can see that the trapped protons have a clear outer boundary for the inner radiation belt and a positional variation of the outer boundary owing to the fact of proton losses. The outer boundary of the inner radiation belt are denoted by the red dotted lines before August 26(quiet time)and the black dotted lines after August 26 (storm time). The enhanced fluxes in the region ofL>2.5 appearing from August 26 could have come from the high energy electron contamination,which is consistent with NOAA observation.[11]The outer boundary of the inner radiation belt decreased significantly inL-shell direction when the storm occurred on August 26 for an energy level of 10 MeV–110 MeV, but no significant change occurred at the energy range of 180 MeV–220 MeV. This proton loss in the outer boundary of the inner radiation belt lasted for a longer time, at least more than 10 days, which is different with the low-energy protons(2 MeV–20 MeV)observed by HEPP-L in temporary terms. This suggests that there must exist a different mechanism for a different energy proton loss. A theory[13]has been put forward that the field line curvature can cause a breakdown of the first adiabatic invariant of the particles trapped in the radiation belt and that the pitch angle of the particles can be scattered. The high energy proton loss in Fig.4 may be induced by this mechanism. According to this theory,the adiabaticity parameter is defined as
ε=rg/rc, rg=p/(qB0),
wherergdenotes the gyroradius of the particle,pindicates the momentum,qis the electric charge,B0denotes the magnitude value of geomagnetic field at equator andrcrepresents the curvature radius of the field line atB=B0. It has been shown[36]that in regions where the ratio of the particle’s gyroradiusrgand curvature radius of field linercis close to 1,the main reason for this proton change comes from the centrifugal impulse given to the particle as it navigates the curved field.

Fig.4. Proton evolution during large magnetic storm of August 2018 observed by HEPP-H onboard CSES satellite, including four energy ranges 10 MeV–35 MeV,50 MeV–60 MeV,100 MeV–110 MeV,and 180 MeV–220 MeV.The outer boundary of the inner radiation belt are denoted by red dotted lines before August 26(quiet time)and black dotted lines after August 26(storm time). The flux enhancement within the region of L>2.5 appearing from August 26 could come from the high-energy electron contamination.
Figure 5 exhibits the geomagnetic field and the curvature radius of field line at quiet time and storm time,which are denoted by blue doted lines and red dashed lines,respectively,in each panel.It has generally been thought the scattering threshold is set toε=0.1 for the high-energy particles near the edge of the loss cone.[13,14,37]Figure 6 is the adiabaticity parameterεvarying withL-shells for four proton energy channels of 30, 50, 100, and 200 MeV, as shown in Figs. 6(a)–6(d),respectively. The blue solid curve lines denote the results of the quiet time and the red dotted lines are for the storm time.The quiet time corresponds to the period of 2:00–12:00 UT on August 24 before the storm occurrence,and the storm time is during 2:00–12:00 UT on August 26 during the main phase of the storm. The black horizontal dashed–dotted lines indicate the scattering threshold ofε=0.1. The vertical dashed–dotted lines show the criticalLshell values of the field-line curvature scattering passing through the crossing points of an adiabaticity parameter with a scattering threshold ofε=0.1,for the quiet and storm time, respectively. The calculated results of the scattering threshold induced by a geomagnetic field line curvature are in good agreement with the proton loss observed in the outer boundary of the inner radiation belt in energy channels of 50, 100, and 200 MeV. Both of the calculations and observations support that the outer boundary of the inner belt declines from approximately 2.3 to 2.1 in theL-shell for protons of 50 MeV,and from 2.1 to 1.9 for protons of 100 MeV.The case for protons of 200 MeV has almost no disturbances and the outer boundary of the inner belt maintains a stable level during the storm occurrence. In terms of a lower energy proton channel of 30 MeV,the calculated result(decreasing from 2.7 to 2.4L-shells)deviates slightly from the observation(from 2.4 to 2.1)in Fig.6(a),which may be caused by errors existing in the theoretical calculations or satellite observations,or may be mixed by other mechanism remained to be studied in the future.

Fig.5. (a)The geomagnetic field,(b)the curvature radius of field line,at quiet time and storm time.
Thus, using CSES satellite data, we observed the phenomenon of proton loss and confirmed the viewpoints that the high-energy proton loss in the outer boundary of the inner radiation belt is mainly induced by the field line curvature during this major storm. However,we cannot completely rule out the existence of other possible mechanisms for proton loss at this energy range, if they exist, perhaps they tend to be more effective in lower or higher energies or at a larger time scale for proton losses in the inner radiation belt.[38]

Fig.6. The adiabaticity parameter ε as a function of McIlwain’s L-shell for four proton energy channels of 30, 50, 100, and 200 MeV protons in panels(a)–(d),respectively. The blue solid curves denote the results of the quiet time and the red dotted lines denote those of the storm time. The black horizontal dashed–dotted lines present a scattering threshold of ε =0.1. The critical L shells of the field–line curvature scattering are denoted by the vertical dashed–dotted lines for the quiet and storm times,respectively.
5. Conclusion and discussion
We investigated the extensive proton variations in the inner radiation belt in a wide energy range of 2 MeV–220 MeV during 2018 major geomagnetic storm. Here we list the main conclusions below.
(i)The result indicates that the loss mechanism of protons was energy dependence which is consistent with some previous studies.
(ii)For protons at low energy 2 MeV–20 MeV,the fluxes were decreased rapidly during main phase of the storm and did not come back quickly during the recovery phase, which is likely to be caused by Coulomb collision due to neutral atmosphere density variation.
(iii)At higher energy 30 MeV–100 MeV,it was confirmed that the magnetic field line curvature scattering plays a significant role in the proton loss phenomenon during this storm.
(iv)At highest energies>100 MeV,the fluxes of protons remained a stable level and did not exhibit a significant loss during this storm.
The field–line curvature can cause a breakdown of the first adiabatic invariant of the particles trapped in the radiation belt and the pitch angles of the particles can be scattered. It is necessary to be emphasized that this effect can happen only when the particle’s gyroradius and curvature radii of field line are close to each other. The electron mass is too small to meet this condition,so the electrons are very difficult to be scattered by field line curvature effect.
The contamination by electrons surely exists for all the proton detection and it is not able to be removed completely.Fortunately, the instruments HEPP-L and HEPP-H onboard ZH-1 have a good ability to identify the particles, with the identification efficiency>90%for electrons and protons(the more details can be seen in Ref. [20]). Thus, although the contamination by electrons exists more or less, we think it is unnecessary to worry about the influence on the main conclusions qualitatively. However, the quantitative estimation of electron contamination has exceeded our scope of study and has to be investigated in the future. What is more, the electrons with a smaller mass are very difficult to be scattered by field line curvature effect, so this reasonably allow us not to worry about the contamination from electrons too much when we consider the proton loss during storm.
It is very meaningful and helpful to deeply understand the high energy particle disturbance in radiation belt physics during active space weather period. The proton loss observation during this storm in radiation belt by CSES satellite represents the great ability for our country to precisely monitor the flux variations for MeV protons in radiation belts,and we are able to make some preparation to monitor and even forecast the space weather hazard events by our domestic spacecraft.
猜你喜欢
杂志排行

Chinese Physics B的其它文章
- Transient transition behaviors of fractional-order simplest chaotic circuit with bi-stable locally-active memristor and its ARM-based implementation
- Modeling and dynamics of double Hindmarsh–Rose neuron with memristor-based magnetic coupling and time delay∗
- Cascade discrete memristive maps for enhancing chaos∗
- A review on the design of ternary logic circuits∗
- Extended phase diagram of La1−xCaxMnO3 by interfacial engineering∗
- A double quantum dot defined by top gates in a single crystalline InSb nanosheet∗