Excellent thermoelectric performance predicted in Sb2Te with natural superlattice structure∗
2021-12-22PeiZhang张培TaoOuyang欧阳滔ChaoTang唐超ChaoyuHe何朝宇JinLi李金ChunxiaoZhang张春小andJianxinZhong钟建新
Pei Zhang(张培), Tao Ouyang(欧阳滔), Chao Tang(唐超), Chaoyu He(何朝宇),Jin Li(李金), Chunxiao Zhang(张春小), and Jianxin Zhong(钟建新)
Hunan Key Laboratory for Micro-Nano Energy Materials&Device and School of Physics and Optoelectronics,Xiangtan University,Xiangtan 411105,China
Keywords: thermoelectric,superlattice(SL),thermal conductivity,phonons
1. Introduction
Thermoelectric (TE) materials can be used in solid-state energy devices that convert waste heat into electricity or electrical power directly into cooling or heating.[1,2]They play an increasingly important role in meeting the present energy challenge due to ubiquitous heat source and pollution free production. Performance of thermoelectric devices is quantified by a dimensionless figure of merit,ZT=S2σT/(κe+κL),[3]which is only related to characteristics of the thermoelectric material and temperature. HereSdenotes the Seebeck coefficient,σis the electrical conductivity,Tis the absolute temperature,κeandκLare the thermal conductivities of electronic and lattice(phononic)contributions,respectively. It is obvious that to obtain a higherZTvalue requires a higher Seebeck coefficient,electrical conductivity and lower (electronic and phononic)thermal conductivity. However,coefficients of electronic parts(S,σandκe)always contradict with each other, and it is difficult to increase the numerator and to decrease denominator concurrently, for obtaining a highZT. Such behavior greatly limits the practical application of thermoelectric technology.Therefore, it has been being a hot spot in the field of thermoelectricity to seek potential materials with highZTor to improve the thermoelectric conversion efficiency of existing materials.
To date, several strategies have been adopted to enhance theZTvalues of TE materials, such as band structure engineering,[4]nanostructuring,[5]phonon-glass electroncrystal,[6]phonon-liquid electron-crystal model,[7]heterostructure formation[8]and quantum confinement effects.[9]In addition to these methods,designing superlattice(SL)structures is also used to improve efficiencies of thermoelectric energy conversion devices.[10]This is because the lattice thermal conductivity can be reduced while the good electron transport performance can be maintained in SL structures.[11,12]Capinski and colleagues[13,14]performed measurements with GaAs/AlAs SLs of various repeat distances. At room temperature,they found that the thermal conductivity of GaAs/AlAs SL is three times to an order of magnitude less than that of bulk GaAs,depending on the repeat distance. Leeet al.[15]studied a series of Si/Ge SLs and observed that the thermal conductivities of these samples are lower than those of SiGe alloys.After that, experiment of Venkatasubramanianet al.showed that theZTvalue of the p-type/n-type SLs consisting of bulk Bi2Te3and Sb2Te3could approach 2.4/1.5 at 300 K.[16,17]Chonget al.[18]noted that the lattice thermal conductivity of eight GeTe/Sb2Te3superlattice-like (SLL) layer cycles was less than 30% of that of single layer GeSbTe material. Recently,Tonget al.[19]have studied the thermal conductivity of chalcogenide material with an SLL structure,and they pointed out that the thermal conductivity of SLL is lower than those of conventional chalcogenide materials. Very recently, Longet al.[20]investigated the phonon properties of phase-change memory (PCM) with an SLL structure. They concluded that the low phonon group velocity and the thermal resistance at interfaces result in the low thermal conductivity of the GeTe/Sb2Te3SLL material. This helped researchers further to understand the physical mechanism of thermal properties in SL structures and to search high-performance TE materials.
Diantimony tellurium (Sb2Te) is one member in the(Sb2)n-(Sb2Te3)minfinitely adaptive series, whose crystal structure can be regarded as a natural SL in thec-axis direction.[21]This particular structure consists of two Sb2bilayers (BLs) interleaved with single quintuple layers (QLs)of Sb2Te3.[21,22]In recent years, it was considered as a potential candidate in phase-change memory (PCM) and has been extensively investigated due to the fast crystallization speed of Sb2Te.[23–26]Previous research mainly concentrated on enhancing the thermal stability of PCM by doping in Sb2Te.[27,28]However,the study on TE transport for Sb2Te is still quite scarce until now.Considering the natural advantages of the previously mentioned SL structures,it is interesting and necessary to investigate the thermoelectric transport properties of Sb2Te, which would be of great significance to explore its potential applications.
In this work, we systematically study the TE transport performance of Sb2Te using first-principles calculations and Boltzmann transport theory. The calculation results show that the maximum value ofZTof Sb2Te is as high as 1.46 and 1.38 along the in-plane and out-of-plane directions for n-type doping at 300 K,indicating that such a natural SL material could be a promising material for room temperature TE applications.The rest of this paper is organized as follows. In Section 2,we provide a brief description of the calculation method employed in this work. In Section 3, the results and discussion of electronic, phononic and thermoelectric transport properties are present. Finally,the conclusions of this work are given in Section 4.
2. Method
In this work, the projector augmented wave (PAW)method based on density functional theory (DFT) as implemented in the Viennaab initiosimulation package (VASP)was utilized for all the first-principles calculations.[29–31]We used the generalized gradient approximation (GGA) in the Perdew–Burke–Ernzerhof(PBE)as the exchange–correlation functional[32]and van der Waals(vdW)interactions were considered at the vdW-density functional (vdW-DF) level with optB86b-vdW as the exchange functional.[33]The cutoff energy of the plane wave was set as 600 eV and a 16×16×3 Monkhorst–Packk-mesh was employed to sample the Brillouin zone (BZ). The atomic forces were calculated by minimizing the total forces until the energy convergence was less than 10−6eV, while the atomic positions were fully relaxed with Hellman–Feynman force 0.001 eV/A.In order to obtain accurate electronic energy band structure, we adopted Heyd–Scuseria–Ernzerhof (HSE06) screened hybrid functional to calculate the electronic band structure of Sb2Te.[34,35]Once we obtained the band structure,using the semi-classical Boltzmann transport theory and the rigid band model as implemented in BoltzTrap code,[36]the electronic transport properties could be calculated. Here, we utilized the deformation potential (DP) theory, which is a common method in previous work,[37–41]to evaluate the electronic relaxation time(τ).Within the relaxation time approximation,the Seebeck coefficient and electrical conductivity can be written as[36,42]

whereE(k)is the band energy andν=∇kE/¯his the group velocity of carriers that can be directly derived from band structures,where ¯his the reduced Planck constant.
The phonon transport properties of Sb2Te were obtained by solving the phonon Boltzmann transport equation(PBTE), as implemented in the ShengBTE code with harmonic second-order interatomic force constants(2ndIFCs)and anharmonic third-order IFCs(3rdIFCs)as inputs.[43]The 2ndIFCs and phonon dispersion spectrum were calculated using the Phonopy package,[44]and a 3×3×1 supercell with a 3×3×2k-mesh was adopted. The 3rd IFCs, reflecting the properties for the phonon–phonon scattering,were calculated using the same supercell with cutoff of interaction ranging up to sixth nearest neighbors by using Thirdorder.py script.[45]After testing the convergence of the lattice thermal conductivity with respect to theq-grid, a dense phononq-grid of 16×16×4 was adopted for Sb2Te.
3. Results and discussion
Sb2Te is stacked by Sb2Te3and Sb2in the ratio of 1:2 and the layer stacking sequence is–[(Te–Sb–Te–Sb–Te)–(Sb–Sb)–(Sb–Sb)]–.[21,22]As illustrated in Fig.1(a),Sb2Te(space groupP¯3m1,No.164)is a hexagonal lattice structure and has 9 atoms in the unit cell. For convenience the hexagonal unit cell with lattice parametersaandcis often used. The lattice constants of Sb2Te area(b)=4.366 ˚A andc=17.830 ˚A,which are close approximation to previous results(a=4.272 ˚A andc=17.633 ˚A).[21,22]As mentioned in the introduction,Sb2Te can be regarded as a natural SL structure. The electronic band structure and the corresponding density of states (DOS) of Sb2Te are shown in Figs. 1(b) and 1(c). A local enlargement of the conduction band minimum(CBM)and the valence band maximum(VBM)is also drawn in the illustration in Fig.1(b).It can be seen that Sb2Te is a tinny band gap(0.013 eV)semiconductor,which is consistent with the previous work.[21]One can notice that the DOS exhibits abrupt slope near the bottom of conduction bands (CBs). Such a large slope will significantly enhance Seebeck coefficient and electrical conductivity. Meanwhile,multiple conduction band valleys and valence band peaks can be found near the Fermi energy level, which is quite advantageous for the enhancement ofZTand will be discussed in the following.
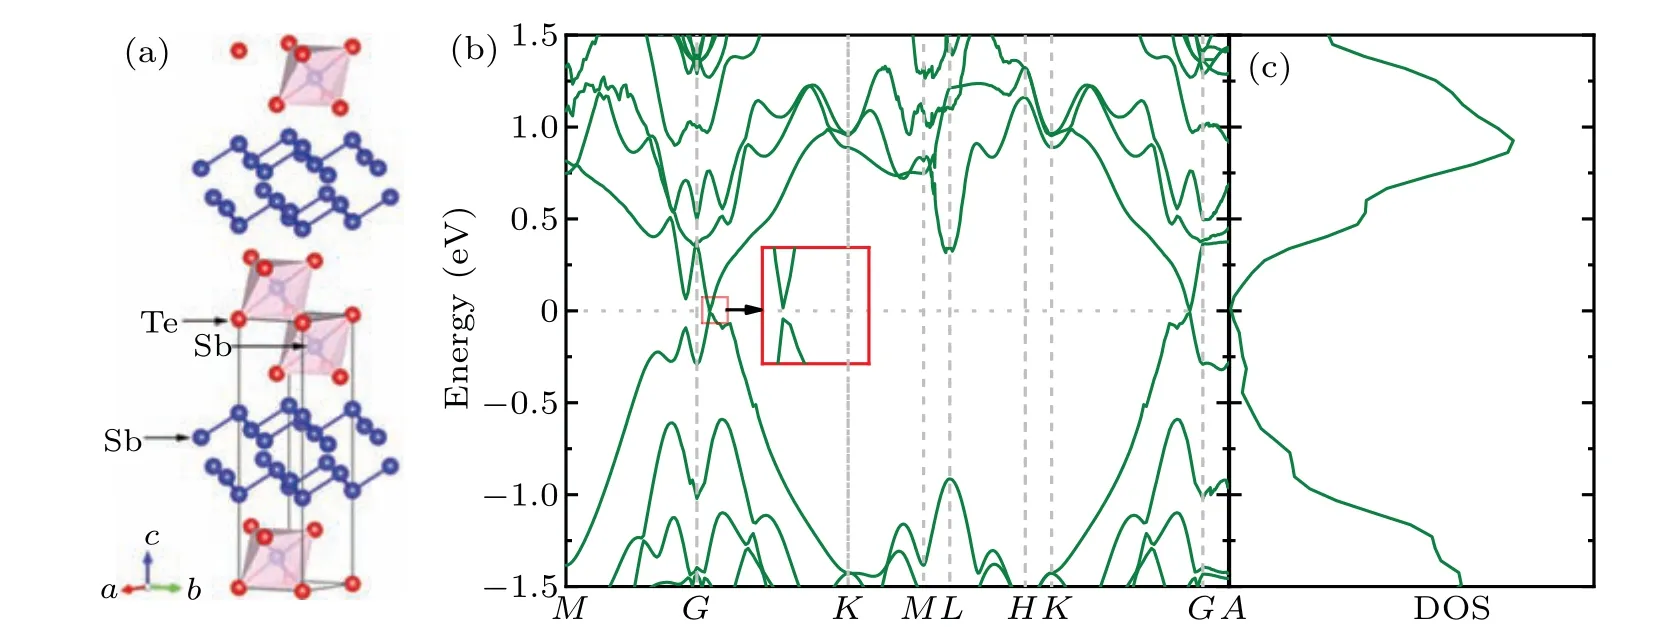
Fig.1. (a)The crystal structure of Sb2Te,where Sb and Te atoms are plotted as blue and red spheres,respectively. (b)Electronic band structure and(c)electronic density of states(DOS)of Sb2Te. The coordinates of the high-symmetry points in the Brillouin zone are M(0,0.5,0),Γ (0,0,0),K (−0.333,0.667,0),L(0.0,0.5,0.5),H (−0.333,0.667,0.5),K (−0.333,0.667,0),A(0,0,0.5).
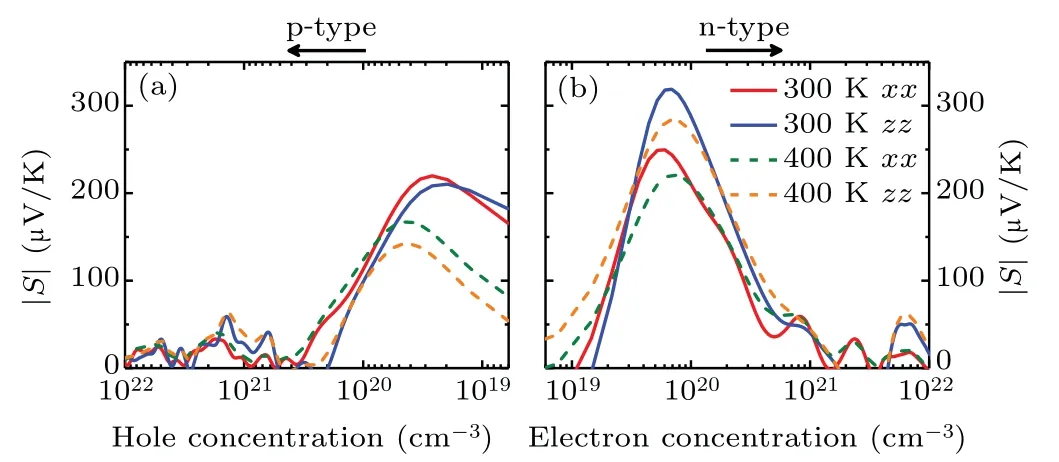
Fig.2. Seebeck coefficients(absolute value|S|)of Sb2Te as a function of carrier concentration[(a)holes and(b)electrons]along the in-plane(xx)and out-of-plane(zz)directions at 300 and 400 K.
Based on the band structure, the electron transport properties are studied by solving semi-classic Boltzmann transport equation. The rigid band approximation is adopted to simulate the doping effects.[36]The hole and electron concentrations correspond to p- and n-type, respectively. Figures 2(a) and 2(b)show the Seebeck coefficients(S)as a function of carrier concentration at different temperatures along the in-plane(xx)and out-of-plane(zz)directions,respectively.Here,we mainly focus on transport properties around room temperature, thus we only show the relative coefficients at 300 K and 400 K for comparison. According to the Mahan–Sofo theory,Sfor 3D materials can be written as

wherekB,h,n, andm∗are the Boltzmann constant, Planck constant,carrier concentration and DOS effective mass around the Fermi energy,respectively. Therefore,there is a competition relation between carrier concentration and effective mass.For low carrier concentration,the Seebeck coefficients(absolute value|S|) of Sb2Te are affected by the bipolar effect in narrow band gap semiconductors and increase withn; while for higher carrier concentration, the calculatedSof Sb2Te is inversely proportional to then, which is in good agreement with the Mahan-Sofo theory. Interestingly, with the increase of temperature,the peak value ofSdecreases and moves to the region of higher carrier concentration. Such a phenomenon is mainly related to the excitation of a large number of electrons at higher temperature. Meanwhile,it is also found that|S|for n-type doping is higher than that of the p-type doping,which is caused by steeper DOS around the bottom of CBs. At room temperature,the maximum|S|in p-type doping(at 2.64×10¹⁹and 1.96×1019cm−3hole concentration) can reach 219.85 and 210.38 µV/K along the in-plane and out-of-plane directions, respectively. As for n-type doping (at 6.04×10¹⁹and 6.91×1019cm−3electron concentrations), the largest Seebeck coefficients are 249.59 and 318.87 µV/K along the inplane and out-of-plane directions,respectively. Obviously,the Seebeck coefficients of Sb2Te are much larger than those of Sb2Te3(87 and 72 µV/K along the in-plane direction for pand n-type doping.[46]) at the same temperature. Such large Seebeck coefficients of Sb2Te are induced by the multi-valleys converging effect,[47]which is beneficial for its thermoelectric applications.
Seebeck coefficient is independent of the electron relaxation time(τ),whileσis closely dependent onτof electrons.The precise treatment ofτdepends on the process of detailed scattering mechanism, which is usually very complex. Since the wavelength of thermally activated carriers (electrons or holes)at room temperature is much larger than the lattice constant and is comparable to the wavelength of acoustic phonons,it is widely believed that the scattering of carriers at low energy is dominated by the electron-acoustic phonon coupling,which can be effectively evaluated by the DP theory.[37–41]Using this method,the calculated electron relaxation time of many materials is in good agreement with the experimental data,indicating its accuracy.[48–50]Based on effective mass approximation,the carrier mobilityµfor 3D materials can be written in the following form:[38]
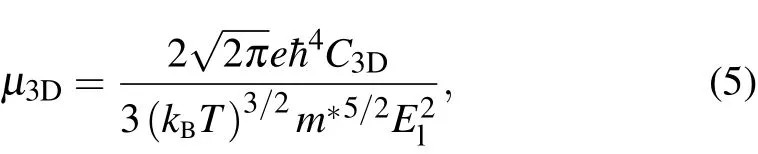
withC3D=(∂2E/∂δ2)/V0bing the 3D elastic constant. Here,Eis the total energy,δis the applied strain along the transport direction, andV0is the cell volume at equilibrium.El=∂Eedge/∂δis the DP constant,withEedgebeing the energy of the band edges (VBM for the holes and CBM for the electrons).M∗= ¯h2[∂2E(k)/∂k2]−1is the effective mass along transport direction,withkbeing the wave-vector magnitude in momentum space. These three quantities can be easily obtained from first-principles calculations. Figure 3(a) shows the relationship between the energy change(∆E=Eδ −E1.0,
whereEδis the total energy under strain andE1.0is the original total energy)and lattice dilation along the in-plane and outof-plane directions,andC3Dis obtained by fitting the energy–strain curve. Figures 3(b) and 3(c) describe the shift of both band edges of VBM and CBM as a function of uniaxial strain,
whereE1is calculated from the slope of the fitting lines.Based on the obtainedC3D,El, andm∗, the carrier mobility and the relaxation time(τ=µm∗/e)are calculated as listed in Table 1.Carrier mobility and electron relaxation time show obvious anisotropy due to the anisotropic SL structure of Sb2Te,which has a significant influence on its electronic properties.
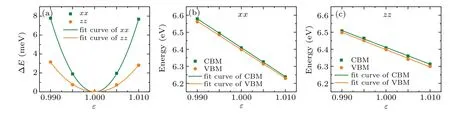
Fig.3. (a)The relationship between energy change ∆E and lattice dilation along the in-plane(xx)and out-of-plane(zz)directions. (b)and(c)Band energy shifts of VBM and CBM under uniaxial strain along the lattice dilation direction.
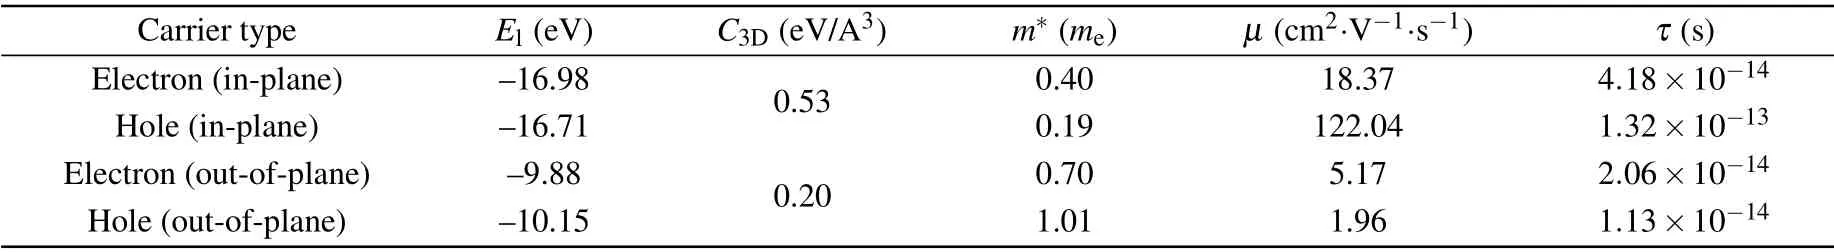
Table 1. Deformation potential constants El,3D elastic modulus C3D,effective masses m∗,and carrier mobilityµ based on Eq.(2)for in-plane and out-of-plane directions at 300 K.
Figures 4(a) and 4(b) present the electrical conductivityσof Sb2Te as a function of carrier concentration along the in-plane and out-of-plane directions at 300 and 400 K,respectively. It can be seen thatσmonotonously increases with the increasingnin both p- and n-type Sb2Te. According to the formulaσ=neµ,we can realize thatσis proportional to carrier concentration which is contrary to the situation ofSas discussed above. Differences ofσalong the in-plane and outof-plane directions can be understood from the carrier mobility as listed in Table 1. With the same carrier concentration,a larger carrier mobility along the in-plane direction results inσalong the in-plane direction being much larger than that along the out-of-plane direction. It is clearly shown that the electrical conductivities of Sb2Te at 300 and 400 K are comparable whenn<1020cm−3. However,σat 300 K increases faster than that at 400 K whenn> 1020cm−3. This phenomenon can be mainly attributed to the increased electronphonon scattering with the increasing temperature. In addition, the electrical conductivity of n-type Sb2Te is larger than that of p-type one, which is similar to the case ofSand is also related to the DOS. The electronic thermal conductivityκewas estimated by means of Wiedemann–Franz law ofκe=LσT, whereLis the Lorentz number.[51]As the same as the value in the previous work,[52–54]here we adoptL=π2κ2B/3e2= 2.44×10⁻⁸V2·K−2. One can note from Figs.4(c)and 4(d)that theκeandσexhibit analogous curves.Moreover, the electronic thermal conductivity of Sb2Te is insensitive to the variation of the temperature. At low carrier concentration (n<1020cm−3),κeis very small and almost negligible. However,κeincreases with increasingnand negatively affects theZTof Sb2Te at high carrier concentration.
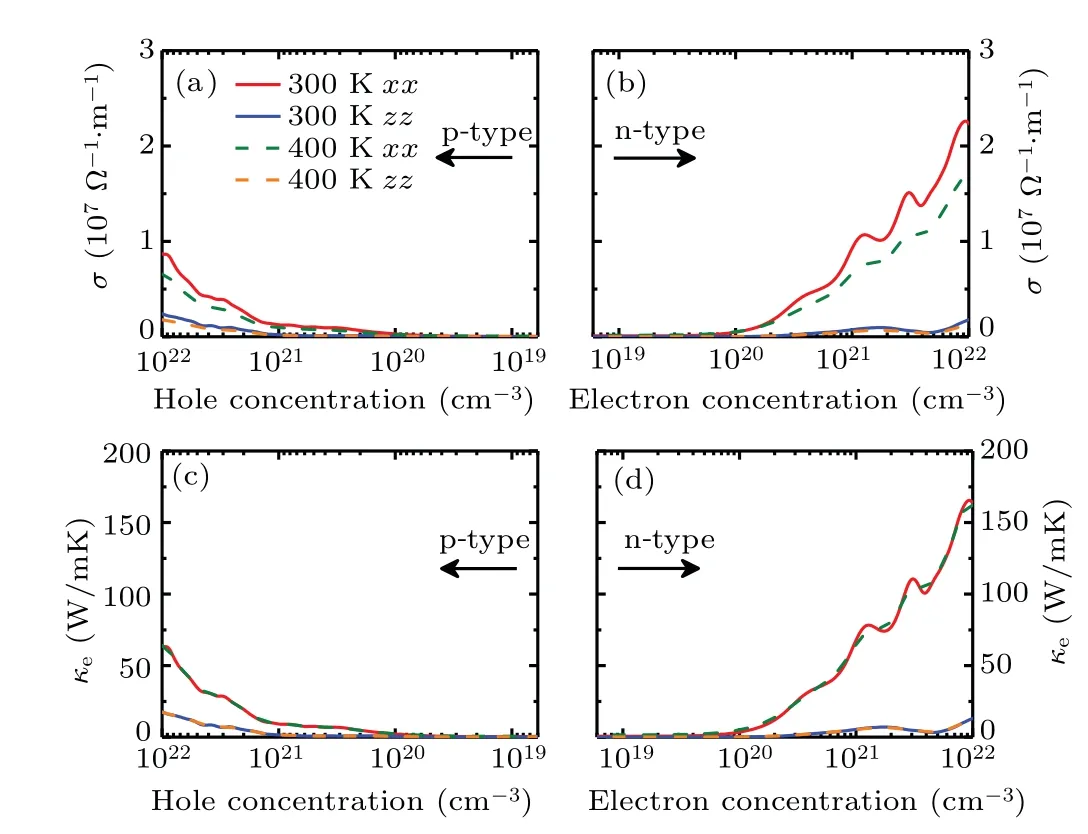
Fig.4. [(a),(b)]Electrical conductivity σ and[(c),(d)]electronic thermal conductivity κe of Sb2Te versus carrier concentration along the inplane(xx)and out-of-plane(zz)directions at 300 and 400 K.
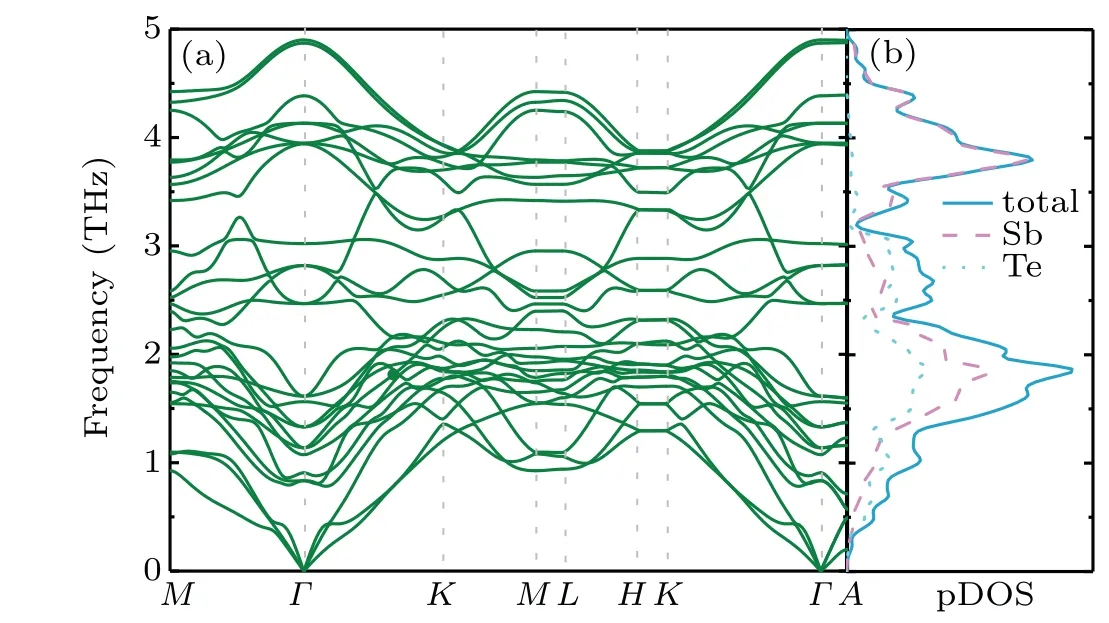
Fig. 5. (a) Calculated phonon dispersion along the high-symmetry paths and (b) the total and partial phonon densities of states (pDOS)for Sb2Te.
As phonons also play an important role in TE transport,the thermal transport properties of Sb2Te are explored as well.Figures 5(a)and 5(b)show the phonon dispersion curves, total and partial phonon density of states(pDOS)of Sb2Te. No negative phonon frequency was observed in Fig.5(a),indicating the dynamic stability of Sb2Te. There exist three acoustic and twenty-four optical phonon branches corresponding to the nine atoms in the primitive cell of Sb2Te. The large masses of Sb and Te atoms induce the phonon dispersion over a smaller frequency scale,and the maximum phonon frequency of Sb2Te is 4.9 THz. Obviously,there is no phonon band gap between and within the acoustic and optical branches, which means that there is the strong coupling of the acoustic and optical phonon modes. This phenomenon is due to the small difference in atomic masses of the constituent atoms in Sb2Te,which will lead to the low lattice thermal conductivity. The pDOS contained in Fig.5(b)illustrates the significant contributions of Sb and Te atoms over the whole frequency range.It is found that the vibrations of Te atomic are mainly on the low frequency (lower than 3.1 THZ) phonon branches while the vibrations of Sb atoms dominate on all the phonon modes.
The lattice thermal conductivity(κL)as a function of temperature andq-grid are shown in Fig. 6(a). As plotted in the inset,the phonon thermal conductivity of Sb2Te achieves good convergence with the increasedq-grid. It can be clearly seen thatκLdecreases with increasing temperature,which is a common behavior of 3D materials at medium temperatures.[55–57]In addition,it is worth noting thatκLalong the out-of-plane direction is far smaller than that along the in-plane direction. At room temperature,the lattice thermal conductivities are calculated to be 1.25 and 0.21 W/mK along the in-plane and out-ofplane directions,respectively. Figures 6(b)and 6(c)show the phonon dispersion curves and group velocities of Sb2Te alongΓ–MandΓ–Adirection,respectively. TheΓ–MandΓ–Adirections in the Brillouin zone is equivalent to the in-plane and out-of-plane directions, respectively. One can note that the group velocity of Sb2Te along the out-of-plane direction is far smaller than that along the in-plane direction,which is one of the reasons for the lowerκLalong the out-of-plane direction than along the in-plane direction. The flatter curve of Sb2Te along the out-of-plane direction than along the in-plane direction is responsible for this result,because the group velocity is calculated according toν(q)=∂ω(q)/∂q,whereω(q)andqare the phonon frequency and wave vector, respectively. The averagedκLcan be calculated byκL=(κxx+κyy+κzz)/3.Our result for Sb2Te at 300 K is listed in Table 2, together with available data of Sb2Te3for comparison.[58–61]Interestingly,the averagedκLof Sb2Te is 0.9 W/mK,which is much lower than that reported for bulk Sb2Te3,e.g., 4.1 W/mK.[59]As mentioned earlier,Sb2Te can be regarded as a natural SL in thec-axis direction,thus we take out-of-plane direction as an example to further understand the ultralowκLof Sb2Te. The phonon dispersion curves and group velocities of Sb2Te3is also depicted in Figs. 6(b) and 6(c) for comparison. Obviously,group velocities of Sb2Te are lower than that of Sb2Te3along the same direction. The significantly low group velocity could come from the increasing probability of the interface scattering in the SL structure, which acts as the obstacles for the transport of phonons.[62,63]Meanwhile, the flattening of the dispersion curves associated with Brillouin-zone folding also has an effect on the low group velocity.[64]The phonon relaxation time is another vital parameter to determine lattice thermal conductivity. As shown in the inset of Fig. 6(c), the phonon relaxation time for Sb2Te is between 0.1 and 100 ps.Such low phonon relaxation time implies that there is strong anharmonic phonon scattering. The Gr¨uneisen parameter (γ)can be used to analyze the anharmonic properties of material,which can be calculated by
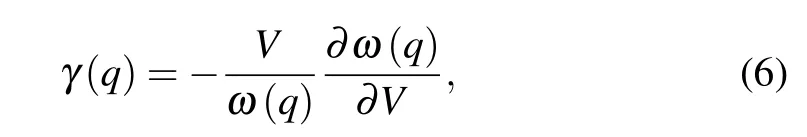
whereVis the volume. Figure 6(d)shows the Gr¨uneisen parameters of Sb2Te and Sb2Te3versus frequency. It is obviously seen that Sb2Te possesses larger Gr¨uneisen parameter(absolute value)than Sb2Te3. The mean values of Gr¨uneisen parameters are 2.36 and 1.38 for Sb2Te and Sb2Te3along the out-of-plane direction (1.77 for Sb2Te along in-plane direction), respectively. The above analysis shows that the lowκLalong out-of-plane direction of Sb2Te is mainly caused by the lower group velocity and the stronger anharmonicity.
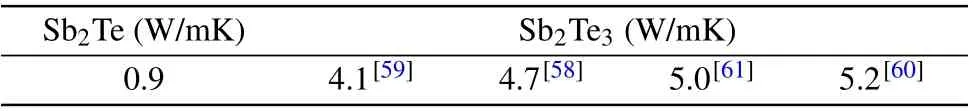
Table 2. Averaged lattice thermal conductivity of Sb2Te and Sb2Te3.
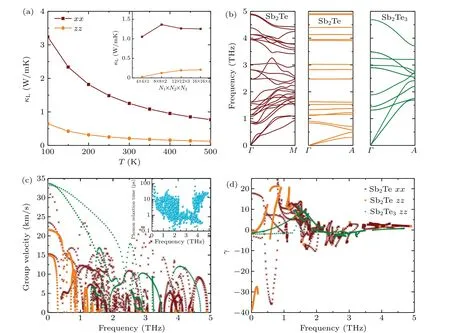
Fig. 6. (a) Lattice thermal conductivity (κL) of Sb2Te along different directions as a function of temperature and q-grid (inset); (b) phonon dispersion curves of Sb2Te and Sb2Te3 along the in-plane (Γ–M) and out-of-plane (Γ–A) directions; (c) phonon group velocity and (d)Gr¨uneisen parameter of Sb2Te and Sb2Te3 as a function of frequency along the in-plane(xx)and out-of-plane(zz)directions. The inset of in(c)is the phonon relaxation times of Sb2Te.
To reveal the anharmonicity of Sb2Te more clearly, we perform further analysis on the reduced atomic potential energy of Sb2Te and Sb2Te3with respect to displacement ratio, and the results are shown in Fig. 7(a). In the unit cell of each system,only one atom is moved away from the equilibrium position (along the out-of-plane direction), while the other atoms remain unchanged. We use a cubic function to fitting the reduced atomic potential energy.The absolute value of fitted cubic term of Sb2Te(73.95)is larger than that of Sb2Te3(9.11), which is similar to the Gr¨uneisen parameters and also reveals the strong phonon anharmonicity in Sb2Te. As is wellknown, the electron localization function (ELF) uses the local influence information of Pauli repulsion to measure the localization degree of electrons in a solid, thus an image of lone-pair electrons can be directly given.[65]To further analyze the anharmonicity in Sb2Te,the ELF is given in Fig.7(b).It is found that there is electronic localization near the red spherical-like region around the Sb atom in Sb2bilayers of Sb2Te, which is caused by the lone-pair electrons of the Sb atom. In the Sb2bilayer, one Sb atom and three Sb atoms form a triangular pyramid. The outermost electron configuration of Sb is 5s25p3,in which three electrons form three groups of Sb–Sb covalent bonds with electrons of other surrounding Sb atoms and the other group of electrons become the lonepair in this arrangement. In general, for materials containing lone-pair electrons,non-bonded electrons will interact with the valence electrons of the adjacent neighboring atoms, causing increased anharmonicity at limited temperature.[39]Therefore,it can be concluded that the stronger phonon anharmonicity in Sb2Te is mainly due to the presence of lone-pair electrons.

Fig.7. (a)Potential energy change with respect to displacement of the atom from the equilibrium position. Displacement ratio ∆Z is defined as ∆Z=1.0+(Z −Z0)/Z0,where Z and Z0 represent the coordinates of shift and equilibrium positions, respectively. (b) Electron localization function (ELF) of Sb2Te along the [100] direction within a 1×2×1 supercell.
Based on the above results of electronic and phononic transport properties,one can evaluate the figure of merit,i.e.,ZT. The calculatedZTvalues of Sb2Te for both p- and ntypes are shown in Fig.8. TheZTof the n-type is larger than that of the p-type, which mainly stems from the anisotropic Seebeck coefficient and electric conductivity. The anisotropy that varies with the carrier concentration mainly depends on the complex competitive relationship between the transport coefficients. For example, at 400 K, the maximumZTof ntype along the out-of-plane direction is larger than that along the in-plane direction. However, at 300 K, the peak value ofZTof n-type along the out-of-plane direction is smaller than that along the in-plane direction. It can be found that from Figs. 9(a) and 9(b) that both the power factor and total thermal conductivity along in-plane direction are larger than those along out-of-plane direction. According to the definition ofZT,the former is directly proportional toZTand the latter is inversely proportional toZT. The influence of anisotropy of power factor is mainly greater than that of thermal conductivity at 300 K.When the temperature is greater than 300K,the situation is just the opposite. As can be seen from Fig. 9(c),with the increase of temperature,ZTalong the out-of-plane direction will always be greater than that in the in-plane direction. Because of the high Seebeck coefficient and relatively lowκL, it is unsurprising to observe a quite promising value ofZT. At 300 K, the peak values of theZTcurves along the in-plane (out-of-plane) direction is about 0.60 (0.68) at a hole concentration of 4.72×10¹⁹(3.32×10¹⁹)cm−3. Meanwhile, when the electron concentrations are 6.90×10¹⁹and 1.19×1020cm−3, respectively, maximalZTvalues of 1.46 and 1.38 can be achieved in the in-plane and out-of-plane directions. Even the electron relaxation time is reduced by half,as plotted in Fig. S1 in the supplementary material, the thermoelectric figure of meritZTof monolayer Sb2Te could still approach 0.39(with p-type doping)and 1.08(with n-type doping) along in-plane direction. These values are much larger than those of Sb2Te3(0.13 along the in-plane direction and 0.23 along the out-of-plane direction)and even comparable to those of Bi2Te3.[46]Overall,our results indicate that Sb2Te is a promising candidate for room-temperature TE materials.
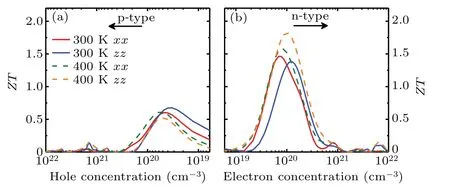
Fig.8. Calculated figure of merit(ZT)of Sb2Te as a function of carrier concentration [(a) holes and (b) electrons] along the in-plane (xx) and out-of-plane directions(zz)at 300 and 400 K.
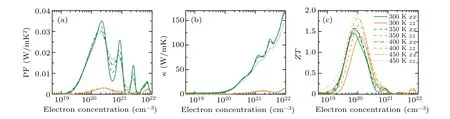
Fig.9. (a)Power factor(S2σ),(b)thermal conductivity(κ =κe+κL)and(c)ZT as a function of electron concentration along the in-plane(xx)and out-of-plane directions(zz)at different temperatures.
4. Conclusion
In summary, we have theoretically explored the electronic and phonon transport properties of Sb2Te based on the first-principle calculations and Boltzmann transport theory. The results show that Sb2Te possesses high Seebeck coefficients and low lattice thermal conductivity at room temperature. Since steeper DOS around CB, large Seebeck coefficients can approach 249.59 and 318.87 µV/K along the in-plane and out-of-plane directions for n-type Sb2Te,respectively. Additionally, the unique SL structure, small phonon group velocity and strong anharmonicity of Sb2Te lead to an ultralow lattice thermal conductivity of 1.25 (0.21) W/mK along the in-plane (out-of-plane) direction at 300 K. Further analysis shows that the small group velocity caused by the flatter phonon spectrum is mainly due to the increase in interface scattering. The presence of lone pairs of electrons causes the strong anharmonicity. TheZTvalues of n-type Sb2Te are as high as 1.46 and 1.38 at 300 K along the in-plane (at 6.90×1019cm−3electronic concentrations)and out-of-plane direction(at 1.19×1020cm−3electronic concentrations). Our work reveals the thermoelectric intrinsic mechanism of Sb2Te,which will highlight the theoretical guidance for researchers who are interested in exploring new high-performance room temperature TE materials.
猜你喜欢
杂志排行

Chinese Physics B的其它文章
- Transient transition behaviors of fractional-order simplest chaotic circuit with bi-stable locally-active memristor and its ARM-based implementation
- Modeling and dynamics of double Hindmarsh–Rose neuron with memristor-based magnetic coupling and time delay∗
- Cascade discrete memristive maps for enhancing chaos∗
- A review on the design of ternary logic circuits∗
- Extended phase diagram of La1−xCaxMnO3 by interfacial engineering∗
- A double quantum dot defined by top gates in a single crystalline InSb nanosheet∗