Regulation of the density distribution of a strongly dissipative plasma by a pulsed magnetic field
2021-11-30WenbinLING凌文斌ChenggangJIN金成刚JianGUAN关键YuyeZHANG张钰业andPeng鄂鹏
Wenbin LING (凌文斌), Chenggang JIN (金成刚), Jian GUAN (关键),Yuye ZHANG (张钰业) and Peng E (鄂鹏)
1 School of Electrical Engineering and Automation, Harbin Institute of Technology, Harbin 150001,People’s Republic of China
2 Laboratory for Space Environment and Physical Sciences, Harbin Institute of Technology, Harbin 150001, People’s Republic of China
Abstract A pulsed transverse magnetic field with pulse width of 12 ms and magnitude of 2 T was used to modify the density distribution of a weakly-ionized plasma flow with strong collisions between the charged particles and neutrals.The morphology of the plasma is changed substantially,with the density increased upstream and decreased downstream.Meanwhile, the plasma toward the axis contracts laterally and gradually converges to a collimated flow.In addition,a drift wave is observed to be excited in the inhomogeneous plasma by the magnetic field.
Keywords: pulsed magnetic field, weakly-ionized plasma, plasma dynamics, drift instability
1.Introduction
Controlling the plasma with a magnetic field is of great importance to both theoretical and applied research.The dynamics of the plasma evolution [1–17], the equilibrium shaped by the magnetic field, the plasma transport [18–21],and instability [3, 16, 22–25] in the magnetic field are at the core of the theoretical interests.As for application-orientated studies,the magnetic field is usually used as a tool to modify the morphology of the plasma, regulate its parameters, and govern its motion[5,7,15,26].Here,the magnetic field aims to alleviate the communication blackout occurring for a spacecraft reentering the atmosphere.The principle is that the density distribution of the plasma sheath around the spacecraft can be changed by the magnetic field, to form a lowdensity region, through which the electromagnetic wave can be transmitted.To make the magnetic field act effectively on the blackout plasma that is in the weakly-ionized state with strong dissipation,its magnitude should be large.This implies that a pulsed magnetic field is more energy-efficient than a static one.Thus, it is necessary to study the interaction between the pulsed magnetic field and the weakly ionized plasma for mitigating the communication blackout.In addition, since there exist many weakly ionized plasmas in the low-temperature plasma field and astrophysics, the study is also valuable for modifying the low-temperature plasma properties with a magnetic field and understanding the astrophysical plasmas in different environments [27], such as solar spicules and prominences, molecular clouds, protostellar discs, etc.
So far,however,current research mainly concentrates on the interaction between the quasi-steady magnetic field and the strongly ionized plasma, and there are few investigations into the influence of the pulsed magnetic field on the weaklyionized plasma.Meanwhile, the concerned time scale of the plasma dynamics in available studies is in the order of several hundred nanoseconds or several microseconds, and there is a lack of research on the physics with a longer time scale.
In this study,the dynamics of the weakly-ionized plasma and the change of its density distribution under the effect of an intensive pulsed magnetic field are explored through experiments done on a specialized platform.
2.Experimental setup
The schematic of the experimental setup employed is shown in figure 1.Since the communication blackout problem is mostly determined by the electromagnetic properties of the plasma layer around a hypersonic vehicle, it is reasonable to simulate the plasma in the laboratory using that of similar electromagnetic characteristics, without precisely recovering all the plasma features during blackout [28].The electromagnetic properties are determined by the specific plasma parameters, such as electron density, electron temperature,collision frequency, and sheath thickness, etc, which can be reproduced well by an arc plasma jet [29, 30].Thus, in our experiment,an arc argon plasma flow covering the surface of the blunt body of stainless steel is used to mimic the blackout plasma.The total discharging current I of the arc is set as 240 A and the mass flow rate Q is set as 4 slm.In the interaction region of the plasma and magnetic field, the plasma density neis in the order of 1 × 1013cm-3, and the electron temperature Teis about 1 eV.The background gas and ions have a temperature of Ti= Tn= 0.2 eV or so.The gas pressure P for the plasma is about 200 Pa.The ionization degree of the plasma is thus evaluated to be 3 × 10⁻⁴, and the velocity Vpof the plasma flow is around 1 km s-1.The electron–ion (νei), electron–neutral (νen), ion–ion (νii), and ion–neutral(νin)collision frequencies with the typical plasma parameters are 0.58 GHz, 2.7 GHz, 24 MHz, and 12 MHz.
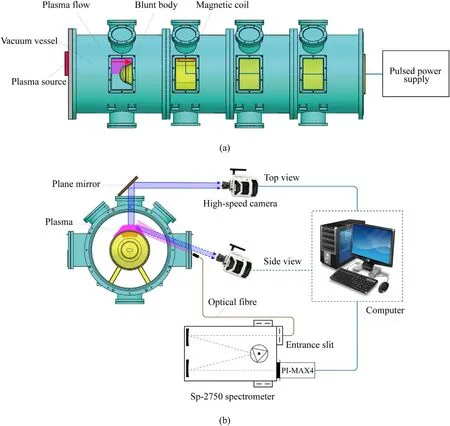
Figure 1.The schematic of the experimental setup.(a) Side view, (b) front view.
A pulsed magnetic field is produced by passing a pulsed current with rise time of 400 μs, pulsed top width of 11.5 ms,and fall time of 6.5 ms through a magnet of a track shape located under the surface of the blunt body.The power supply generating the current has a voltage at 2.5 kV level, and the electric field generated by the voltage is balanced by the induced electric field in the magnet, thus not influencing the plasma.This is verified by the fact that the pulsed current with the plasma action is the same as that of the power supply running alone.The field at the axial point of the magnet 1 cm distant from the bunt-body surface, as shown in figure 2, is proportional to the pulsed current, and the scaling factor is 1.21 × 10⁻⁴T A-1measured with a Gauss meter [31].The pulsed magnetic field has a sawtooth oscillation at its top.Figure 3 shows the spatial distribution of the magnetic field for the nominal current, and the field on the magnet’s axis varies from 3 T near the blunt-body surface to 2 T 1 cm away from it.In the figure, the X-axis represents the axial direction of the vacuum vessel,the Y-axis is in the transverse direction,and the Z-axis is in the vertical direction.For B of 1 T,the electron and ion cyclotron frequencies ωci, ωceare 28 GHz and 0.38 MHz respectively.Thus, the electrons are magnetized and the ions are unmagnetized due to strong collisions between ions and neutrals.
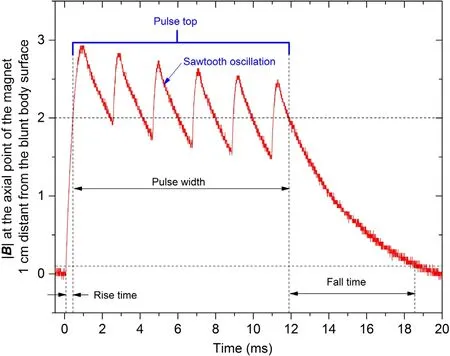
Figure 2.The pulsed magnetic field on the magnet axis 1 cm distant from the bunt body surface.
The initial plasma density without the magnetic field is induced from the Stark broadening of the Hβline that is generated by the hydrogen atom dissociated from the residual water in the vacuum vessel.The Sp-2750 spectrometer and PI-MAX4 ICCD(intensified charge-coupled device)are used to measure the spectral line, and the measurement location is shown in figure 1.A blazed grating of 2400 g mm-1is used to improve the spectral resolution, and the gate width of the ICCD is set as 2 ms.The mechanisms of the spectral line broadening include the natural, Doppler, pressure, and stark broadening.Since the Stark broadening is mainly determined by the plasma density, it can be used to induce the plasma density.The measured spectral line is a result of the convolution of all kinds of broadening components.The Stark broadening can be obtained using a deconvolution procedure or a fitting procedure.However, the method is only valid for the plasma density larger than 1 × 1013cm-3, making it difficult to grasp the local density reduction characteristic of our experiment.
Thus, a high-speed camera Phantom v12.2 is used to acquire time-resolved images of the plasma evolution for analyzing the dynamics of the plasma with the pulsed magnetic field.The light emitted from the interaction region is obtained with the camera from the top and side perspectives,which correspond to the direction parallel and perpendicular to the magnetic field respectively.The acquired image presents a line-integrated light intensity distribution in the plane perpendicular to the line of sight.In the experiment,the frame rate of the camera is set as 10 000 fps, and thus the time interval between two adjacent frames is 100 μs.In addition,since the light emission is positively correlated with the plasma density, its evolution is used to characterize the plasma density variation.The reasonability of the simplification is validated in section 3.1.
Gray processing is performed for the original plasma video to get the plasma evolution images.Meanwhile, the wave pattern in the video is revealed by the difference of the former and later frames.Assuming that the wave isf(x,t) =Asin (ωt+kx) ,then the difference between the adjacent frames equals

where Δt is the reciprocal of the frame rate.Thus, the wave structure in the video is the same as that in its frame-difference evolution images.
3.Results and discussion
3.1.The evolution and dynamics of the plasma
The total Gaussian component of the broadening width of the Hβline is about 0.0165 nm in the experiment, and its Lorentz component is mainly due to the Stark effect.After obtaining the Stark broadening width Δλsby a fitting procedure,the plasma density neis evaluated according to the formula Δλs= 2 ×10-11ne3/2[32].Figure 4 shows the plasma density versus the mass flow rate Q.The plasma density changes from 1.4 × 10¹³to 2.2 × 1013cm-3when Q increases from 3 to 6 slm.Whereas, it is noted that the measured plasma density is just a spatially averaged result because of the limited spatial resolution of the optical emission spectroscopy.
Before proceeding, it is pointed that in the following figures of plasma evolution, the definition of the coordinate system is the same as figure 3 except that the origin is changed to the magnet center.Figure 5(a) shows the plasma evolution in the plane perpendicular to the magnetic field,which can be divided into five periods.At first, the plasma flow is repelled by the magnetic pressure to generate a ring structure at 100 μs.Then,the plasma starts to diffuse into the magnetic field, forming a long slab structure along the direction of the flow.As the field rises,the slab expands in the transverse direction and moves toward the upstream with slight counter-clockwise rotation.When the field reaches the peak at 1000 μs,the plasma features a triangular shape in the plane perpendicular to the field.Thirdly, the plasma crosses over the field,converging to downstream during the pulse top of the magnetic field.Meanwhile,the plasma is collimated in the direction of the flow, which is clearer for lower initial plasma density not shown here.
The focusing and collimation phenomenon has been observed and studied thoroughly for the laser-produced plasmas when they penetrate a transverse magnetic field[3, 10, 13, 25, 33].Two mechanisms have been proposed to account for the phenomenon based on the self-polarized electric field [3] or the shock wave due to the magnetohydrodynamics [10, 25].The penetration and focusing of the weakly-ionized plasma here can be attributed to the E × B drift caused by the self-polarization, which is allowed by the rapid magnetic diffusion into the plasma.The field resistively diffuses into the plasma on ∼100 ns time scale, which is estimated by
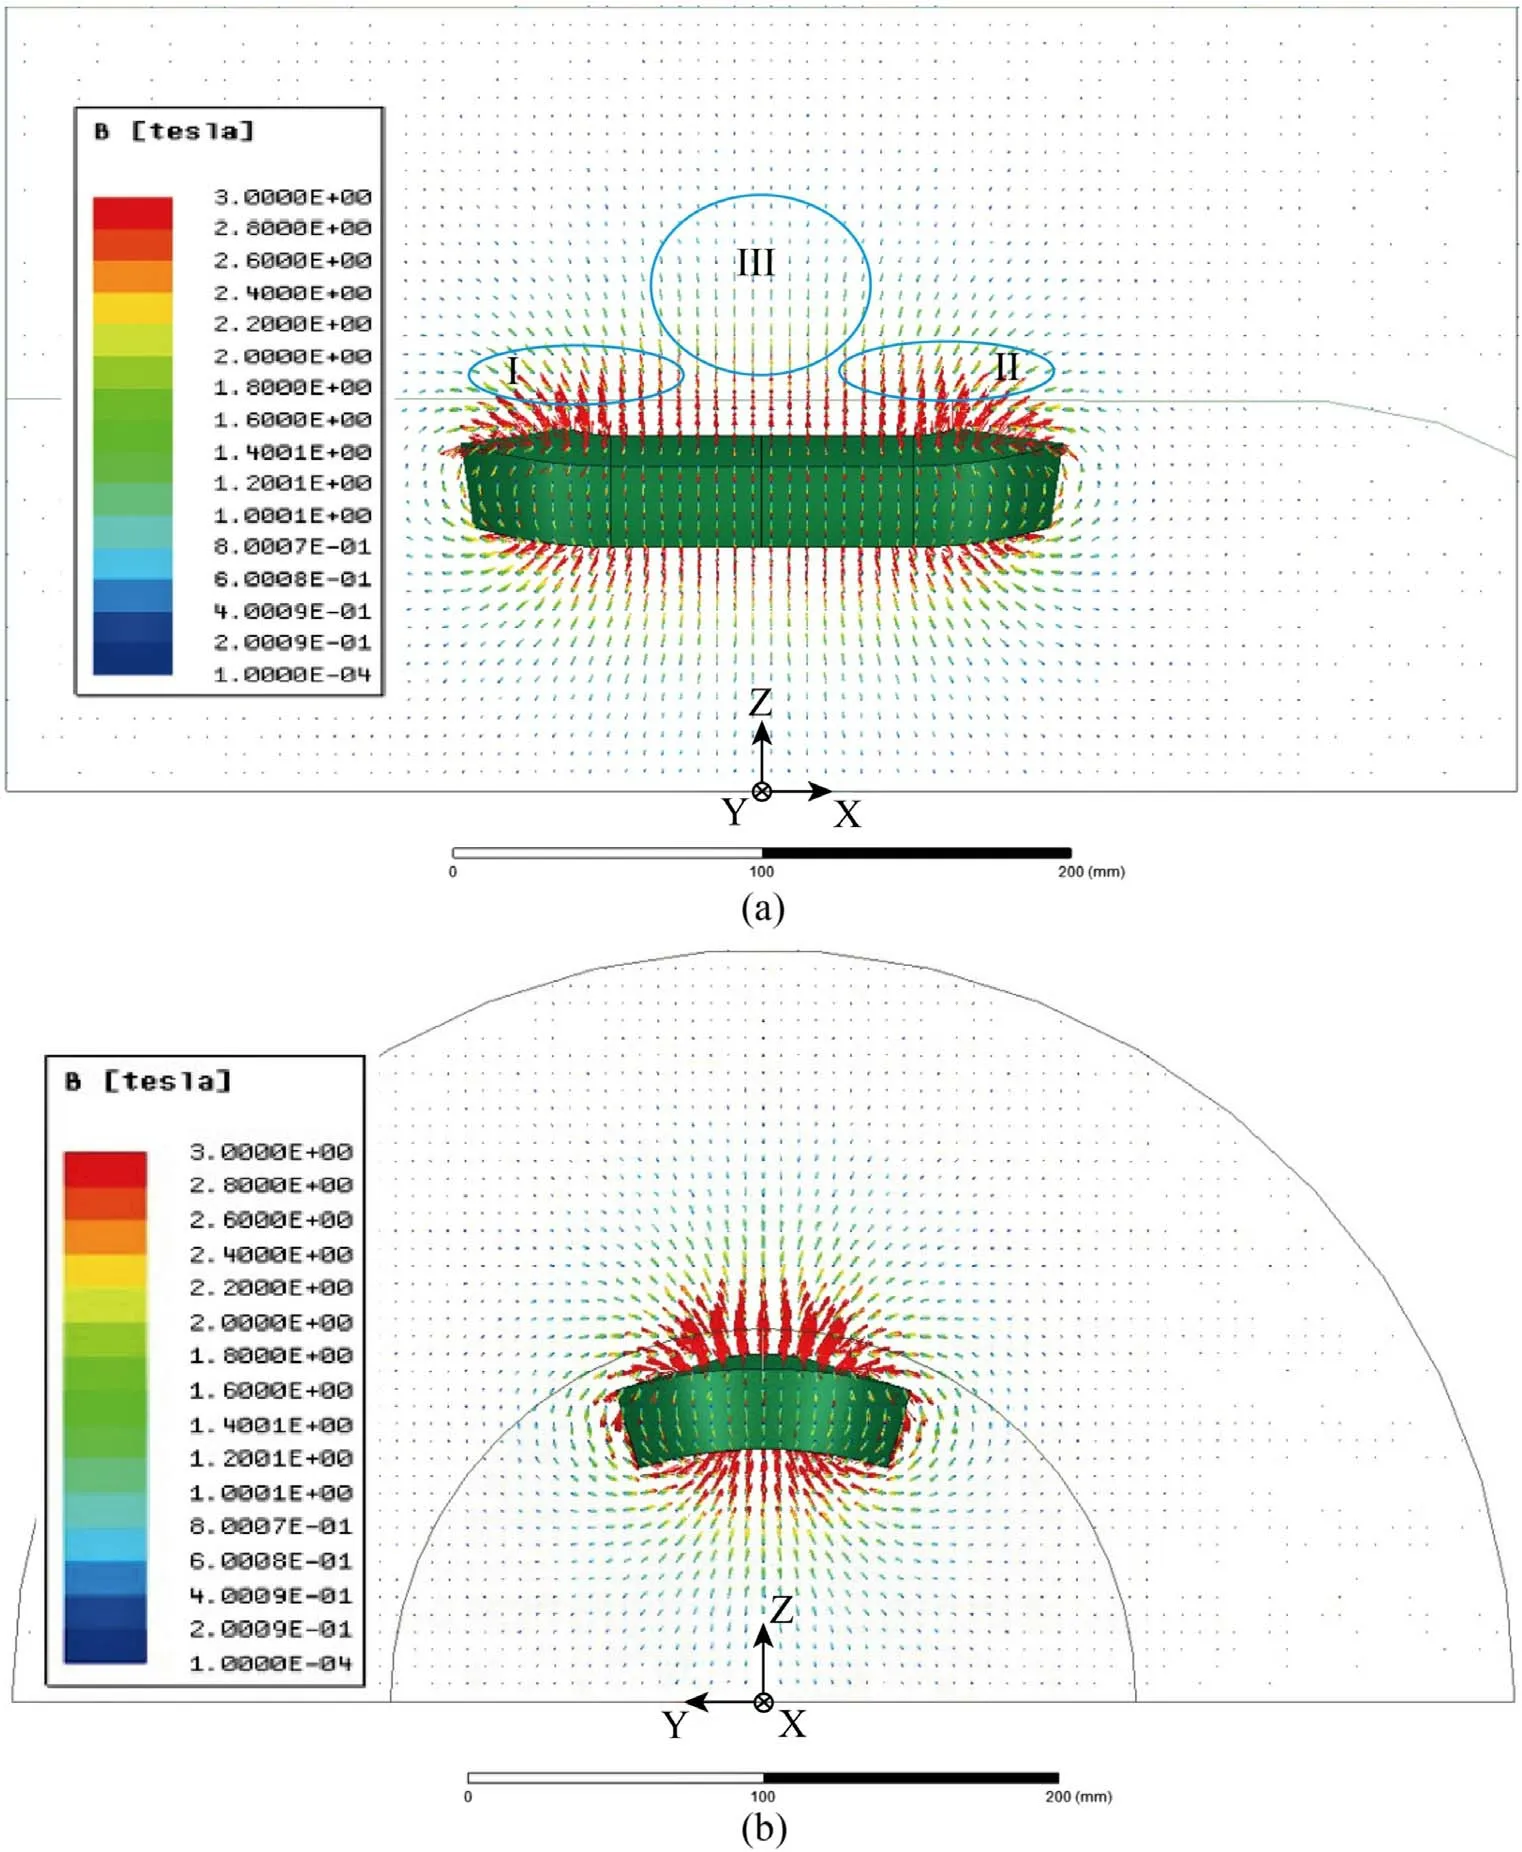
Figure 3.The magnetic field distribution of the magnet (a) in the XZ plane and (b) in the YZ plane.
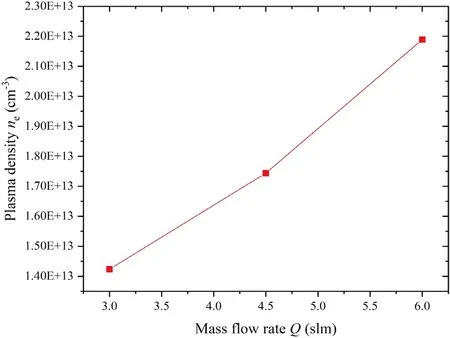
Figure 4.The plasma density ne versus the mass flow rate Q with the discharging current being 240 A.
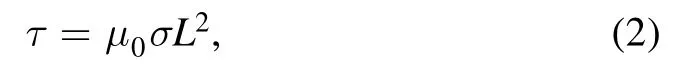
where,μ0is the permeability in vacuum,σ is the conductivity of the plasma, and L is the length scale set as 25 mm.σ is computed by
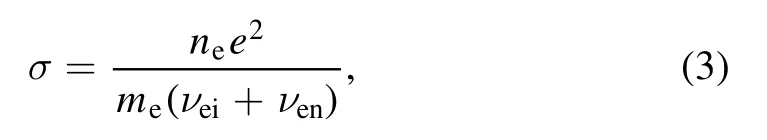
where, the electron–ion (νei) and electron–neutral (νen) collision frequencies are given by [34]
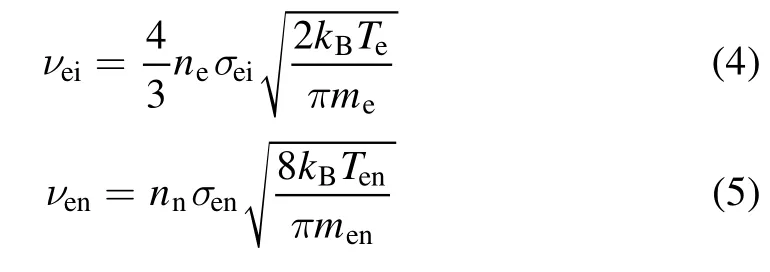
respectively.The electron–ion collisional cross-section σeiis equal to
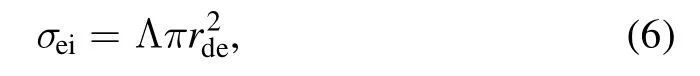
where,
Λ is the Coulomb logarithm and equals 10 here.The electron–neutral collisional cross-section is σen= 1 × 10-19m2.Additionally, Ten= (Te+ Tn)/2, men= memn/(me+ mn).Since only the electrons are magnetized in the weakly-ionized plasma, there should be charge separation at the front of the plasma jet, thus leading to the slight curvature of the jet [3],which is obvious in the figure 5(a).
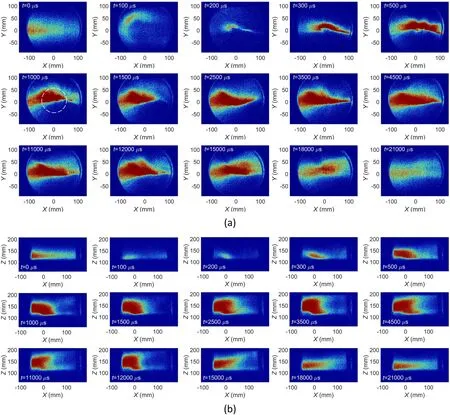
Figure 5.The plasma evolution in the plane (a) perpendicular to the magnetic field and (b) parallel to the magnetic field.
Until 3500 μs,an equilibrium structure is built,and then the plasma evolution goes into the fourth period.The structure is steady in this period, and fluctuates slightly with the field ripple.At last, with the field declining, the plasma gradually reverts to its initial state without the magnetic field.It should be noted that the plasma is asymmetrical about the axis of the flow, and more plasma is distributed on the left side along the forward direction.When the field leaves the pulse top, the transport of the plasma across the field is increased and ultimately the plasma reaches the undisturbed state.
The magnetic field action during the pulse top can be explained as follows.Figure 6 shows the main physical processes with the magnetic field increasing or decreasing during the pulse top.When the magnetic field increases, an induced electric field Eiis generated based on Faraday’s lawThen, the plasma will be compressed inwards under the effect of the electric field induced current and the magnetic field.Since only the electrons are magnetized, the ions move faster than the electrons, leading to charge separation generating a static electric field Es.Thus,the plasma rotates anticlockwise due to the E × B drift caused by Esand the magnetic field.In addition, there is an inward plasma density gradient, which makes a drift wave moving clockwise possible.When the magnetic field decreases, analysis on the interaction process is basically the same.
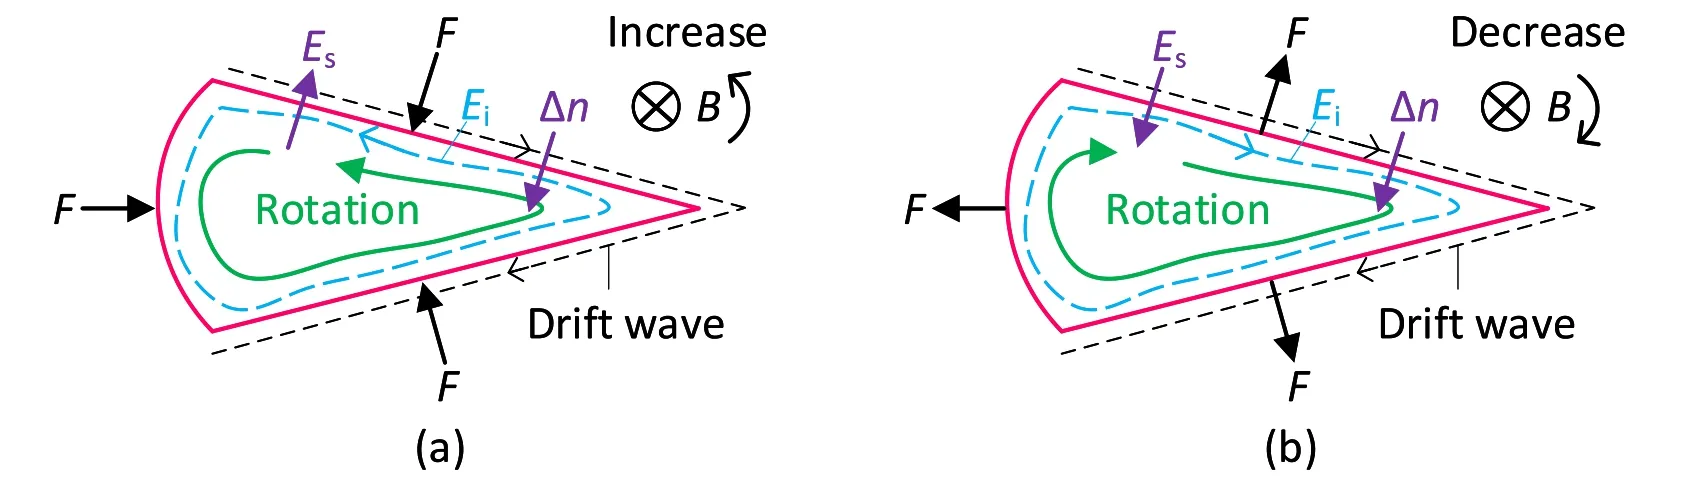
Figure 6.The electric field, force, plasma rotation, and possible drift wave when the magnetic field (a) increases and (b) decreases.
To prompt understanding the physics, the magnitudes of the induced and ambipolar electric fields are evaluated as follows.Based on Faraday’s law, the magnitude of the induced electric field |Ei| is estimated as
where L is the characteristic spatial scale and is assumed to be 0.01 m or so,ω is the characteristic variation frequency of the magnetic field, whose order of magnitude is 6 × 10⁴rad s-1,and the typical |B| equals 1 T.Thus, typical |Ei| is about 628 V m-1.Regarding the ambipolar electric field Esthat characterizes the degree of charge separation, it can be assessed according to the equilibrium equation of the electrons [35], namely
where Peis the pressure of the electrons, and it equals neTewhen the electrons are isothermal.Thus, the static electric field can be estimated as
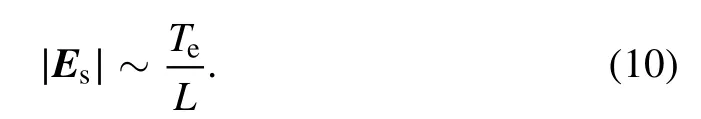
For Te= 1 eV and L = 0.01 m, |Es| ∼ 100 V m-1.It is seen that the induced static electric fields have the same order of magnitude.So, they both play important role in determining the plasma dynamics.
Figure 5(b) shows the plasma evolution in the plane parallel to the magnetic field.After the plasma is pushed away at the beginning of the magnetic field action,it enters the magnetic field,and moves upstream accompanied by an expansion along the field lines.On the pulse top of the magnetic field, the plasma flow is blocked and constrained upstream.Remarkably, there is forbidden regions in which the plasma density is extremely reduced under the effect of the magnetic field.Meanwhile,there is also a region with a substantially increased plasma density.These regions can be shown more clearly by obtaining the increment of the plasma emission intensity with the magnetic field relative to that without the magnetic field, which is shown in figure 7.
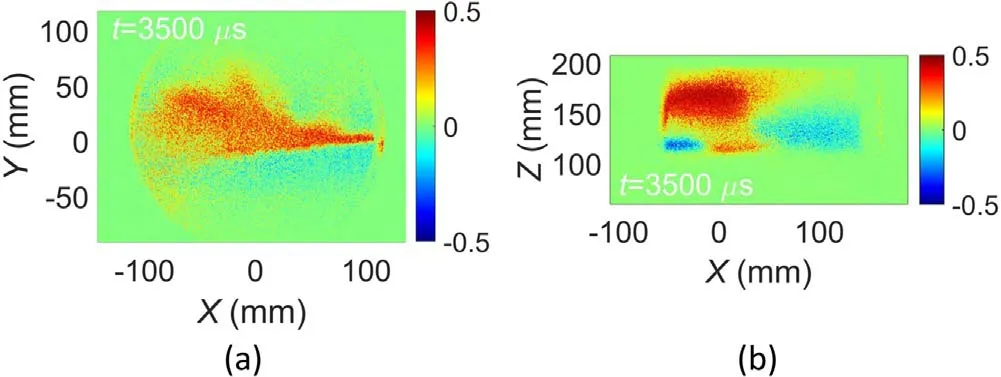
Figure 7.The increment of emission intensity at the pulse top of the magnetic field for t = 3500 μs in the plane (a) perpendicular and(b) parallel to the magnetic field.
The equilibrium distribution of the plasma can be explained by the electron transport influenced by the nonuniformity of the magnetic field.The magnetic field distribution can be divided into three regions,labeled as I,II,and III (see figure 3(a)).In regions I and II, the magnetic field attains maximum,and the magnetic field lines in both regions are nearly parallel to the blunt-body surface.Whereas for region III, the magnetic field is smaller and is basically perpendicular to the blunt-body surface.The electron transport across the magnetic field will be suppressed by the strong magnetic field considerably [36], and this can be simply explained by the reduced electron mobility μ⊥in the direction perpendicular to B relative to that μ||in the direction parallel to B [37].
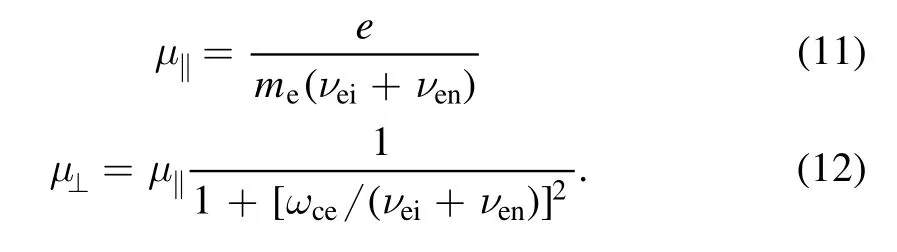
In our experiment, ωceis 10 times larger than the collision frequency, so μ⊥is only one hundredth of μ||.Then, the electron transport across the magnetic field is diminished significantly, which accounts for the density reduction in the regions with maximum magnetic field.Meanwhile, this can also explain the density reduction in the plane perpendicular to the magnetic field.
After the magnetic field repels the plasma initially,the plasma diffuses into the field from the location of low magnetic field,and moves along the magnetic field under the action of the mirror force due to the magnetic field gradient [37]
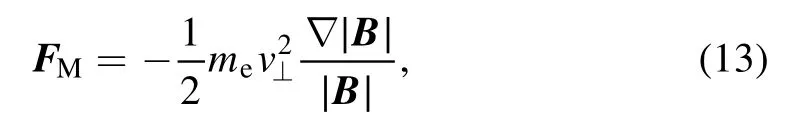
where v⊥is the electron velocity perpendicular to the magnetic field.Thus, the plasma lowers the velocity when moving from the region with low magnetic field to the region with higher magnetic field.This mechanism is responsible for the density distribution in region III.Namely, when approaching the bunt-body surface along the magnetic field line, the plasma density gradually decreases.
The previous analysis is based on the positive correlation between the emitted light intensity and the plasma density.The reliability of the correlation is validated by comparing the growth ratio of the emission with that of the plasma density in the circular region shown in figure 5(a).The plasma density is obtained with the HβStark broadening method.The measured and fitted Hβlines are depicted in figure 8 for the plasma,with and without the pulsed magnetic field.The line is acquired with the delay and gate width of the ICCD set as 1000 μs and 400 μs.The growth ratios of the emission and plasma density are equal to 3.4 and 3.1, respectively.Thus, using the emission intensity to represent the plasma density is valid in our study.Remarkably, the comparison just shows the positive correlation between the light intensity and plasma density,but the correlation coefficient cannot be obtained based on the limited data.To study the correlation degree, further experiments to acquire more data will be done in the future.
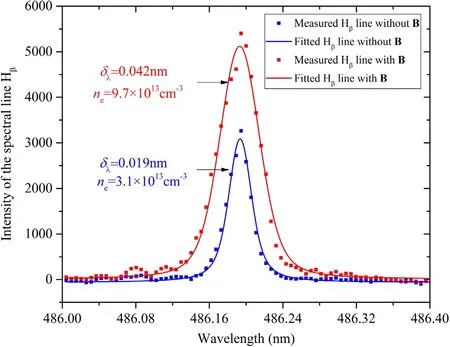
Figure 8.The measured and fitted Hβ lines emitted from the circular region in figure 5(a) for the plasma with and without the magnetic field.
3.2.Wave pattern
Figure 9 shows the wave structure observed in the plasma.It should be noted that the wave is stronger when the magnetic field is in the rising stage.The striations of the wave direct along the magnetic field and propagate perpendicularly to it.The wavelength λ is in the order of 40 mm, and its propagating velocity v is about 200 m s-1.Then, according to v = λf, the wave frequency should be 5 kHz.The low-frequency wave pattern may be the drift instability in an inhomogeneous plasma.
The two-dimensional fast Fourier transform is performed on the wave pattern in the plane parallel to the magnetic field to obtain the k–f spectrum of the wave, which is shown in figure 10.It should be noted that only the section of k < 0 and f > 0 is physically reasonable since figure 6 indicates that the drift wave will be clockwise along the plasma boundary.The drift wave propagates along the negative direction of X,so the wave number and the phase velocity must be minus.The dispersion relation shows that the group velocity of the wave pattern equals 160 m s-1approximately, which is in good agreement with 200 m s-1.The dispersion relation of the electron drift wave is
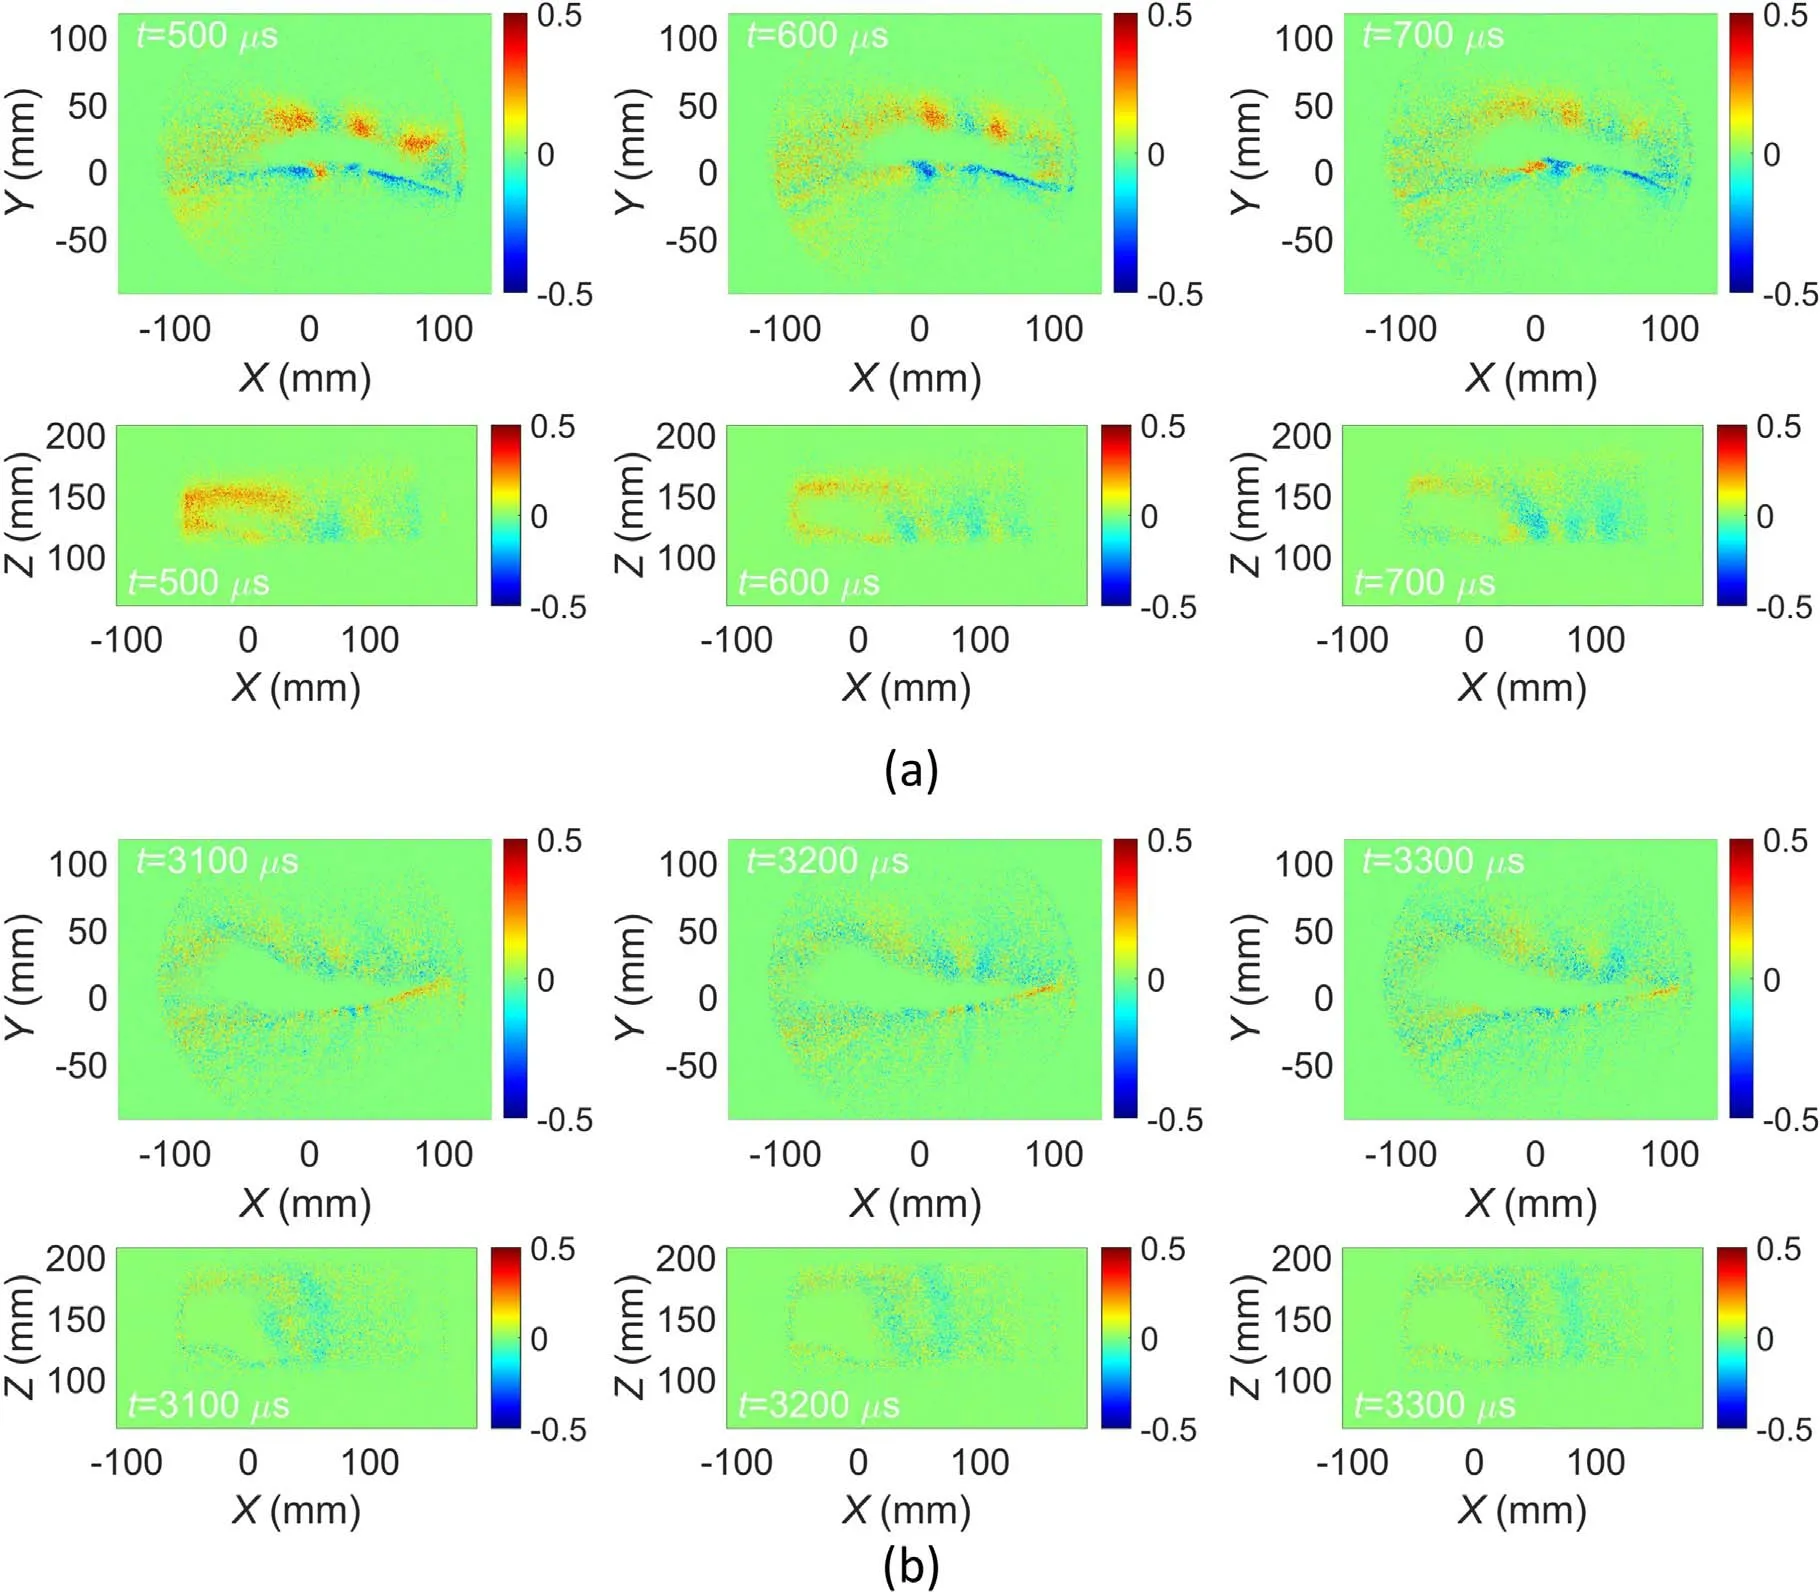
Figure 9.The wave patterns of the plasma evolution shown at the time (a) t = 500 μs, 600 μs, and 700 μs, (b) t = 3100 μs, 3200 μs, and 3300 μs.
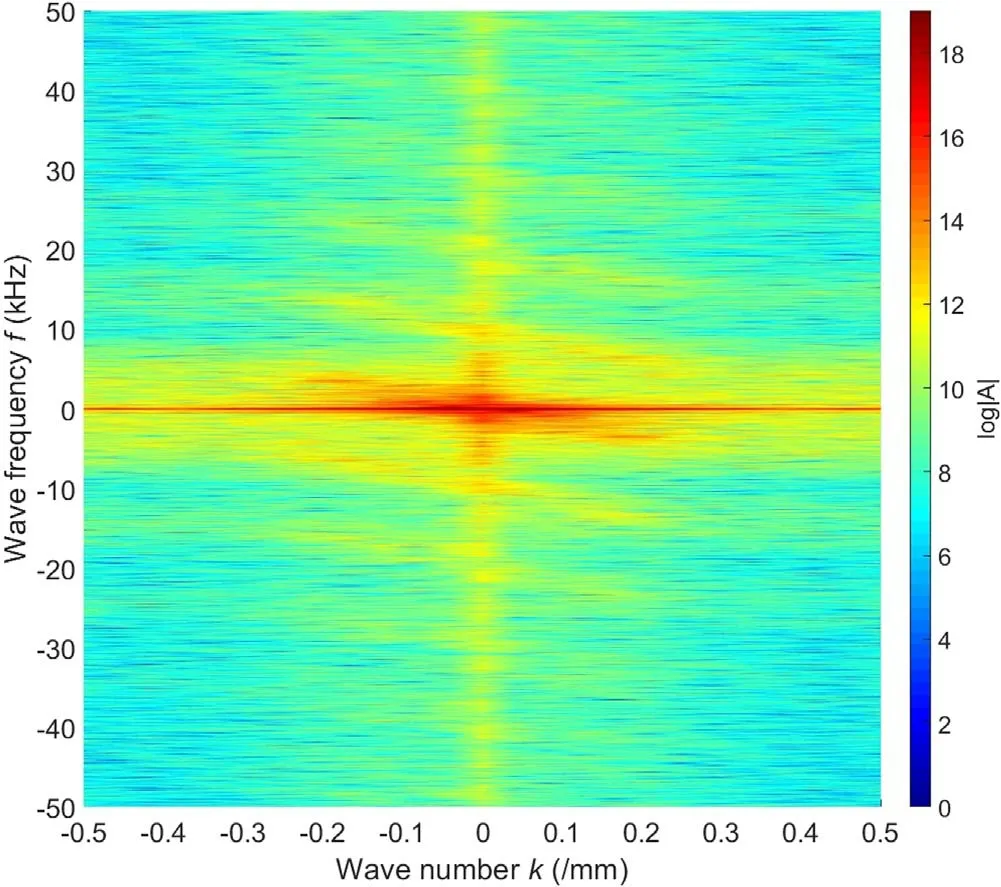
Figure 10.The k–f spectrum of the wave pattern.
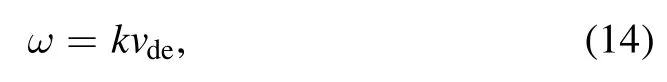
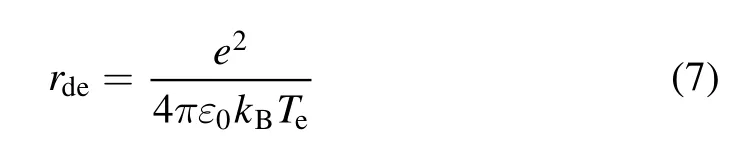
where, vdeis the electron diamagnetic drift velocity and is evaluated by [35]
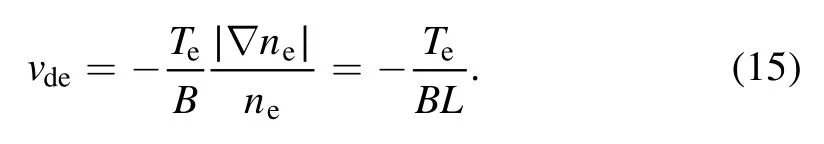
Then, vdeis estimated as 100 m s-1using our plasma parameters.The theoretical predicated velocity conforms to the observed wave velocity in the experiment.So,it is extremely possible to deduce that the wave pattern is a drift wave.The wave will be unstable because of the strong electrical resistivity of the weakly ionized plasma, which leads to a phase shift between potential and plasma density [35].
In addition, figure 11 shows the power spectrum of the pulsed magnetic field having a continuous spectrum at the low frequency and two characteristic frequency peaks at 20 and 40 kHz.The excitation of the drift wave is thought as related to the effect of the pulsed magnetic field.Especially,the plasma contracts and relaxes with the magnetic field tightening and loosing, giving rise to a wave pattern of the plasma density.However,it remains a problem to explain the driving mechanism using the spectrum of the magnetic field.This will be studied further in the future.
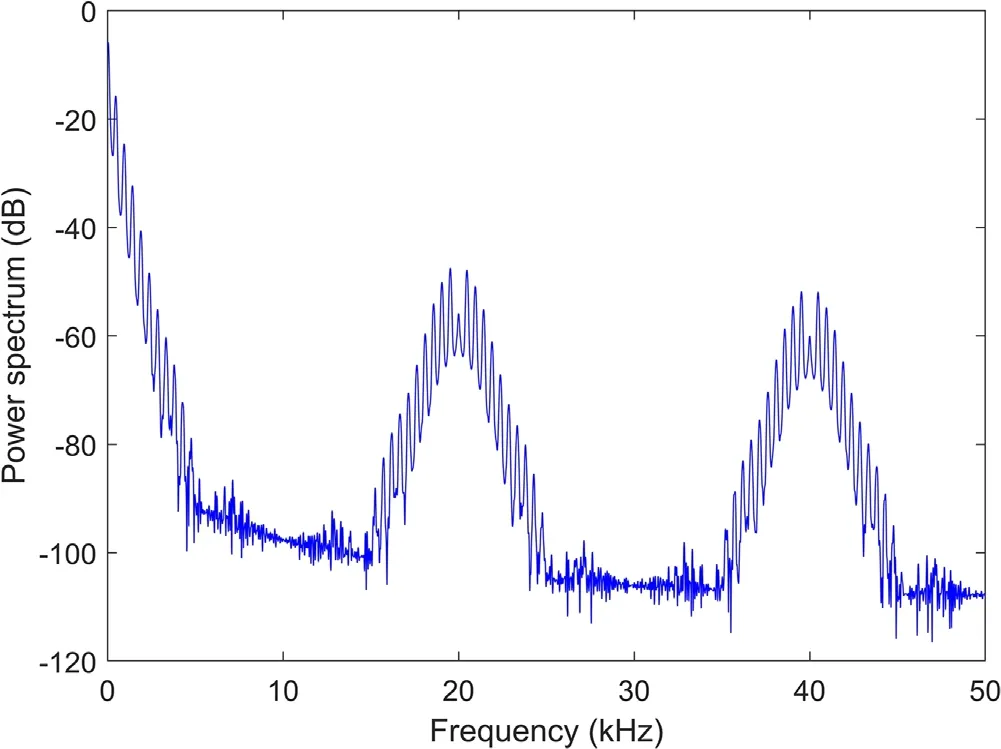
Figure 11.The power spectrum of the pulsed magnetic field.
The dynamics of the weakly-ionized plasma in a pulsed transverse magnetic field is complicated.The effects of the strong coupling between the electron flow,ion flow,and neutral flow on the dynamics should be studied further in the future.It should be noted that the weakly-ionized plasma can be described by the Hall magnetohydrodynamics [38], which is different from the traditional one for which the ions are unmagnetized due to a large Larmor radius[16]rather than a strong collision with the neutrals.In addition, in a lot of accessible research, the magnetic-Rayleigh–Taylor instability is observed for the plasma across a transverse magnetic field[3,16,22–25].Whereas,we did not see it obviously in the weakly-ionized plasma.The possible reasons are that the time resolution in our experiment is so low to capture the instability, and during the long-term evolution the instability has been stabilized.Thus,it is urgent to do the experiment using high time resolution diagnostics.In addition, the magnitude of the magnetic field may determine whether the instability occurs[14],which suggests that the effect of the magnetic field intensity should also be considered in the future.
4.Conclusions
In brief,the weakly-ionized plasma was regulated by a strong pulsed magnetic field with a pulse top of 12 ms.The density distribution of the plasma flow is modified by the transverse magnetic field greatly.Since the electron transport across the magnetic field is restrained substantially and the field gradient exerts a mirror force on the electrons, the plasma density of the regions with maximum magnetic field is decreased considerably.In the plane perpendicular to the field,the plasma is compressed radially when it propagates along the axis, thus converging to form a collimated flow.Remarkably,it is found that the pulsed magnetic field drives a wave pattern in the plasma, which is identified as a drift instability.The result is significant for applying the magnetic field to manipulate the weakly-ionized plasma.However, there is scope to explore the physical mechanisms behind the plasma evolution, and the diagnosis with a probe system is being done to facilitate understanding the physics.
Acknowledgments
This work was supported by National Natural Science Foundation of China (Nos.11975086, 51577043).
ORCID iDs
猜你喜欢
杂志排行

Plasma Science and Technology的其它文章
- Spatial and temporal evolution of electromagnetic pulses generated at Shenguang-II series laser facilities
- Numerical study on the loss of fast ions produced by minority ion cyclotron resonance heating in EAST
- Machine learning of turbulent transport in fusion plasmas with neural network
- Observation of coherent mode induced by a molybdenum dust on EAST
- Investigation of stimulated Raman scattering in longitudinal magnetized plasma by theory and kinetic simulation
- The influence of magnetic field on the beam quality of relativistic electron beam long-range propagation in near-Earth environment