Probing into the crystal plane effect on the reduction of α-Fe2O3 in CO by Operando Raman spectroscopy
2021-11-20LIPeixiaQULongmeiZHANGCaihongRENXiaoboWANGHuixiangZHANGJianliMUYuewenBaoliang
LI Pei-xia ,QU Long-mei ,ZHANG Cai-hong ,REN Xiao-bo ,WANG Hui-xiang ,ZHANG Jian-li ,MU Yue-wen ,LÜ Bao-liang,,*
(1. State Key Laboratory of Coal Conversion, Institute of Coal Chemistry, Chinese Academy of Sciences, Taiyuan 030001, China;2. Changzhi Comprehensive Inspection and Testing Center, Changzhi 046000, China;3. State Key Laboratory of High-Efficiency Utilization of Coal and Green Chemical Engineering,Ningxia University, Yinchuan 750021, China;4. Key Laboratory of Materials for Energy Conversion and Storage of Shanxi Province,Institute of Molecular Science, Shanxi University, Taiyuan 030006, China)
Abstract: For the Fe-based catalysts in Fischer-Tropsch synthesis, the reduction and activation process of α-Fe2O3 precursor has a significant effect on the catalytic performance. As a crystalline material, the reduction and activation of α-Fe2O3 is assuredly influenced by the exposed crystal plane; however, there is a lack of necessary research in this regard. In this work,α-Fe2O3 nanocrystals of three different morphologies, viz., pseudo-cubic, hexagonal-plate and rhombohedra, were synthesized, which mainly expose the crystal planes of (102), (001) and (104), respectively. The evolution of α-Fe2O3 crystal structure was then investigated in CO atmosphere by using the Operando Raman spectroscopy (ORS). The results show that the α-Fe2O3 (001) plane has a better reductive activity in comparison to the (104) and (102) planes. The SEM, TEM, XPS and XRD characterization and DFT calculation results reveal that CO2 desorption is a decisive step for the reduction of α-Fe2O3;owing to the weak binding ability of (001) crystal plane to oxygen atoms, the desorption of CO2 on the (001) crystal plane is much easier, which can promote the reduction process.
Key words: α-Fe2O3;crystal planes;Operando Raman spectroscopy;reduction
Heterogeneous catalysis is a phase interface reaction event, where one of the main subjects is to ascertain the relationship between structure and activity and then design reasonable catalysts[1–7]. It has been observed that the molecular adsorption, intermediate state and desorption energy are related to the exposed crystal planes of catalyst materials[8,9]. Wei et al[10]compared the catalytic property of Au11/TiO2-(101) and Au11/TiO2-(001) in CO oxidation and found that Au11/TiO2-(101) was much more active than Au11/TiO2-(001), because the CO preferred to be adsorbed on the metallic gold sites in Au11/TiO2-(101). In order to indepth understand the morphology effect, Jian et al[11]proposed that the α-Fe2O3(110) planes exhibited much higher ethane destruction activity and reaction stability than the (012) and (202) planes, in accordance with the DFT results, that is, the oxygen vacancies were more easier to form on the (110) planes. Qin et al[12]reported that the Co3O4(112) planes showed the highest catalytic activity and the lowest selectivity to methane in comparison to the (111) and (001) planes, due to the former specific surface topology of active phase. A better understanding on the relation between crystal structure and catalytic performance may pave the way for a rational design of efficient catalysts.
The Fischer-Tropsch synthesis (FTS) is a promising route to produce liquid fuels and other value-added chemicals via syngas from coal, natural gas, or biomass[13–18]. Iron oxide (Fe2O3) is recognized as potential catalyst compared to other catalysts due to the advantages of high water-gas shift activity, wide temperature range and low cost[19–21]. It is generally accepted that iron carbides are the active phases in FTS and iron oxide as the precursor must undergo a series of activation treatments to achieve high Fischer-Tropsch reaction activity[22–24]. It has been reported that the topological structure may change in the phase transition process and the crystal plane of the precursor will inevitably affect the surface structure and catalytic performance[25–27]. Therefore, it is of great significance to reveal changes in the crystal phase and crystal surface structure during the activation of iron oxide.Generally, the activation treatment of iron oxide was conducted in three atmospheres, viz., CO, H2, and syngas[28,29]. In particular, the iron catalyst reduced by CO exhibited relatively high activity[30,31]. As the morphology of α-Fe2O3can be controllably synthesized by hydrothermal methods, it is then possible to study the reduction process of α-Fe2O3precursors with different crystal planes under CO atmosphere, in order to design efficient Fe-based catalysts in FTS.
Operando Raman spectroscopy (ORS) can operate in a broad temperature range of 25 –1000 °C and pressure range of 0.1–10.0 MPa, to detect the change in phase structure and prove the formation of carbonaceous species during the reaction in real time[32–37]. Fu et al[38]reported that α-Fe2O3was only partially transformed into γ-Fe2O3by pre-treatment in H2, whereas the transformation of α-Fe2O3to γ-Fe2O3to Fe3O4and to Fe5C2was observed in both CO and syngas (H2/CO). Sattler et al[39]further observed that the intensity of the scattered Raman light was directly proportional to the amount of scattering molecules upon carbon deposition during the reaction process.
In this work, α-Fe2O3nanocrystals of three different morphologies, viz., pseudo-cubic (Fe2O3-C),hexagonal-plate (Fe2O3-H) and rhombohedra (Fe2O3-R), were synthesized, which mainly expose the crystal planes of (102), (001) and (104), respectively. The evolution of α-Fe2O3crystal structure was then investigated in CO atmosphere by using the Operando Raman spectroscopy (ORS). Combining with various techniques like SEM, TEM, XRD, XPS and DFT calculations, the crystal plane effect on the reduction of α-Fe2O3in CO was clarified.
1 Experimental
1.1 Catalyst preparation
α-Fe2O3nanocrystals of three different morphologies were synthesized by hydrothermal methods, described as following (Table S1).
Fe2O3-C. 6 mmol Fe(NO3)3·9H2O and 0.07 mol CH3COONH4were dissolved in 60 mL ethanol and 3 mL distilled water was then added to the solution.After vigorously stirring for 30 min, the mixture was transferred into Teflon-lined autoclaves of 150 mL and maintained at 180 °C for 24 h.
Fe2O3-H. 6 mmol FeCl3·6H2O and 0.06 mol CH3COONa were dissolved in 60 mL distilled water and 4.2 mL distilled water was added to the solution.After vigorously stirring for 30 min, the mixture was transferred into Teflon-lined autoclaves of 150 mL and maintained at 180 °C for 24 h.
Fe2O3-R. 0.012 mol Fe(NO3)3·9H2O and 0.12 mol formamide were dissolved in 120 mL distilled water,and 0.06 mol formamide was added to the solution.After vigorously stirring for 30 min, the mixture was transferred into Teflon-lined autoclaves of 150 mL and maintained at 160 °C for 24 h.
In all three cases, the precipitates obtained were separated by centrifuging, washed with distilled water and absolute ethanol alternately to remove any impurities on the surface, and then dried at 60 °C.Before further characterization and evaluation, the obtained catalysts were crushed and sieved into granules of 40–80 mesh.
1.2 Catalyst characterization
The crystallographic structures of the as-prepared samples were determined by powder X-ray diffraction(XRD) patterns recorded on a D8 Advance Bruker AXS diffractometer, using CuKα radiation (λ= 1.5406 Å) at 40 kV, 40 mA, employing a scanning rate of 0.01° in the 2θrange of 10°–90°. The morphology and structure of the as-prepared samples were observed using scanning electron microscopy (SEM, JSM-7001F) and transmission electron microscopy (TEM, JEM-2100F and JEOL-2010). The specific surface areas of the samples were measured by nitrogen sorption using a TriStar 3020 physisorption analyzer. X-ray photoelectron spectroscopy analysis (XPS) were performed on an AXIS ULTRA DLD spectrometer.
1.3 Computational details
All the calculations were carried out within the framework of plane-wave density functional theory(DFT), implemented in Viennaab initiosimulation package (VASP)[40,41]. The projector augmented wave(PAW) pseudopotential method[42,43]and PBE generalized gradient approximation (GGA)[44]were selected. The atomic positions were optimized using conjugate gradient method, until the Hellmann-Feynman force acting on each atom was smaller than 0.01 eV/Å. The kinetic energy cutoff for plane waves was set to 500 eV. A large vacuum spacing (more than 15 Å) was taken to prevent mirror interactions. The Brillouin zones were sampled with 2π × 0.02 Å−1spacing in reciprocal space by the Monkhorst–Pack scheme[45]. Hubbard correction was applied to Fe, for which the effective on site Coulomb interaction (Ueff=5.2 eV) was determined in bulk α-Fe2O3using a linear response approach[46].
1.4 Operando Raman spectroscopy (ORS)
The laser Raman spectra were recorded with a home-build operando setup using a confocal Raman spectroscopy (LabRAM HR, Horiba J.Y.) and equipped with a high-grade Leica microscope. The catalyst sample was placed in an alumina ceramic fixed-bed microreactor, in which silicon carbide was placed downstream under the catalyst bed to eliminate void volume. All Raman spectra were probed under visible 514 nm Ar+laser with long working distance objective 50 ×. The single crystal silicon was used for the position correction. An attenuator was used to avoid the signal overflow and the sample degradation.The confocal hole was set to 800 μm and exposure time was set to 20 s for all tests. The Raman spectra were all taken in a range from 150 to 2000 cm−1. The scattered light was collected at 180° (back scattering plane) and detected by deep-depleted thermoelectrically cooled CCD array detector (1024 × 256 pixels, 26 mm in size).The gas flow rate was controlled by Glass Rotameter and the temperature was controlled by T95 System Controller which is connected with CCR 1000.
Prior to the reduction, the catalyst sample was heated from room temperature to 350 °C at a ramp of 5 °C/min under 21%O2/N2(20 mL/min), and then cooled down to 25 °C in Ar flow (20 mL/min). Next,the catalyst was heated to 350 °C with a heating rate of 5 °C/min under 10%CO/Ar (15 mL/min); the Raman spectra were then recorded and the reaction was allowed to run for 8 h.
2 Results and discussion
2.1 XRD, TEM and SEM results
Figure 1 shows the XRD patterns of α-Fe2O3nanocrystals of three different morphologies. All the diffraction peaks can be indexed to the α-hematite crystallographic phase of Fe2O3(rhombohedra structure, JCPDS 33-0664, space group R-3c). No other impurities are detected, revealing the high purity and crystallinity of the α-Fe2O3nanocrystals.
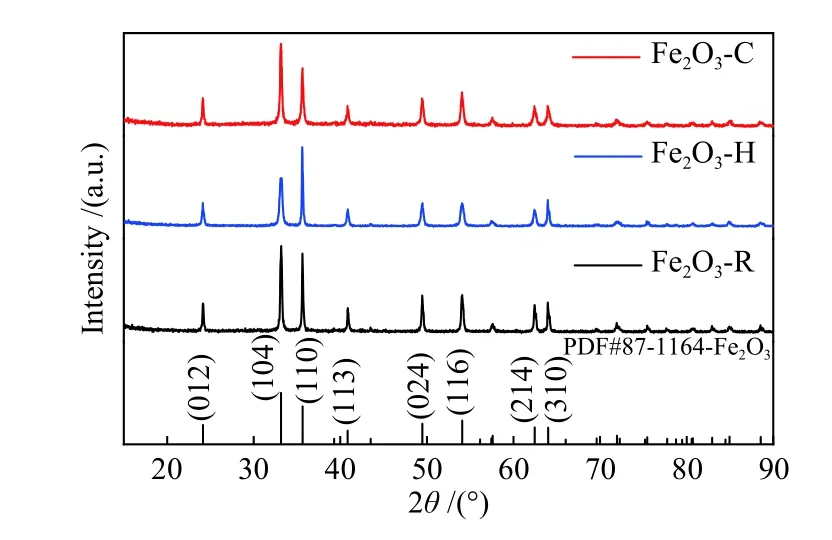
Figure 1 XRD patterns of three α-Fe2O3 samples
Figures 2 and 3 show the SEM and TEM images of three α-Fe2O3samples. Fe2O3-C has a uniform diameter of 60–80 nm with the average thickness of 60 –80 nm (Figures 2(a) and 3(a1) ). The electron diffraction patterns (Figure 3(a2)) show that the single crystalline structure and the SAED spots are ascribed to(102), (104), and (110) planes and/or their equivalent planes under the incident electron beam along the[–221] direction. The HRTEM image (Figure 3(a3))displays a lattice spacing of 0.37 nm and an interfacial angle of 88°, highly consistent with the projection of α-Fe2O3along the [–221] direction (Figure 3(a4)). All these suggest that the Fe2O3-C crystal is enclosed by the (102) plane and its equivalent planes.

Figure 2 SEM images of (a) Fe2O3-C, (b) Fe2O3-H, and (c) Fe2O3-R
For Fe2O3-H, the SEM (Figure 2(b)) and TEM(Figure 3(b1)) images show a uniform diameter of 60–80 nm with average thickness of 20–30 nm. The sharp diffraction SAED spots (Figure 3(b2)) correspond to the (2–10), (1–20) and (110) planes and reveal the single crystalline nature, consistent with the crystal structure (Figure 3(b4)) and/or equivalent planes under the incident electron beam along the [001] direction.The HRTEM image (Figure 3(b3)) shows a lattice spacing of 0.25 nm and an interfacial angle of 60°,highly consistent with its crystal structure, indicating that the exposed planes of Fe2O3-H are (001) planes.
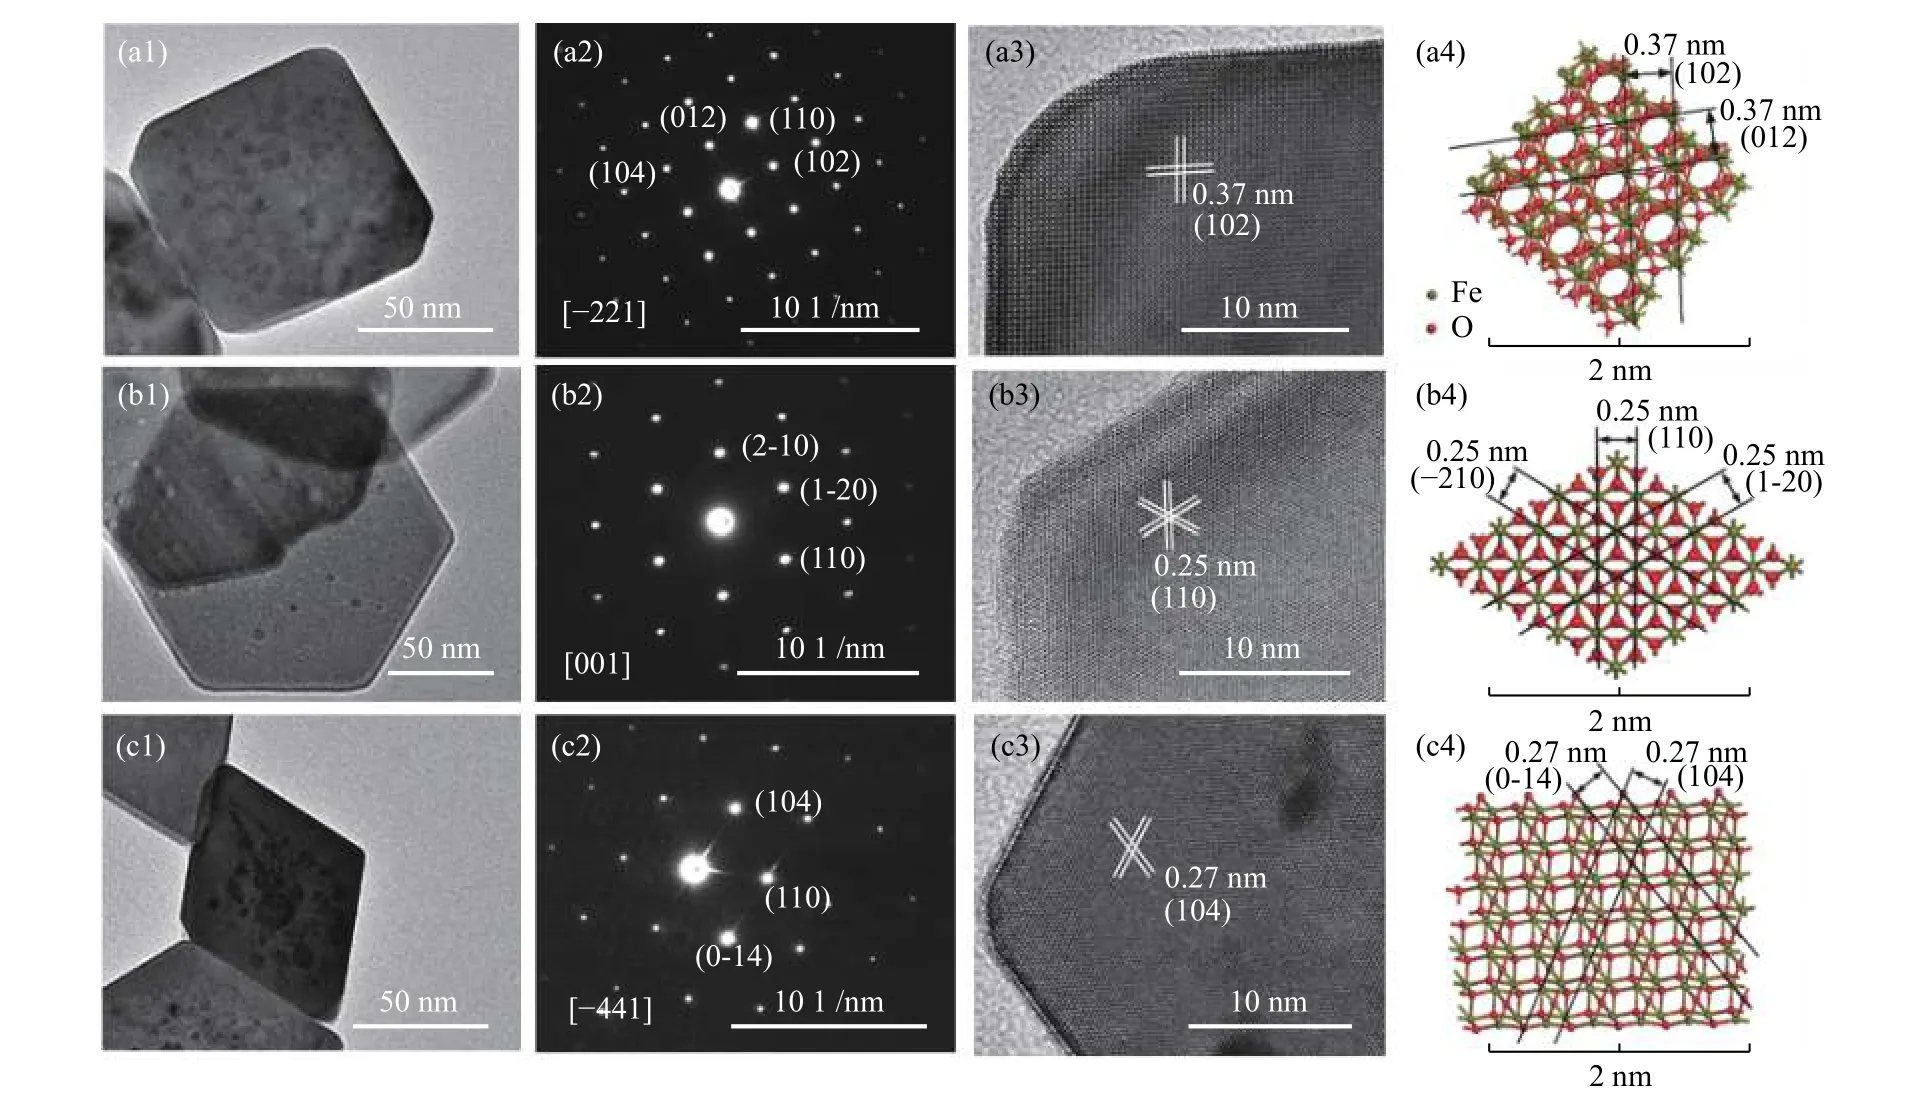
Figure 3 TEM images, SAED patterns, HRTEM images and corresponding crystal structures of the fresh α-Fe2O3 nanocrystals:(a1)–(a4) Fe2O3-C; (b1)–(b4) Fe2O3-H; and (c1)–(c4) Fe2O3-R
For Fe2O3-R, the SEM (Figure 2(c)) and TEM(Figure 3(c1)) images show a uniform diameter of 60–80 nm with the average thickness of 20–40 nm. The sharp diffraction SAED spots (Figure 3(c2)) reveal the single-crystalline nature, corresponding to the (104),(110) and (0-14) planes and/or their equivalent planes under the incident electron beam along the [–441]direction. The HRTEM image (Figure 3(c3)) displays a lattice spacing of 0.27 nm and an interfacial angle of 64.8°, highly consistent with its crystal structure(Figure 3(c4)), indicating that the exposed planes of Fe2O3-R are (104) planes.
All three catalyst samples display regular morphology and uniform particle size. As given in Table S2, these materials also have similar surface area. The similarities in surface area and particle size could greatly facilitate an accurate discussion on the plane-dependent activity of α-Fe2O3in reduction.
2.2 Operando Raman spectroscopy results
As shown in Figure 4(a), the typical bands at 540 and 660 cm−1correspond to the T2g(3) and A1gmode of magnetite[47,48], which appear initially and hold stable at 350 °C within 1.5 h. Meanwhile, the bands of carbonaceous species at 1380 cm−1(d-band) and 1580 cm−1(g-band) are observed at 2.5 h. As the catalyst was heated from room temperature to 350 °C in CO atmosphere, it has undergone a phase change from α-Fe2O3to Fe3O4before being detected by ORS(0 h). The structure evolution of other two samples is similar to that of Fe2O3-C; that is, the phase of Fe3O4appears at the beginning for ORS detection (0 h).However, three samples are rather different in the time needed to form various carbonaceous species; the rate to form carbonaceous species follows the order of Fe2O3-H > Fe2O3-C > Fe2O3-R, i.e. (001) > (102) > (104).
The d-band is usually attributed to the C=C stretching in disordered graphitic carbonaceous species,while the g-band is assigned to more graphitized carbon[49]. Figure S1 illustrates that the intensity of the d-band and g-band decreases with the increase of carbonization degree. The reduced catalyst samples were characterized by XPS; as displayed in Figure S2,the peaks of FexC appear at around 720.5 and 707.5 eV.The XRD patterns shown in Figure S3 demonstrate that the diffraction peaks correspond to the crystallographic phase of Fe5C2, suggesting that the catalyst is quickly carburized after being reduced to magnetite; therefore,a dense layer of carbonaceous species is formed on the catalyst surface, as identified by TEM (Figure S4).
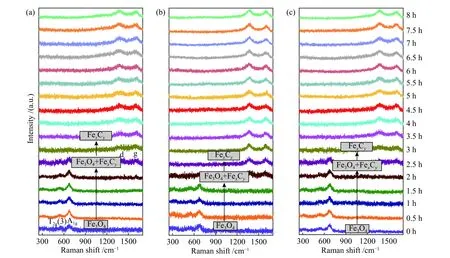
Figure 4 In situ Raman spectra of (a) Fe2O3-C, (b) Fe2O3-H and (c) Fe2O3-R at 350 °C in 10% CO/Ar
2.3 DFT calculation results
Due to the dynamic and instantaneous nature, it is difficult to illustrate the difference of various crystal planes only by direct experimental tests. Therefore, the CO adsorption and CO2desorption on three crystal planes were investigated by theoretical calculation and the models were built on the basis of mainly exposed crystal planes of iron oxide particles with different morphologies. The pseudo-cubic, hexagonal-plate and rhombohedra crystals correspond to the (102), (001)and (104) planes, respectively.
Previous investigations have shown that CO prefers to be adsorbed on the Fe site[50]. Figure 5 displays the adsorption behaviors of CO molecule to different Fe atomic sites and Table 1 gives corresponding calculated adsorption energies.Apparently, the adsorption energy of CO on the (102)planes is higher than those on the (001) and (104)planes, i.e. in the order of (102) > (001) > (104),indicating a stronger interaction between CO molecule and (102) planes. The desorption behaviors of CO2molecule from different Fe atomic sites can be evaluated from the bond length between O atom and Fe atom in the Fe-O-C structure, as given also in Table 1.Obviously, the desorption of CO2molecule from the(001) planes is much easier than that from the (102)and (104) planes, i.e. following the order of (001) >(102) > (104), in good accordance to the order of reduction activity. This phenomenon indicates that CO2desorption might play a decisive role in the reduction of iron oxide process, which is related to the binding capacity of iron oxide lattice to oxygen. The longer bond length between O atom and Fe atom in Fe-O-C structure is, the weaker binding capacity of CO2molecules and iron oxide lattice will be, and the CO2molecules will be easier to desorb. The desorption of CO2molecules leads to the migration of internal oxygen atoms out of the iron oxide lattice, promoting the entire reduction process with CO.
The surface chemical states and composition of three α-Fe2O3samples were characterized by XPS. As displayed in Figure 6(a), the doublet peaks of Fe 2p1/2and Fe 2p3/2are located at around 724.3 and 710.4 eV,respectively, in accordance with typical binding energies of Fe3+in Fe2O3[51]. The typical satellite peak of α-Fe2O3is located at around 718.8 eV, in well agreement with the characteristic peak of Fe2O3[52]. For O 1s, as shown in Figure 6(b), the peaks at 529.4,529.8, and 531.2 eV belong to the lattice oxygen of metal oxides (OL), oxygen-vacancies regions (OV), and adsorbed oxygen (OC), respectively; the adsorbed oxygen is usually associated with dissociated and chemisorbed oxygen species[53]. Table 2 gives the proportion of three O species for different exposed planes of α-Fe2O3estimated from O 1sspectra.Apparently, the amount of oxygen vacancies also follows the order of Fe2O3-H > Fe2O3-C > Fe2O3-R, i.e.(001) > (102) > (104), which is probably responsible for the reduction behaviors over three kinds of α-Fe2O3particles in CO. It was reported that the high content of oxygen vacancies can weaken the binding capacity of the iron oxide lattice and oxygen, promoting the migration of oxygen and the catalyst reduction[54].
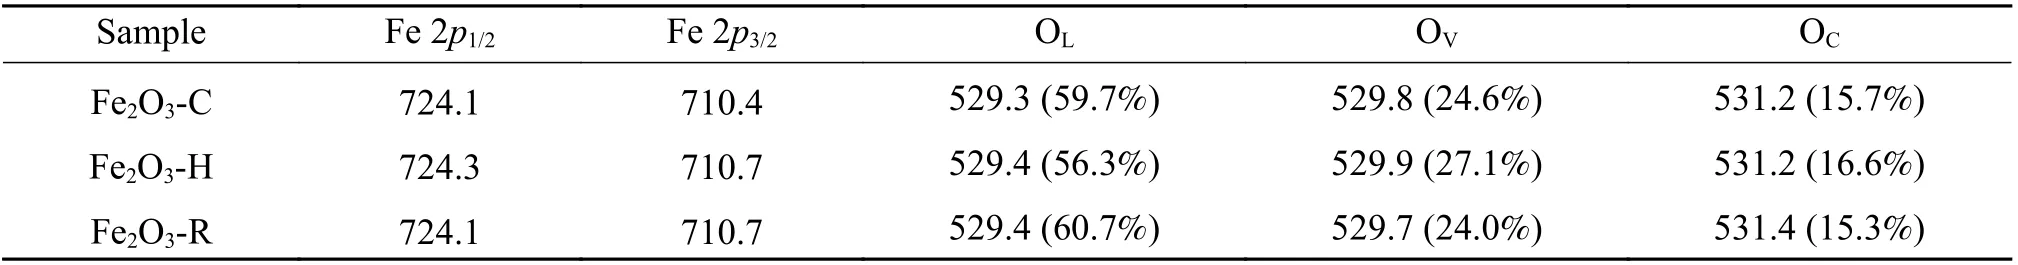
Table 2 Peak position (eV) in the Fe 2p and O 1s XPS spectra and relative contents of various O species (in parentheses) estimated from O 1s XPS spectra for different α-Fe2O3 samples

Figure 6 XPS spectra of (a) Fe 2p and (b) O 1s of various α-Fe2O3 samples
Table 1 Length of O–Fe bond and the adsorption energy of CO adsorption on different planes of α-Fe2O3
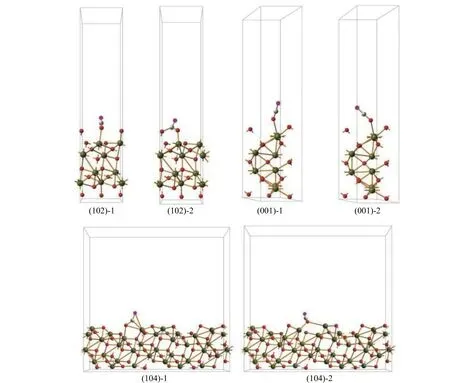
Figure 5 Adsorption of CO on α-Fe2O3 with different exposed crystal planes (Yellow and red balls stand for Fe and O atoms of iron oxide lattice, respectively; brown and purple balls stand for C and O atoms of CO molecular, respectively)
In summary, current results illustrate that the desorption of CO2is the critical step for the reduction of iron oxide in CO. The oxygen vacancies can weaken the binding capacity of the iron oxide lattice to oxygen and then accelerate the reduction process.
3 Conclusions
α-Fe2O3nanocrystals of three different morphologies, viz., pseudo-cubic, hexagonal-plate and rhombohedra, were synthesized, which mainly expose the crystal planes of (102), (001) and (104),respectively. The evolution of α-Fe2O3crystal structure was then investigated in CO atmosphere by using the Operando Raman spectroscopy (ORS).
The results show that the α-Fe2O3(001) plane has a better reductive activity in comparison to the (104)and (102) planes. The SEM, TEM, XPS and XRD characterization and DFT calculation results reveal that CO2desorption is a decisive step for the reduction of α-Fe2O3; owing to the weak binding ability of (001)crystal plane to oxygen atoms, the desorption of CO2on the (001) crystal plane is much easier, which is beneficial to the reduction process. The exposed (001)planes are provided with abundant oxygen vacancies,which can weaken the binding capacity of the iron oxide lattice to oxygen and then accelerate the reduction process.
These findings illustrate that catalytic reduction process of iron oxide could be regulated by the selective exposure of a specific crystal plane, which may provide certain clues for the rational design of iron-base catalysts in FTS.
杂志排行

燃料化学学报的其它文章
- Mo-Sn 催化剂上甲醇低温氧化制甲缩醛
- 酸活化蒙脱土在二甲醚水蒸气重整制氢中的应用
- Ni 对MoS2 基催化剂活性相及加氢脱氮脱硫性能的影响
- Insight into reaction path and mechanism of catalytic cracking of n-hexane in HZSM-5 zeolites
- CO2/CH4/N2 在MER 型沸石中扩散和分离的分子动力学模拟
- Addition of bismuth to Pt and Pd for electric power generation with selective cogeneration of acetate from ethanol in a fuel cell type reactor