Analysis of properties of krypton ion-implanted Zn-polar ZnO thin films∗
2021-09-28QingFenJiang姜清芬JieLian连洁MinJuYing英敏菊MingYangWei魏铭洋ChenLinWang王宸琳andYuZhang张裕
Qing-Fen Jiang(姜清芬),Jie Lian(连洁),†,Min-Ju Ying(英敏菊),Ming-Yang Wei(魏铭洋),Chen-Lin Wang(王宸琳),and Yu Zhang(张裕)
1School of Information Science and Engineering,Shandong Provincial Key Laboratory of Laser Technology and Application,Shandong University,Jinan 250100,China
2Key Laboratory of Beam Technology of Ministry of Education,College of Nuclear Science and Technology,Beijing Normal University,Beijing 100875,China
Keywords:polar ZnO film,molecular beam epitaxy,Kr implantation,optical properties,bandgap
1.Introduction
Zinc oxide(ZnO)material is a wide bandgap semiconductor with high exciton binding energy(60 meV),[1–3]which has broad prospects in many applications such as photodetector,[4]catalysts,[5]and solar cells.[6]Simultaneously,the adjustment of optical properties like bandgap is an essential key to the photoelectric devices with higher requirements than the intrinsic ZnO materials.The ZnO has opposite polarization surfaces due to the lack of inverse symmetry of the c axis,[7]namely,the O-polar ZnO and Zn-polar ZnO.The opposite polar surfaces have been reported to produce a different influences on optical,chemical,and electrical properties.[8,9]Compared with O-polar ZnO the Zn-polar ZnO has strong ability to absorb ultraviolet light and better photocatalytic performance,making it more suitable for being applied to short-wave optoelectronic devices.[10,11]For these reasons,we investigate ion implantation’s effect on the different polar ZnO materials separately.[12]
Among many methods of preparing ZnO materials,[13,14]molecular beam epitaxy(MBE)is the most advanced technique for growing high-quality crystal films on substrates.Its advantage is that the composition of film can be adjusted rapidly with the change of source.[15]In this paper,the MBE is used to form Zn polar ZnO films.
Ion implantation is a non-equilibrium renewable semiconductor doping technique that introduces doped elements and defects into crystalline materials.[16]Compared with other chemical doping methods,it has good controllability.Ion implantation changes the compositions,structures,and properties of the materials,and then optimizes their properties to obtain some new excellent properties.[17,18]
To expand ZnO materials’practical application,it is crucial to change ZnO thin films’properties,such as adjusting the optical bandgap and others.The selection of process parameters and dopants have an essential influence on the microstructure and optical properties of films.The doping of ZnO materials has attracted more and more attention.[19,20]In previous studies,various dopants from metal elements like Ga,[21]Al,[22]and rare earth elements like Eu[23]and Er[14]have been doped into ZnO materials.The studies have shown that doping has a significant influence on the optoelectronic and magnetic properties of ZnO materials.It has guiding significance for the application of ZnO materials.However,there are few studies on Kr ion-implanted polar ZnO materials.Krypton is chemically inert.Previously,Ying et al.[24]investigated the effects on magnetic properties of krypton ion-implanted Znpolar ZnO materials,and ion implantation can result in the change of optical properties,which are critical for the application of materials.[25]Therefore,it is necessary to study the optical properties of krypton ion-implanted Zn-polar ZnO films.
In the present article,the effects of Kr doping on structure,surface morphology,and optical properties of Zn-polar ZnO thin film are investigated in detail.The results indicate that the Kr ion implantation affects the structure and properties of Zn-polar ZnO film.The change of optical properties may be due to the structural changes caused by ion implantation.This research offers a guideline to judge whether the Kr-doped Zn-polar ZnO thin films can be applied to new photoelectric devices.
2.Experimental methods
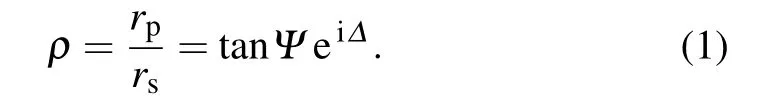
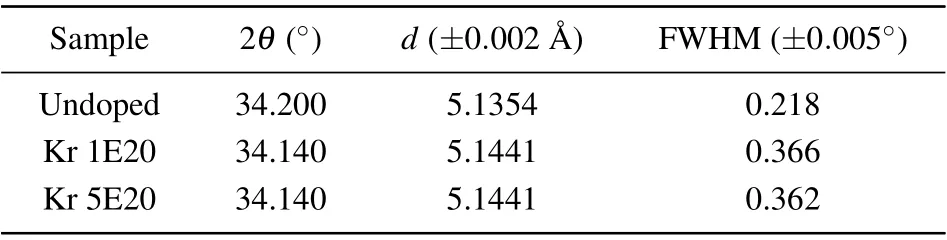
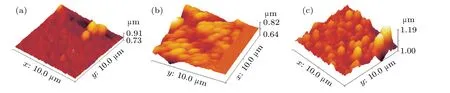
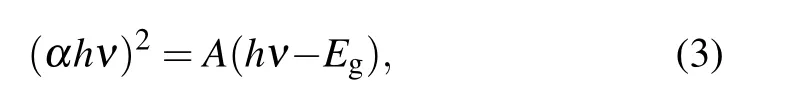
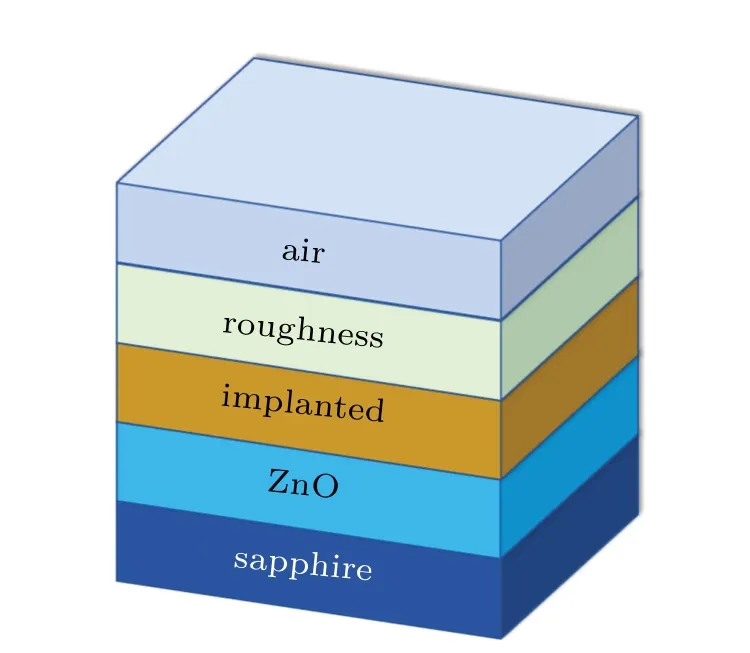
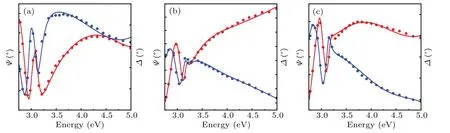
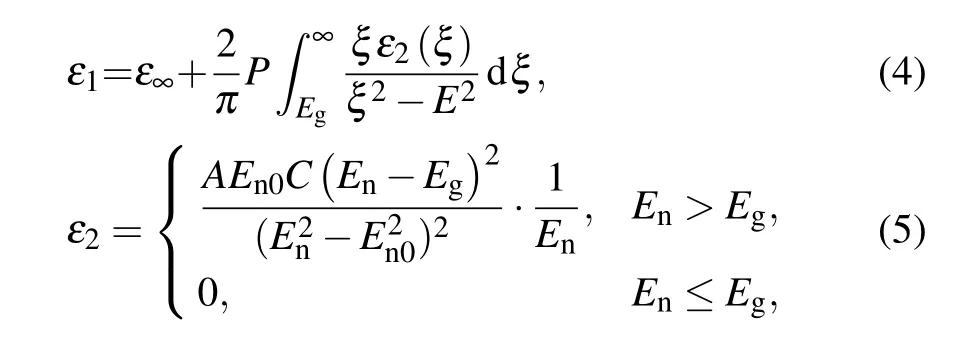
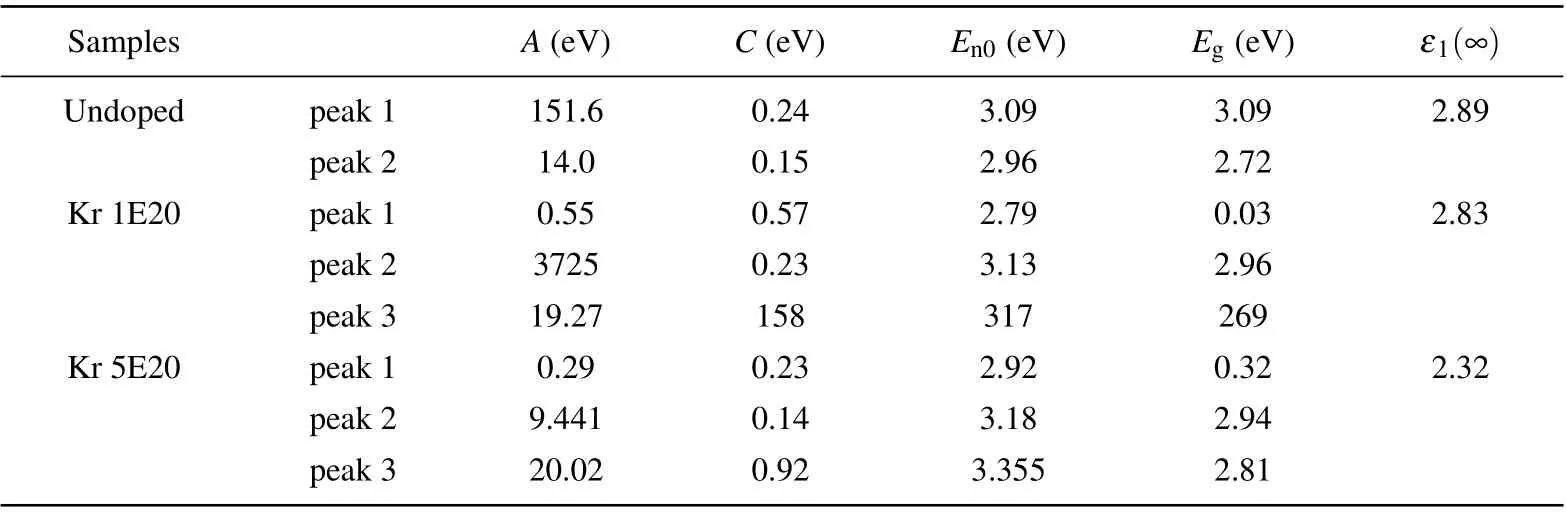
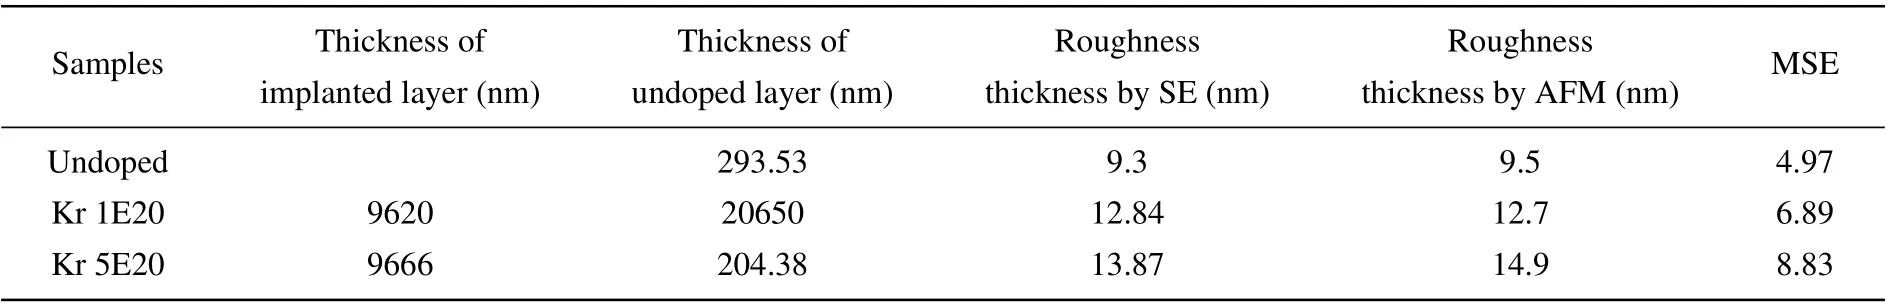
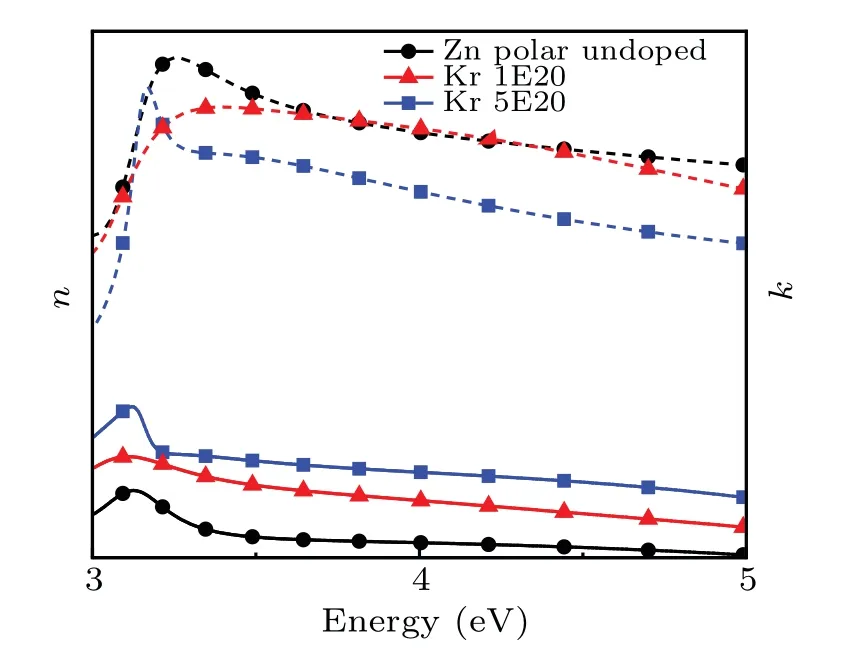
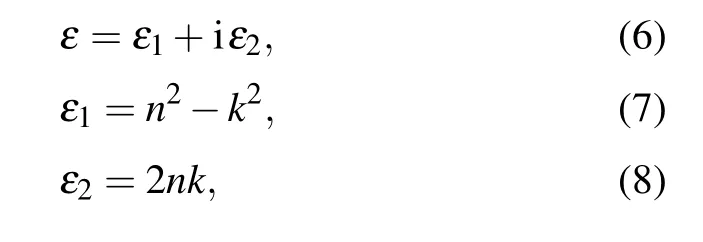
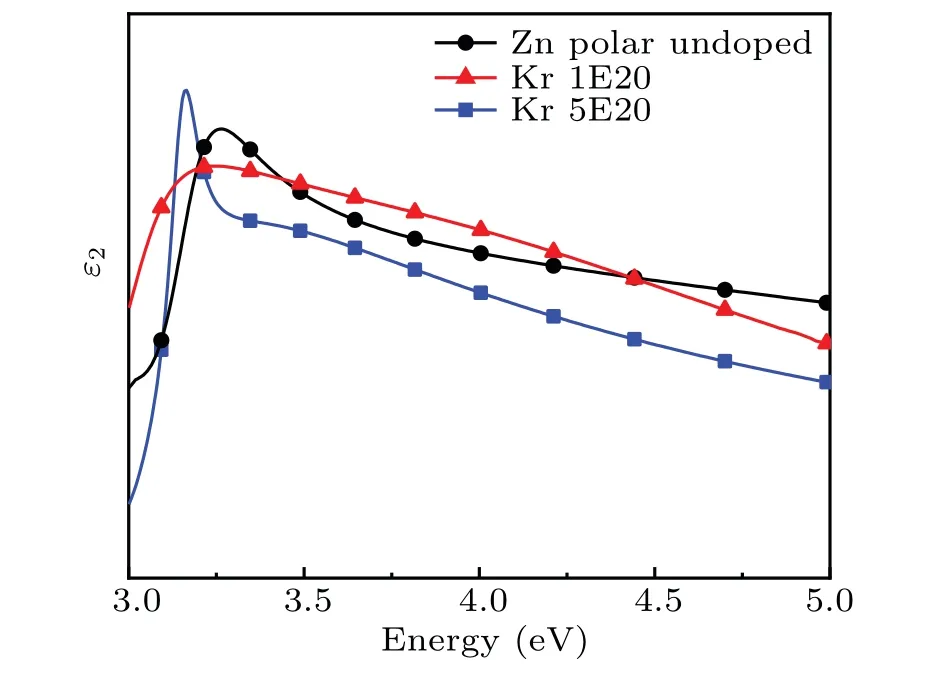
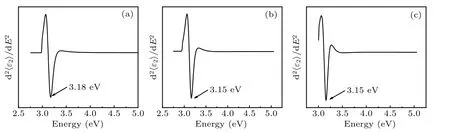
High-quality Zn-polar ZnO films were fabricated on sapphire substrates through the MBE method.[26]The thickness for each of the films was 300 nm.The substrates were exposed to an oxygen plasma(270 W/1.5 sccm)at 500°C for 30 min.This step was done to obtain a uniform oxygen-terminated surface.Next,a thin MgO buffer layer was produced at 500°C,and followed by a ZnO buffer layer and epilayer growth at 450°C and 650°C,respectively.[12]It was shown that rock salt-MgO layers grown in the typical Stranski–Krastanov pattern produce Zn-polar ZnO.[27]Three Zn-polar ZnO samples were prepared and the AFM results verified that the samples are Zn-polar films.[28]The Kr ions were injected into the films by ion implantation under vacuum condition.Sample 1 is an undoped Zn-polar ZnO film.Sample 2 and sample 3 have Kr-implanted concentrations of about 1×1020cm−3and 5×1020cm−3,denired as Kr 1E20 and Kr 5E20.The concentrations of 1×1020cm−3and 5×1020cm−3were almost uniform at depths 10 Fig.1.Summed implantation distribution profiles of Kr ions. The sample morphology was analyzed using AFM(Nanosurf,Switzerland).The D8 Advance system XRD(xray wavelengthλ=1.51˚A)was used for making structural analysis in a 2θrange from 20°to 60°.Since ZnO has strong absorption in the ultraviolet band,absorption spectra were performed in a wavelength range of 325 nm–500 nm with a double beam spectrometer(UV-3600,Shimadzu).The PL spectral testing was done using a He–Cd laser(325 nm,30 mW),which served as an excitation source. The SE was used to characterize the optical properties of Zn-polar ZnO films.It is an effective tool used to characterize nanostructures’optical properties with its accuracy and non-destructive properties.[29–31]The parameters were acquired from the parameters(Ψ,Δ)which are related to reflection coefficients of the sample,rpand rs,respectively for p-polarized light and s-polarized light by In recent studies of ZnO materials’optical properties,it is commonly utilized to accurately acquire film parameters by varying the films’polarization states and employing suitable dispersion models.[32]After inversion operations,the SE results provide the spectral dielectric function,ZnO layer thickness,and surface roughness thickness.The SE measurements were performed in a wavelength range of 245 nm–450 nm(5.06 eV–2.75 eV)in steps of 0.6 nm and at an incident angle of 65°.The above experiments were carried out at room temperature. Figure 2 shows the XRD patterns of samples inθ–2θgeometry.All the films are of c axis out-of-plane oriented with only ZnO(0002)diffraction peak,indicating that the prepared samples are all high-quality samples.Compared with pure ZnO materials,no other diffraction peaks in the XRD pattern indicate that Kr ion implantation does not induce any additional phase.The values of inter-planar spacing and the full width of half maximum(FWHM)of samples are listed in Table 1.The inter-planar spacing(d)is calculated by Bragg’s relation[33] where d is the interplanar distance,n is an integer,andθis the diffraction half angle.Comparing with the undoped Znpolar ZnO film,the increase of d and FWHM indicate that the majority of Kr ions are located at the grain boundaries for samples and a small part of Kr ions enter into the grain lattice,thus causing the lattice to expand.The results of the study are consistent with previously reported conclusions.[24] The three-dimensional AFM images of undoped and Krimplanted Zn-polar ZnO films are illustrated in Figs.3(a)–3(c).The results show that all the samples have a pit surface structure.The surface structure has changed obviously after implantation and different ion concentration also affects the surface appearance.As the Kr ion implantation concentration increases,the surface pits become more pronounced.The results are consistent with the observations that the majority of Kr ions are located at the grain boundaries of Zn-polar ZnO film.The roughness for each of three thin films is gained via the arithmetic square root(Ra),and the roughness values of Zn-polar undoped film,Kr 1E20 sample,and Kr 5E20 sample are 9.5 nm,12.7 nm,and 14.9 nm,respectively.Since the test results show that the roughness cannot be ignored,a roughness layer is required during subsequent model building in the SE work. Table 1.Values of 2θ,interplanar spacing,and FWHM of samples. Fig.3.Three-dimensional images of three samples:(a)Zn-polar undoped,(b)Kr 1E20,(c)Kr 5E20. Fig.4.Absorption spectra of three samples,with inset showing Tauc plot. Figure 4 shows the absorption spectra of samples obtained by a double beam spectrometer.As can be seen,there is high absorption in the ultravioletregion.The sharp drop in the absorption at about 375 nm is associated with the transition between the valence band and conduction band.[34]Comparing with the undoped sample,the results show that the absorption of Kr implantation sample is enhanced. The bandgap can be figured out from the basic absorption edge of the sample.As a direct bandgap semiconductor,the ZnO material has a bandgap that can be estimated from the following formula:[14] where A is a constant,Egis the bandgap energy,h is Planck’s constant,andυis the frequency.The Egcan be obtained by drawing(αhν)2versus energy and extending the straight-line portion of plot to the transverse axis.The results are given in the inset of Fig.4.It can be seen from the inset in Fig.4 that the bandgap energies of Zn-polar undoped,Kr 1E20,and Kr 5E20 samples are 3.16 eV,3.13 eV,and 3.12 eV,respectively. Figure 5 shows room temperature photoluminescence spectra.The PL peaks for the Zn-polar undoped,Kr 1E20,and Kr 5E20 samples are located at 3.29 eV,3.27 eV,and 3.27 eV,respectively.These peaks are induced by exciton relaxation and associated with near-edge emission which is caused by the radiative recombination of holes in the valence band with electrons in the conduction band.[35]Compared with the undoped sample,Kr-implanted Zn-polar ZnO film’s PL peak shifts toward lower energy.And this phenomenon of redshift may be due to the narrowing of the bandgap.[36]No impurities are introduced into the film for the undoped sample,and no other stray peaks exist.The weak impurity peaks in the result may be from the experimental process.The PL peaks for the Znpolar undoped,Kr 1E20,and Kr 5E20 samples have different FWHMs,which are 0.363 eV,0.334 eV,and 0.089 eV,respectively.The PL peaks are narrowed after Kr ion implantation. Fig.5.PL spectra of three samples. The influences of Kr implantation on the optical properties of Zn-polar ZnO films are investigated by spectroscopic ellipsometry.The results of SE are obtained by establishing a structure model and dispersion model.Before modeling,the optical constants of the sapphire substrate are measured.Since the three samples’roughness values cannot be ignored,a five-layer model(air/roughness/implanted ZnO/ZnO/sapphire)needs to be established in the fitting process.Figure 6 displays the model of sample.For the sample without ion implantation,a four-layer model is established.The rough layer,which consists of 50%voids and 50%ZnO,is built with a Bruggeman effective medium approximation.[37] Fig.6.Schematic diagram of structural model. Fig.7.Ellipsometric experimental data(point)and simulated data(line)for(a)Zn-polar undoped sample,(b)Kr 1E20 sample,and(c)Kr 5E20 sample,with blue color denotingψand red color referring toΔ. To acquire optical parameters successfully for the ionimplanted layer,the measured spectra are parameterized by using Tauc–Lorentz oscillators.[38]The Tauc–Lorentz oscillator is defined by[ε1(∞),A,C,Eg,and En0],and they involve the effects of high energy,amplitude parameter,a broadening parameter,bandgap energy,and peak transition energy,respectively.The TL dispersion mode gives the expression of the dielectric function as shown below:[39] where A is the amplitude parameter,C is the broadening parameter,and En0represents the peak transition energy.The optimal fitting parameters are listed in Table 2,and the fitting results of films are shown in Fig.7.The measured data are represented by points,and the simulated data are denoted by solid lines.Then,the TL model’s validity can be confirmed by the small value of the mean squared error(MSE).[32]The MSE and other parameters are given in Table 3.The roughness obtained from the AFM is also presented in Table 3.The experimental data are in agreement with the fitted data,and the thickness result is consistent with 300 nm,which indicates the fitting’s correctness. As shown in Fig.8,the refractive index(n)and the extinction coefficient(k)are obtained from the SE fitting results.The refractive index is represented by a dotted line,and the extinction coefficient is denoted by a solid line.As can be seen in the figure,the refractive index of the ZnO film decreases with the Kr doping increasing,while the extinction coefficient increases.As the Kr ion implantation concentration increases,the refractive index of the film decreases and the extinction coefficient also increases.With the Kr implantation,the fullwidth at half maximum,the grain size,and the surface density of samples change.These changes lead the extinction coefficient to change.[40,41]Thus,the ion implantation can be used to regulate the refractive index of polar ZnO films,which has significant application value for designing the integrated optical devices.[42] Table 2.Optimal fitting parameters in TL dispersion mode. Table 3.Parameters of samples obtained by SE and AFM. Fig.8.Variations of refractive index n(dotted line)and extinction coefficient k(solid line)with energy. The dielectric function is of great importance in studying the optical properties,especially the imaginary part of the dielectric function.[43]The expression for the dielectric function and the formula to calculate them are shown as follows: whereε1andε2are real and imaginary pars of the dielectric function,respectively.Theε2is related to electron transition energy between the valence band and the conduction band.[39]Figure 9 shows the imaginary parts’spectra of the dielectric function.It can be seen thatε2for each of all samples shows a tendency of first increase and then decrease. The second-derivative spectra of the imaginary part of dielectric function are computed to accurately obtain the bandgap of samples as illustrated in Figs.10(a)–10(c).It can be seen from Fig.10 that the bandgap has a redshift with the Kr implantation,which is in agreement with the result of absorption spectra.And this might be attributed to variations in grain size,structural parameters,etc.[44]The shifting in Egvalue indicates that the bandgap can be regulated by injecting Kr ions into polar ZnO materials. Fig.9.Variations of imaginary part of the dielectric function with energy for three different samples. Fig.10.Second-derivative spectra of imaginary part for(a)Zn-polar undoped sample,(b)Kr 1E20 sample,and(c)Kr 5E20 sample. The Kr ions are implanted into high-quality Zn-polar ZnO films fabricated through the MBE method on sapphire substrates by ion implantation.The XRD results show that the samples are of good quality.The AFM results show that the surface morphology of Zn-polar ZnO film is changed after Kr implantation.Moreover,the optical properties are gained by absorption spectrum,PL,and SE.The results show that the absorption increases and the bandgap decreases with ion implantation. Moreover,the Kr ion implantation concentration also affects the properties of the film.The films’refractive index decreases with the Kr ion implantation concentrationincreasing In short,Kr ion implantation regulates the properties of Znpolar ZnO films.This study can conduce to the photoelectric applications of ion-implanted ZnO thin films. Acknowledgment We are deeply grateful to Miss Min-Ju Ying for her valuable support.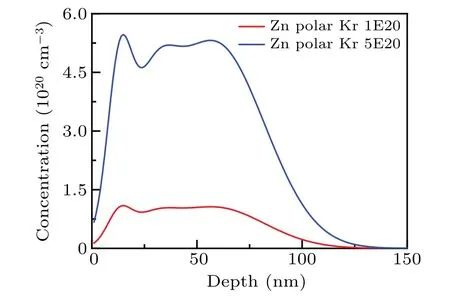
3.Results and discussion


4.Conclusions
猜你喜欢
杂志排行

Chinese Physics B的其它文章
- Multiple solutions and hysteresis in the flows driven by surface with antisymmetric velocity profile∗
- Magnetization relaxation of uniaxial anisotropic ferromagnetic particles with linear reaction dynamics driven by DC/AC magnetic field∗
- Influences of spin–orbit interaction on quantum speed limit and entanglement of spin qubits in coupled quantum dots
- Quantum multicast schemes of different quantum states via non-maximally entangled channels with multiparty involvement∗
- Magnetic and electronic properties of two-dimensional metal-organic frameworks TM3(C2NH)12*
- Preparation of a two-state mixture of ultracold fermionic atoms with balanced population subject to the unstable magnetic field∗