Thermoelectric enhancement in triple-doped strontium titanate with multi-scale microstructure∗
2021-09-28ZhengCao曹正QingQiaoFu傅晴俏HuiGu顾辉ZhenTian田震XinbaYaer新巴雅尔JuanJuanXing邢娟娟LeiMiao苗蕾XiaoHuanWang王晓欢HuiMinLiu刘慧敏andJunWang王俊
Zheng Cao(曹正),Qing-Qiao Fu(傅晴俏),Hui Gu(顾辉),Zhen Tian(田震),Xinba Yaer(新巴雅尔),Juan-Juan Xing(邢娟娟),‡,Lei Miao(苗蕾),Xiao-Huan Wang(王晓欢),Hui-Min Liu(刘慧敏),and Jun Wang(王俊),§
1Inner Mongolia Engineering Research Center of Multi-functioanl Copper Based Materials,School of Materials Science and Engineering,Inner Mongolia University of Technology,Hohhot 010051,China
2School of Materials Science and Engineering,Materials Genome Institute,Shanghai University,Shanghai 200444,China
3School of Material Science and Engineering,Guilin University of Electronic Technology,Guilin 541004,China
Keywords:strontium titanate,multiple-doping,multi-scale microstructure,nano-inclusions
1.Introduction
Strontium titanate(SrTiO3)is a promising thermoelectric material for applications in electricity generation and sensors like photothermoelectric devices[1]because of its high stability and large Seebeck coefficient(S).[2]A large S and electrical conductivity(σ)and a low thermal conductivity(κ)are needed to obtain a high thermoelectric dimensionless figure of merit,ZT=S2σT/κ.[3]It is expected that a high ZT of SrTiO3can be obtained by reducingκand increasing PF=S2σ;[4]however,the interdependence of S,σ,andκcomplicates control of the thermal electrical transport properties of bulk materials.[5]The ZT of many alloys and inorganic compounds has been improved by separately controlling S,σ,andκthrough band-engineering,[6]component control,[7–9]and structure control.[10–12]Some layerstructured oxides[13,14]and two-dimensional SrTiO3[15,16]exhibit high ZT values because of their intrinsically low thermal conductivity or large PF.SrTiO3thin films with a high ZT have been obtained,but polycrystalline bulk materials are more suitable for thermoelectric applications.The ZT of polycrystalline SrTiO3still falls short of requirements due to its high thermal conductivity and low carrier mobility.Theσ of SrTiO3can be optimized by doping to increase the carrier concentration.[17–24]
Combining heavy doping and compositing allows the coordinated control of electrical conductivity and thermal conductivity.[25,26]Previous works have shown that La and Nb are effective n-type dopants that can enhance electrical transport properties when used to replace Sr and Ti,respectively.[17,26]But the thermal conductivity of SrTiO3is still higher than other perovskite oxides such as SrCeO3and BaCeO3.[27]If Ce reduces the thermal conductivity,an improved ZT can be expected when Ce,La,and Nb are used to co-dope SrTiO3while maintaining a high power factor;however,there have been few reports on triple-doped SrTiO3thermoelectric materials.In this work,we introduce a highperformance La–Ce–Nb-doped SrTiO3thermoelectric with a low thermal conductivity and a relatively large power factor.
2.Experimental materials and methods
2.1.Sample preparation
Sr1−x−yLaxCeyTi1−zNbzO3(x=0–0.05,y=0–0.05,z=0–0.05)nanoparticles were prepared by a hydrothermal method.NbCl5(Shanghai Macklin Biochemical Co.,Ltd.)was added into a mixture of ethylene glycol(Tianjin Fengchuan Chemical Reagent Co.,Ltd.)and deionized water with a volume ratio of 1:1 and 10%[Ti(OBu)4](Aladdin Industrial Corporation)and mixed via ultrasonic oscillation.An aqueous solution containing 0.6 M Sr(NO3)2and stoichiometric amounts of Ce(NO3)3·6H2O and La(NO3)3·6H2O(Aladdin Industrial Corporation)were added into the above solution,followed by the addition of 6.4 M NaOH(Aladdin Industrial Corporation).The obtained solution was immediately transferred to a 100 mL teflon-lined stainless-steel autoclave and held at 180°C for 24 hours.The obtained powders were washed several times with glacial acetic acid to remove residual organic matter and then dried for 2 hours at 80°C.The obtained nanoparticles were pre-pressed under 4.3 MPa using a hydraulic press,followed by cold isostatic pressing(CIP)under 200 MPa.The samples were then embedded into carbon powders and sintered at 1573 K for 5 hours in a muffle furnace to obtain a black bulk sample,as shown in the process schematic in Fig.1.
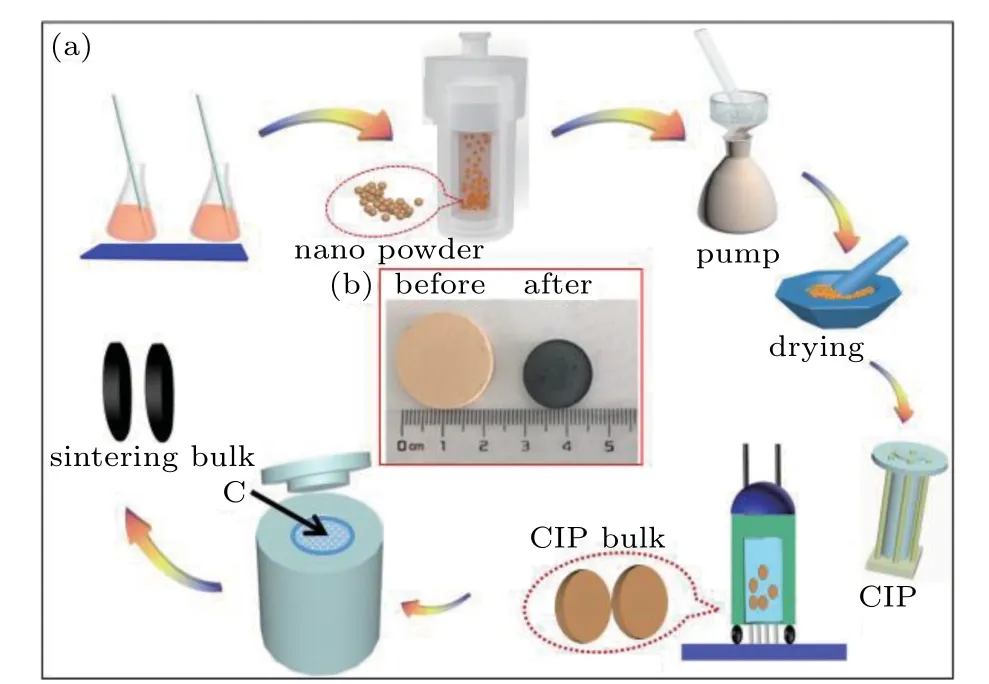
Fig.1.The formation process of La–Ce–Nb-doped SrTiO3.(a)Schematic diagram of the preparation method and(b)photos of obtained bulk samples before and after sintering.
2.2.Sample characterization
All specimens were characterized by scanning electron microscopy(SEM,Zeiss,G300),x-ray diffraction(XRD,Rigaku D/Max-2500),and transmission electron microscopy(TEM,JEOL F200).The electrical conductivity and Seebeck coefficient were measured from 300 K to 1000 K in a helium atmosphere using a Linseis LSR-3.Thermal conductivity(κ)was calculated by the equationκ=DCpρ,where the thermal diffusivity D was measured by the laser flash method using a NETZSCH LFA 457,the specific heat Cpwas measured by differential scanning calorimetry using a NETZSCH DSC STA 449F3,and the densityρwas measured by Archimedes method.The Hall coefficients were measured using the van der Pauw method under a reversible magnetic field of 1.5 T.
3.Results and discussion
3.1.Phase analysis
Figure 2 shows the XRD and TEM images of La–Ce–Nb-doped powders.All SrTiO3powders doped with different dopants and doping ratios showed cubic perovskite structures(PDF#73-0661),and no impurity phase peaks were observed in the XRD patterns in Fig.2(a)and the TEM-EDS result in Fig.2(b).A slight broadening of the diffraction peak in Fig.2(a)indicated that the powders had a small grain size,and the grain size distributed in 15 nm–40 nm,as determined from the TEM image(Fig.2(c)).The distance between the two lattice stripes determined from the HRTEM image was 0.278 nm as shown in Fig.2(d),which was consistent with the(110)planar spacing of SrTiO3(PDF#73-0661).The XRD peaks shifted by different degrees as the doping concentration changed,due to the substitution of large Sr2+(144.0 pm)ions at the A-site by smaller La3+(136.0 pm)ions and Ce3+(134.0 pm),as well as the substitution of small Ti4+(60.5 pm)ions at B-site by larger Nb5+(64.0 pm)ions.Moreover,the TEM-EDS analysis showed that La,Ce,and Nb were detected in SrTiO3grains for La5Ce5Nb5,indicating the introduction of dopant elements into the SrTiO3lattice.
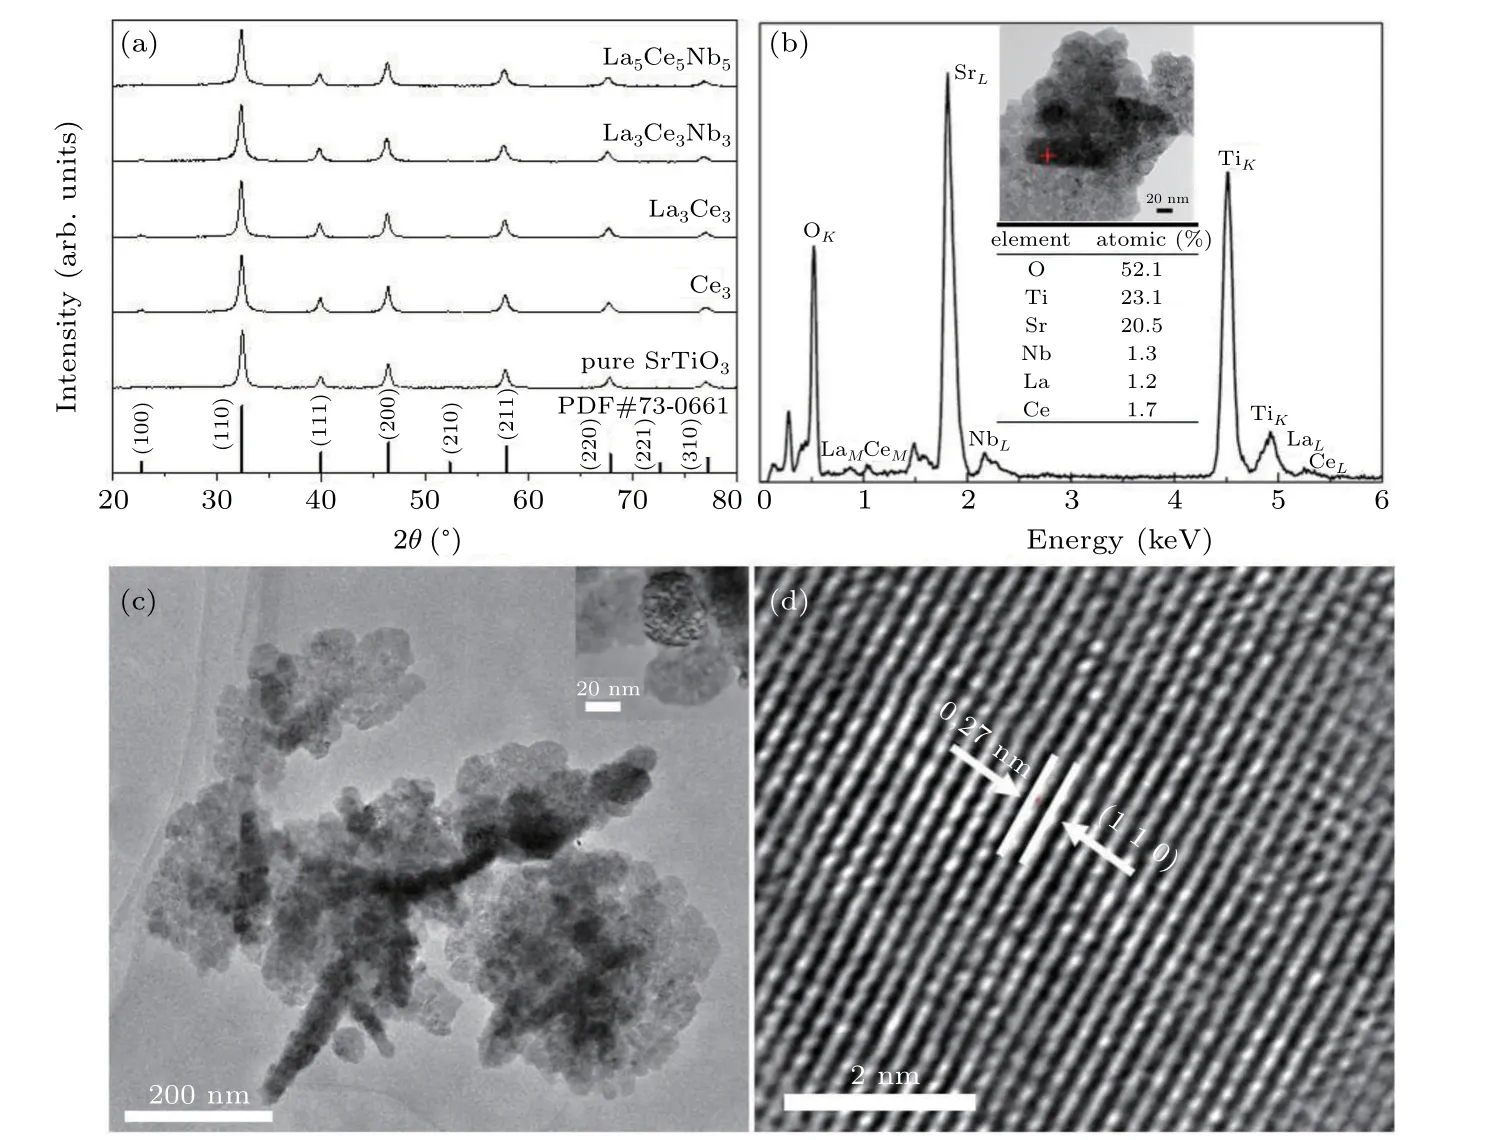
Fig.2.(a)XRD patterns of La,Ce,and Nb co-doped SrTiO3 powders with different doping ratios,(b)TEM-EDS,(c)TEM image and(d)HRTEM image of La5Ce5Nb5 powder.
As shown in Fig.3,the XRD patterns of bulk samples contained peaks attributed to a secondary phase,along with peaks for the SrTiO3main phase;however,the weak peaks did not match those in the standard XRD pattern,suggesting that the weak peaks appeared due to several kinds of secondary phases.The grains of all samples grew into irregular polyhedrons after sintering,as shown in Fig.4.
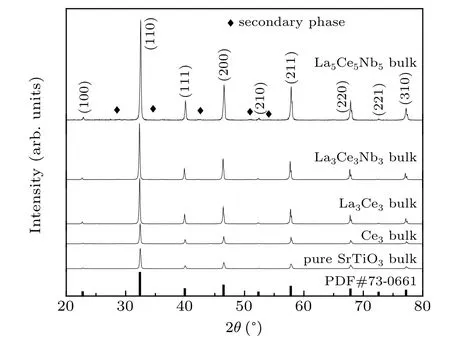
Fig.3.XRD patterns of bulk SrTiO3 samples with different La,Ce,and Nb ratios.
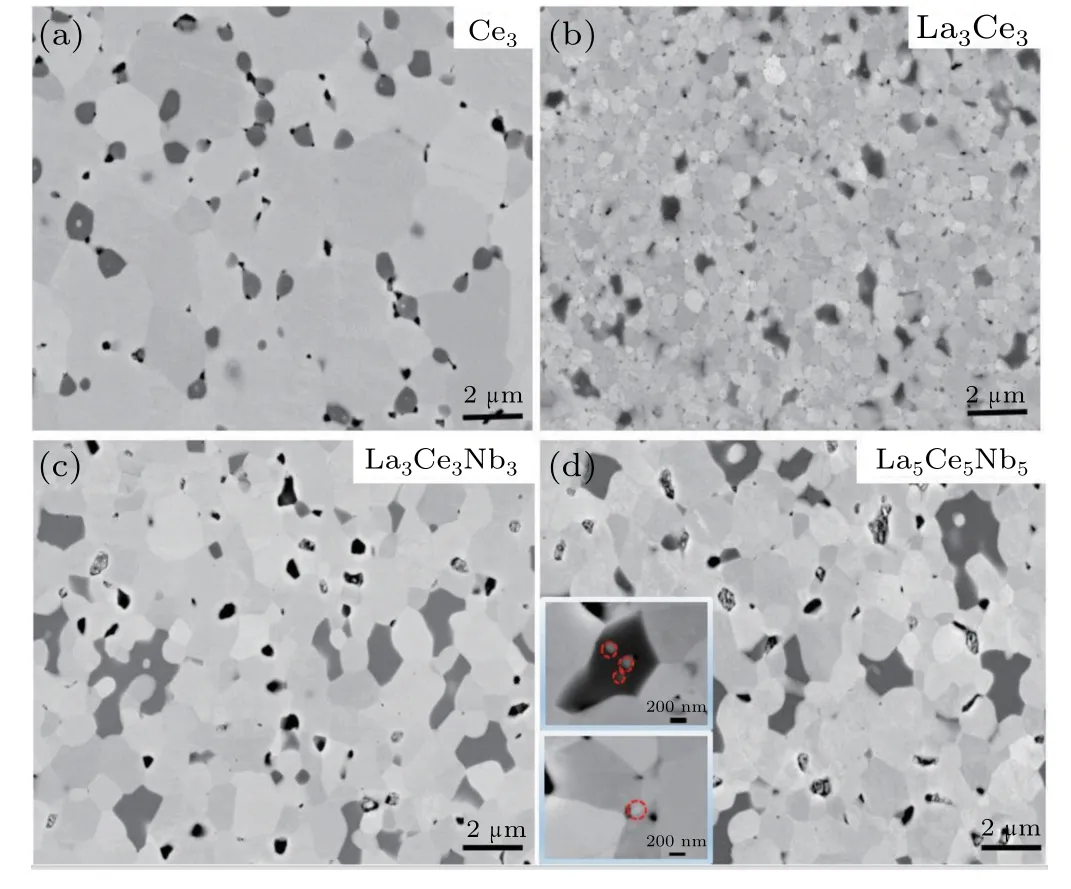
Fig.4.SEM images of samples(a)Ce3,(b)La3Ce3,(c)La3Ce3Nb3,and(d)La5Ce5Nb5 and the inset of the nano-inclusions and nano-scale grain.
3.2.Microstructural analysis
The bulk samples were compacted with relatively high densities as shown in Fig.4,even though several types of grains with different contrasts,shapes,and sizes were observed.Many regular and gray grains were SrTiO3,while the irregular and black grains,randomly distributed in the perovskite matrix were secondary phases.Furthermore,nanoparticles were observed in some secondary phase grains,and some of these particles were completely wrapped in the secondary phases,while the others were only partially wrapped.The grain sizes ranged from the nanoscale to the microscale except for the sample La3Ce3.
Figures 5(a)and 5(b)showed the SEM images and corresponding EDS element maps of La3Ce3Nb3and La5Ce5Nb5,which showed that La,Ce,Nb,Sr,Ti,and O were evenly distributed in the matrix.Some Ti-rich oxide phase was observed,suggesting that the SrTiO3matrix partially decomposed during sintering.Figure 5(c)shows that La and Ce existed only in the matrix,and Nb was distributed both in the matrix and secondary phase,but there was more in the matrix than in the secondary phase.
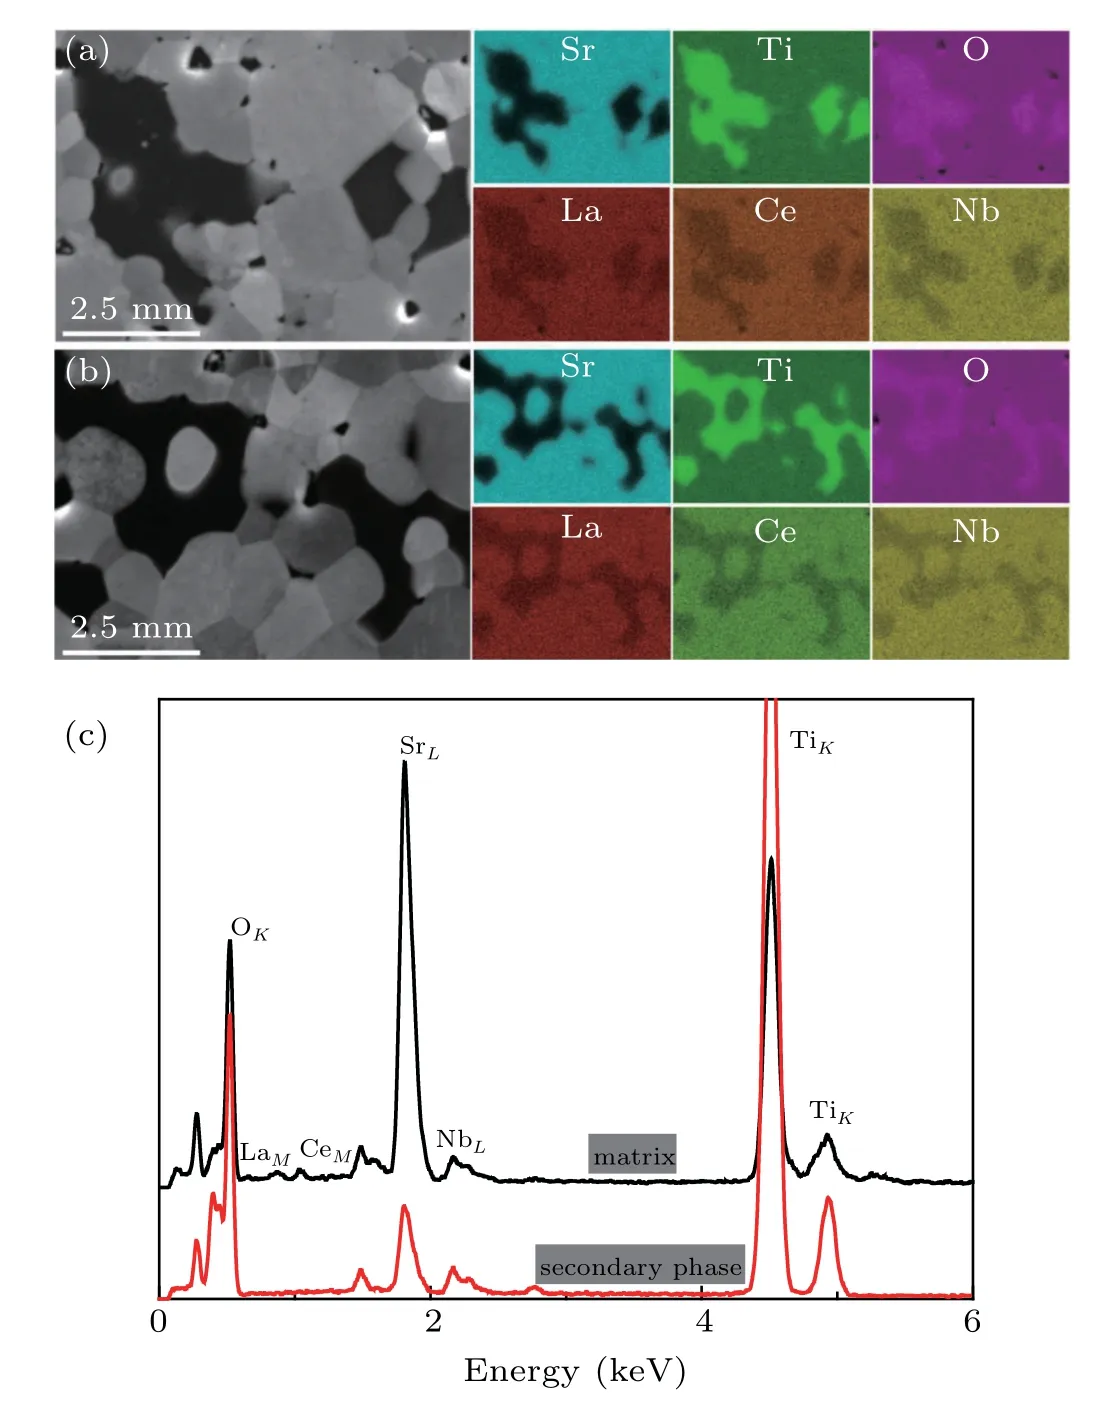
Fig.5.The SEM images and EDS element maps of(a)La3Ce3Nb3 and(b)La5Ce5Nb5,and(c)EDS analysis of La5Ce5Nb5.
The electron back-scatter diffraction(EBSD)analysis showed that a large amount of Ti–O secondary phase was not TiO2and was in-homogeneously distributed in the SrTiO3polycrystalline matrix(Fig.6).The HRTEM and selected electron diffraction pattern(SAED)pattern analysis(Fig.7)indicated that these secondary phases were TinO2n−1.The formation of the TinO2n−1phase likely formed due to mixedvalence titanium cations already in the powder and the oxygen vacancies generated in a reducing atmosphere,which partially transformed Ti4+into Ti3+.[28]Interestingly,some nano/microscale SrTiO3and TinO2n−1grains were included in each other’s large grains,as shown in Fig.7.
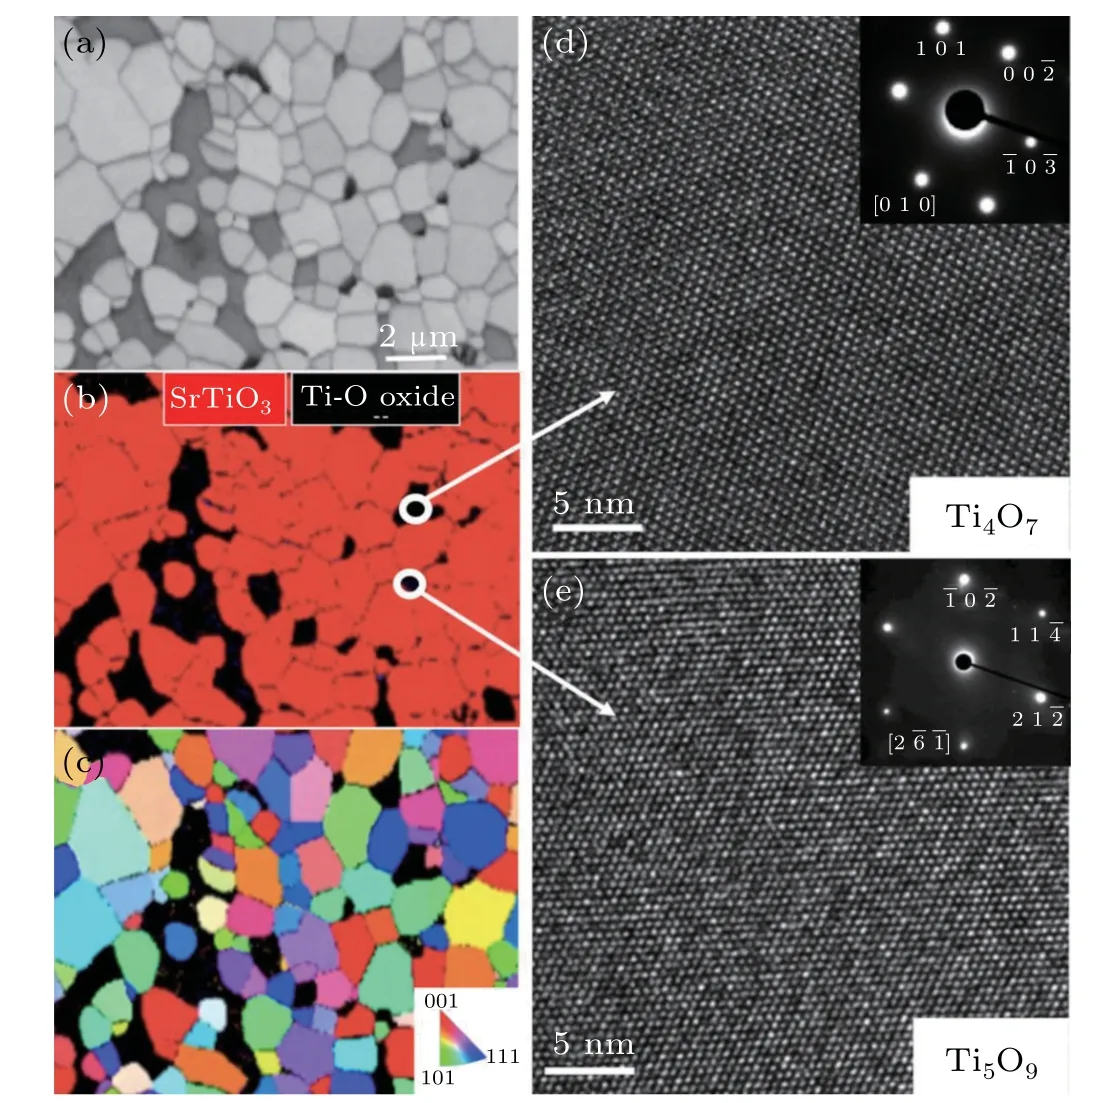
Fig.6.Microstructural analysis of La5Ce5Nb5 bulk sample:(a)electron back-scatter diffraction(EBSD)image,(b)phase mapping,(c)inverse pole figure(IPF)maps,and(d)–(e)HRTEM images of the secondary phases.
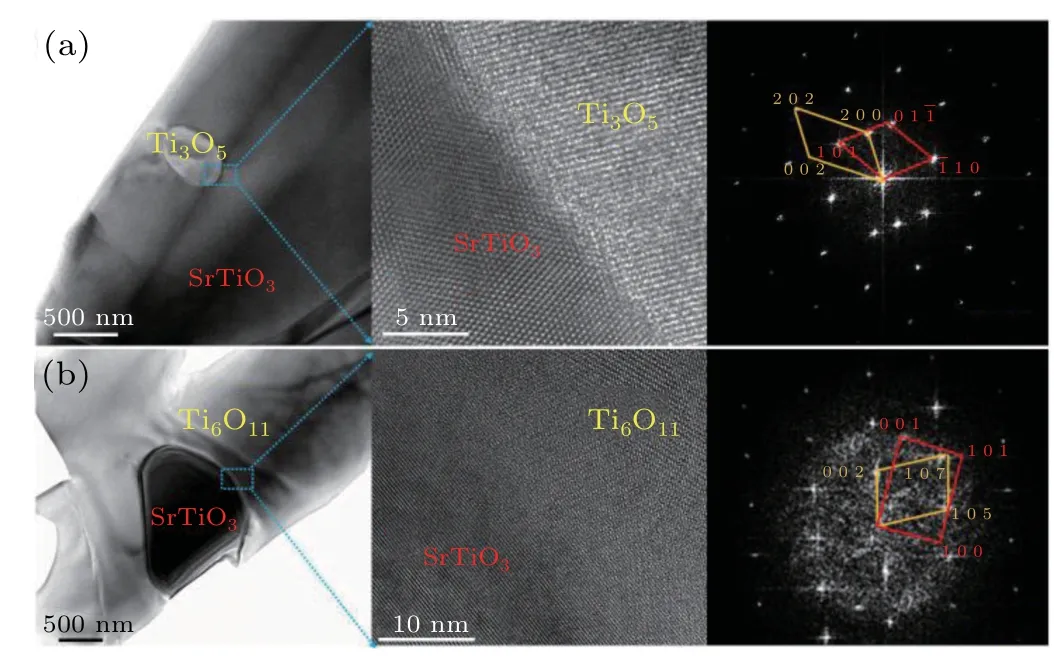
Fig.7.Low and high resolution TEM images,and SAED pattern of TinO2n−1/SrTiO3 interfaces.(a)SrTiO3 grain with TinO2n−1 inclusions,(b)TinO2n−1 grain with SrTiO3 inclusions.
The SAED patterns show that the[2 0 2]of TinO2n−1inclusions and[1 0–1]of host SrTiO3grains have the same orientation,showing a coherent relationship(Fig.7(a)),to form an epitaxial-like heterostructure,which reduced the thermal conductivity due to phonon scattering at the interface without reducing the electrical conductivity.[29–31]In addition,the SrTiO3inclusions smoothly connected with the TinO2n−1host grains(Fig.7(b)),which also contributed to the phonon scattering with less electron scattering.
3.3.Electrical and thermal transport properties
The measured electrical transport properties as a function of temperature are shown in Fig.8.The electrical conductivity increased until 420 K–470 K and then began to decrease above this temperature range,consistent with Nb-doped and La–Nb co-doped samples.[17,32,33]The lowest electrical conductivity of 23 S·cm−1in sample Ce3was obtained at 1000 K,which increased upon increasing the dopant concentration to 247 S·cm−1in sample La5Ce5Nb5.This again indicated successful lattice doping.The electrical conductivity of a material can be estimated by the formulaσ=neµ,where n,e,andµare the carrier concentration,electronic charge,and carrier mobility,respectively.The Hall carrier concentrations of all samples were constant over the entire measured temperature range,indicating that all free electrons were injected into the conduction band,and no thermal activation of intrinsic carriers occurred within this temperature range.
The mobilities of all samples showed a temperature dependence that was similar to the electrical conductivity,which increased with temperature up to 400 K–450 K and then decreased above this temperature.These trends are related to the dominant scattering of ionized impurities and phonons at low and high temperatures,respectively.[26]The sample mobility increased with increasing carrier concentration,which is consistent with the grain size trend.Usually,the carrier mobility(µ),which is determined by the effective mass(m∗),and relaxation time(τ),is proportional to the electron mean free pass(l),are expressed as follows:
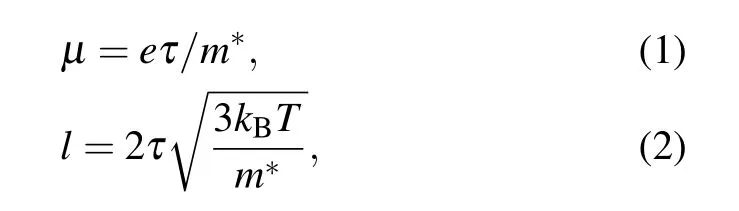
where kB,T,and e are the Boltzmann constant,absolute temperature,and electron charge,respectively.[34]The reduced effective mass and increased grain size at higher doping concentrations increased the electron mean free path,which is expected to enhance the mobility,resulting in a largeσin La5Ce5Nb5.
Since the second phase was a Magneli-phase,which has a high electrical conductivity,[35–37]the higher amount of second phase did not significantly affect the electrical conductivity of La3Ce3Nb3and La5Ce5Nb5.The mosaic crystal structure and the epitaxial-like relationship between nano/microscale inclusions and the corresponding host grain also contributed to the electronic transitions at interfaces.[38]
Figure 9(a)shows the temperature dependence of the Seebeck coefficient.A maximum Seebeck coefficient of 344µV·K−1was obtained in Ce3,which decreased to 207µV·K−1at 1000 K upon increasing doping concentration in La5Ce5Nb5.As shown in Fig.9(b),in contrast with the electrical conductivity,the Seebeck coefficient decreased upon increasing the dopant concentration,suggesting that|S|decreased as n increased.This trend complies with the relationship between S and n,
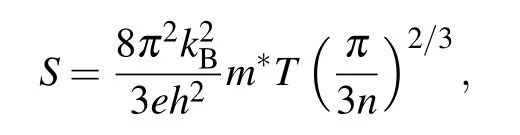
where kBis the Boltzmann constant,m∗is the carrier’s effective mass,n is the electron concentration,and T is the absolute temperature.
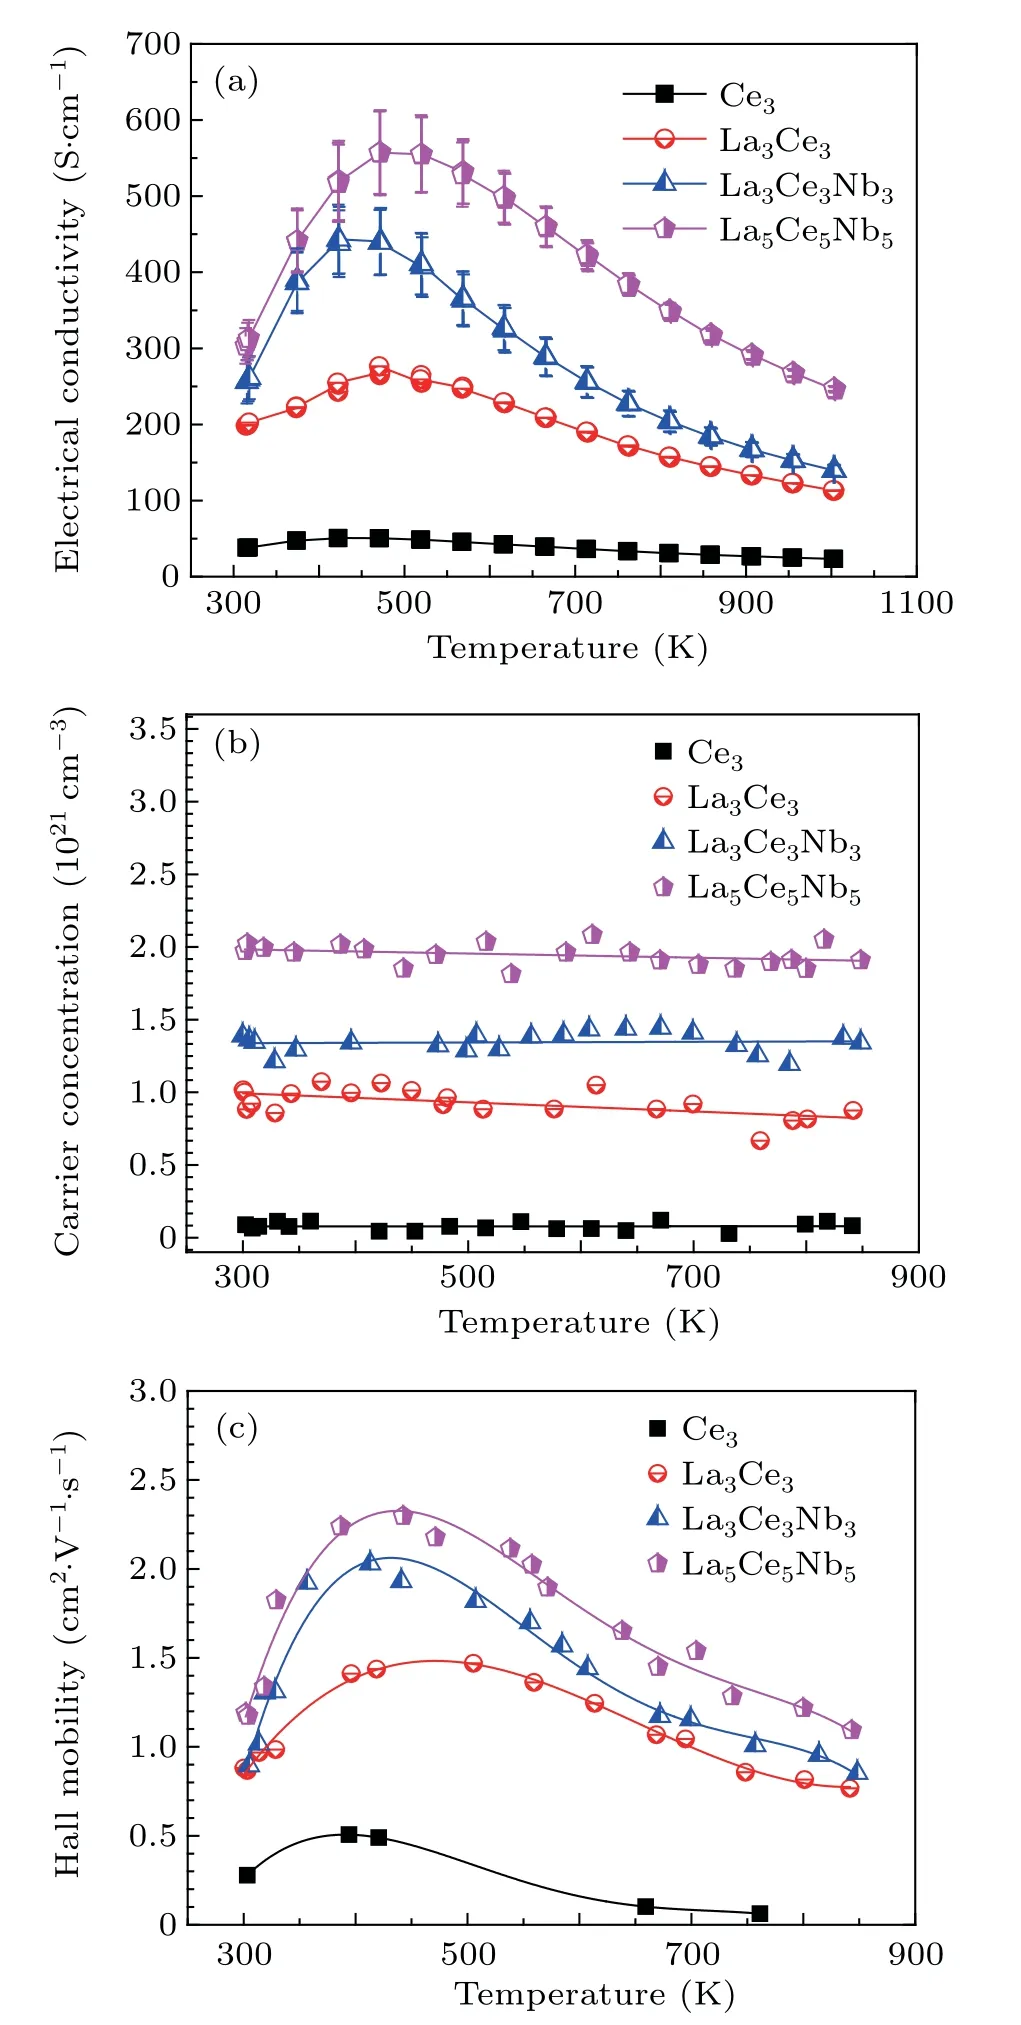
Fig.8.Temperature-dependent electrical conductivity(a),carrier concentration(b),and mobility(c)of La–Ce–Nb doped SrTiO3.
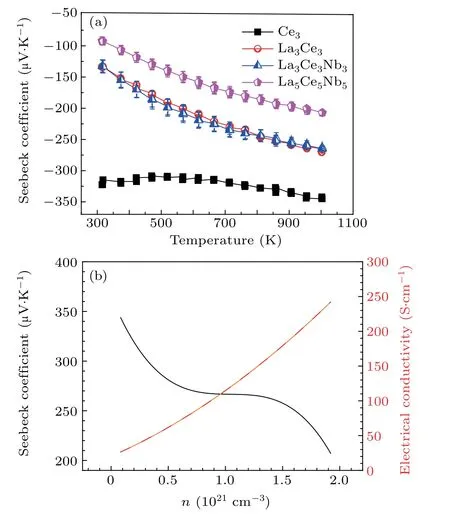
Fig.9.Variation of the(a)Seebeck coefficient as a function of temperature,and(b)Seebeck coefficient together with electrical conductivity as a function of carrier concentration.
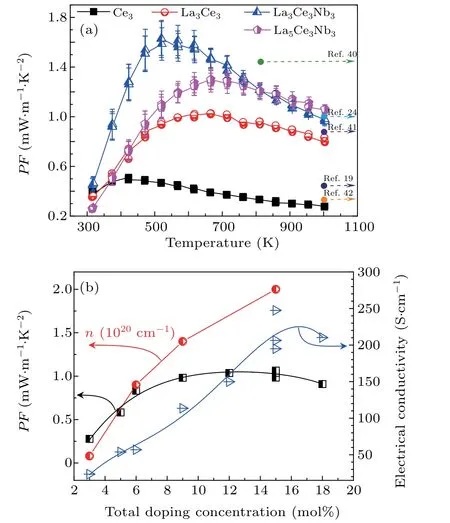
Fig.10.Variation of(a)the power factor PF as a function of temperature together with PF reported previously,and(b)PF,carrier concentration,and electrical conductivity as a function of doping concentration.
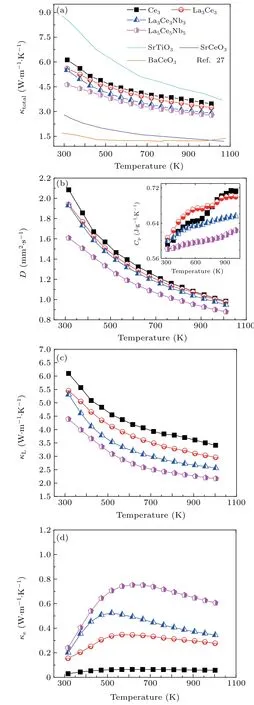
Fig.11.Temperature dependence of(a)total thermal conductivity(κtotal),(b)thermal diffusivity(D)and specific heat(inset),(c)lattice thermal conductivity(κL),and(d)electrical thermal conductivity(κe)for present study together with thermal conductivity of SrTiO3,SrCeO3,and BaCeO3 from Ref.[27].
The Seebeck coefficient only slightly varied between samples La3Ce3and La3Ce3Nb3,even though sample La3Ce3Nb3contained more dopant(3-mol% Nb).This indicates that the enhancement effect of Nb on the effective mass produced a large Seebeck coefficient.[39]As shown in Fig.10(a),the maximum power factor of 1.6 mW·m−1·K2was obtained for La3Ce3Nb3at 529 K,which decreased to 0.96 mW·m−1·K2when the temperature increased to 1000 K.At 1000 K,sample La5Ce5Nb5showed the largest PF of 1.1 mW·m−1·K2,due to its high electrical conductivity,arising from its high carrier concentration and large carrier mobility.The PF values of this work are not significantly different from those of Nb and La-doped SrTiO3previously reported,[19,24,40–42]indicating that Ce did not significantly affect the PF.Because heavy doping promotes second phase precipitation,[17,26,33]the electrical conductivity decreased as the dopant ratio increased to over 15 mol%.This reduced the PF,as shown in Fig.10(b).The doping concentration dependence on carrier concentration measured from 3 mol% to 15 mol%varied nonlinearly,which again demonstrates that the second phase increased with increasing doping concentration(Fig.10(b)).
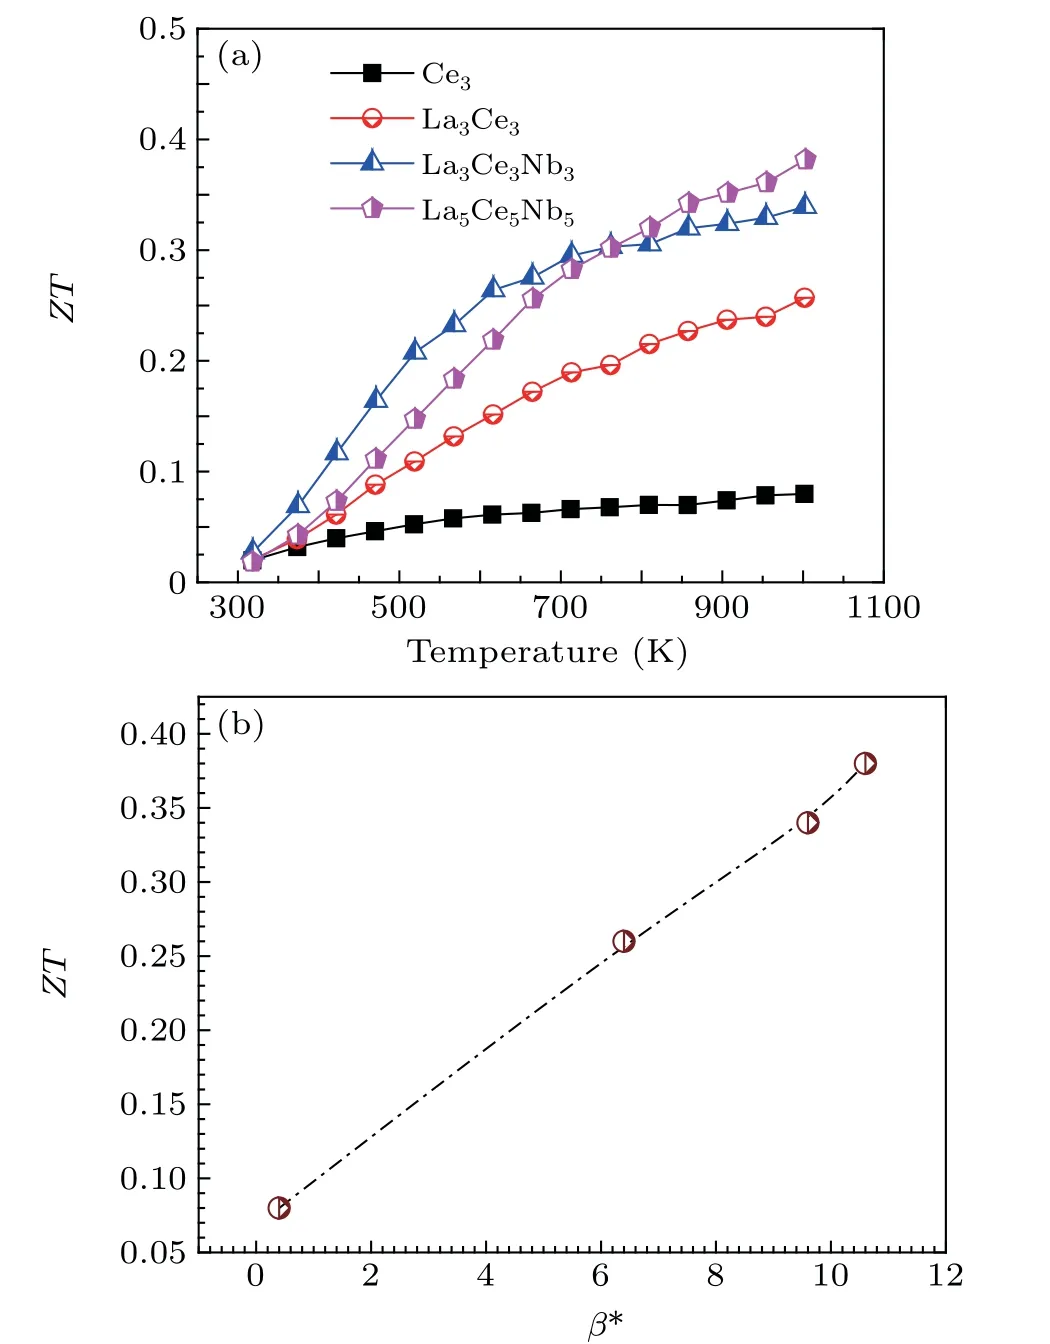
Fig.12.The ZT as a function of(a)temperature and(b)β∗factor.
Figure 11 shows the temperature dependence of the thermal transport properties.The total thermal conductivity decreased to a minimum of 2.77 W·m−1·K−1upon increasing the doping concentration in La5Ce5Nb5.Although the value is still larger than that of SrCeO3,and BaCeO3,but lower than pure or La–Nb doped SrTiO3,[17,26]suggesting that the Ce reduced the thermal conductivity.Such a low thermal conductivity may be related to the multiscale architecture with three dopants,nano-inclusions and nano/microsized grains.[43]The thermal diffusivity and lattice thermal conductivity showed the same trend asκtotal,suggesting that the two factors were dominant forκtotal.Compared withκtotal,κLshowed a greater decrease as the doping concentration increased,implying that the dopant,lattice distortion,and multiscale interfaces produced a strong phonon scattering.The low lattice thermal conductivity and relatively large effective mass,together with a higher carrier mobility,produced a large β∗=µ(m∗/m)3/2/κL,which increased with increasing doping concentration up to 15 mol%.The ZT value increased with the increasingβ∗factor,leading to a maximum ZT of around 0.38 at 1000 K with a maximumβ∗factor of 10.6 in the La5Ce5Nb5sample(Fig.12).
4.Conclusion
In this work,we investigated the microstructure and thermoelectric properties of La,Ce,and Nb-doped SrTiO3.A powder with an average size of 20 nm was obtained using a hydrothermal method,and then La,Ce,and Nb were incorporated into SrTiO3.The crystal grains grew abnormally during sintering and formed a complex microstructure.Co-doping with the three elements and the formation of multi-scale grain boundaries helped improve phonon scattering,which greatly decreased the lattice thermal conductivity to 2.17 W·m−1·K−1at 1000 K.The maximum ZT of 0.38 is one of the highest values reported for SrTiO3,which provides a reference for future research on n-type oxide thermoelectric materials.
Acknowledgements
Thanks Yanzhong Pei,Hongxia Liu from Tongji University for valuable discussion and support provided for the Hall effect measurements.Financial supports are given in the footnote on the first page.
猜你喜欢
杂志排行
Chinese Physics B的其它文章
- Multiple solutions and hysteresis in the flows driven by surface with antisymmetric velocity profile∗
- Magnetization relaxation of uniaxial anisotropic ferromagnetic particles with linear reaction dynamics driven by DC/AC magnetic field∗
- Influences of spin–orbit interaction on quantum speed limit and entanglement of spin qubits in coupled quantum dots
- Quantum multicast schemes of different quantum states via non-maximally entangled channels with multiparty involvement∗
- Magnetic and electronic properties of two-dimensional metal-organic frameworks TM3(C2NH)12*
- Preparation of a two-state mixture of ultracold fermionic atoms with balanced population subject to the unstable magnetic field∗