Spectral filtering of dual lasers with a high-finesse length-tunable cavity for rubidium atom Rydberg excitation*
2021-07-30YangYangLiu刘杨洋ZhuoFu付卓PengXu许鹏
Yang-Yang Liu(刘杨洋) Zhuo Fu(付卓) Peng Xu(许鹏)
Xiao-Dong He(何晓东)1, Jin Wang(王谨)1, and Ming-Sheng Zhan(詹明生)1,‡
1State Key Laboratory of Magnetic Resonance and Atomic and Molecular Physics,Innovation Academy for Precision Measurement Science and Technology,Chinese Academy of Sciences,Wuhan 430071,China
2University of Chinese Academy of Sciences,Beijing 100049,China
Keywords: laser frequency stabilization,spectral filtering,Rydberg state,rubidium atom
1. Introduction
There are many different candidates for quantum information processing platforms, including trapped ions,[1,2]superconducting circuits,[3,4]linear optics,[5,6]and so on.Besides, the trapped neutral atom is also considered as a promising one because of its good scalability, long coherence time,and it is insensitive to ambient electromagnetic field environment.[7]One of the major challenges for neutral atom platform is to realize high fidelity two-qubit quantum gates.In the last two decades, many research groups have demonstrated two-qubit gates and two-atom entanglements based on the Rydberg dipolar interactions. All these protocols include atoms being coherently excited between the ground state and the Rydberg states using one or two photons transitions,which require the Rydberg excitation lasers to be narrow linewidth and frequency stabilized to several kHz.[8-10]Even when these requirements for lasers are met, progress in implementation of high-fidelity two-qubit gates had been limited. Until recently, it is found that the high-frequency phase noise of Rydberg excitation lasers degrades the Rabi oscillation between the ground state and Rydberg state, and it is one of the main factors to handicap the improvement of the fidelity of twoqubit gates.[11]Moreover,the laser phase noise induces decoherence as atoms are prepared in the ground-Rydberg superposition state, even when the atoms are cooled down to the vibrational state of the dipole trap where the laser phase noise has less effect on the Rabi oscillations.[12]Thus,obtaining the laser sources of narrow linewidth, low phase noise, and stable frequency is essential for neutral atom quantum computing and quantum simulation.
A straightforward way to eliminate the influence of phase noise is to use the lasers with a narrow linewidth and low phase noise for Rydberg excitation. However,the two-photon scheme is often applied to excite the87Rb atoms from ground state to Rydberg state with 780-nm laser and 480-nm lasers.Most of these lasers have limited wavelengths which do not fulfill the requirement of Rydberg excitation, such as the 1-kHz linewidth diode pumped solid state lasers (DPSS lasers)usually have infrared wavelengths of 1560-nm or 1064-nm laser. A prevailing method to suppress laser phase noise is to lock the diode lasers to a high-finesse Fabry-P´erot cavity with ultra-low expansion (ULE) substrate to stabilize the laser frequency and to suppress the laser linewidth by PDH method,[13]then to use the transmitted laser of the cavity for injection locking which utilizes the high finesse cavity for spectral filtering.[14-16]The method was firstly demonstrated in atomic interferometer,[16]and then applied to trapped ion system.[14,15]Nevertheless, several concerns need to be addressed when this method is applied for Rydberg excitation lasers. First, the finesse should be high enough to suppress high-frequency phase noise. Lukin’s group recently used a cavity with a finesse of 3000 to filter the phase noise of Rydberg lasers,and phase noise around 1 MHz was suppressed by a factor of about 16.[17]Although the Rabi oscillation between the ground and Rydberg state of the single-atoms has been significantly improved, authors admit that there is still residual phase noise which contributes to the dephasing of qubit.[17]Hence a higher finesse cavity is needed. Second, the power of the transmitted laser of the cavity has a trade-off between higher power for stable injection locking and lower power for possible heating of the cavity. This trade-off is subtle because the absorption of the high finesse cavity varies dramatically for different setups while there is a minimum threshold power for stable injection locking depending on the reflectivity of laser diode facet and output power.[18]As in the trapped ion system,researchers used a high-finesse cavity to suppress the phase noise at three orders of magnitude reduction in the noise spectral power density around the 1-MHz servo-bumps.[14]But they obtained a cavity transmitted light with only a maximum of 10 μW for injection locking because the intensity of the light sent to the cavity is limited to prevent substantial thermal effects on the cavity mirrors.[14]Third,the ULE cavity should be stable enough to stabilize the laser frequency. The ULE cavity should be optimized close to the zero-crossing of the linear coefficient of thermal expansion(CTE)temperature for better long-term frequency stability,and be isolated from ambient vibrations.[19]Also, the average linear frequency drift caused by the creep of the spacer or outgassing in the ULE cavity vacuum should be considered in a real experiment.[20]
Considering all these requirements, we propose and demonstrate an alternative method for spectral filtering and frequency stabilization of a laser using an HFLTC.Firstly,the length of HFLTC is stabilized to a commercial frequency reference. Then, two lasers of different wavelength are locked to this HFLTC using the Pound-Drever-Hall (PDH) method which can both narrow the laser linewidths and stabilize the frequencies. Finally, the transmitted lasers of HFLTC with each power up to about 100 μW are amplified using the injection locking method. With the HFLTC finesse of~105for both 780-nm and 960-nm lasers, the linewidths of obtained lasers are narrowed to<1 kHz, meanwhile the laser phase noises around 750 kHz are suppressed about 30 dB.Comparing with Ref. [14], we obtain more HFLTC transmitted seed laser for injection locking and suppress the thermal expansion of HFLTC at the same time.Using the spectrally filtered lights,a Rabi oscillation of 1/e decay time of(68±31)μs is demonstrated,which is almost not affected by lasers’phase noise.By characterizing Rydberg excitation,we conclude that the maximum short-term frequency fluctuation of a single excitation lasers is about 3.3 kHz,and the maximum long-term frequency drift for a single laser during one month is~46 kHz.Comparing with other results for suppressing high-frequency noises,we show a strong noise suppression while long-term frequency stability is guaranteed. Our results show that it is possible to get a kind of light source which has a narrow linewidth, low high-frequency phase noise, and excellent frequency stability at the same time.
2. Experimental setup of spectral filtering and frequency stabilization
A schematic overview of the setup is illustrated in Fig.1.The main components include an HFLTC,a commercial 1064-nm laser as a frequency reference, a 780-nm master laser, a 960-nm master laser,a 780-nm slave laser,and a 960-nm slave laser. The HFLTC is customized from Stable Laser System,which is composed of a ULE spacer, a piezoelectric transducer (PZT), and two concave mirrors. The concave mirrors are simultaneously coated with the different reflective films for wavelengths of 1064 nm, 780 nm, and 960 nm. The finesses of HFLTC for the three wavelengths are respectively(86.6±0.9)×103at 1064 nm,(91.9±0.9)×103at 780 nm,and(58.8±0.9)×103at 960 nm,which are measured by cavity ring-down method.[21]The length of the HFLTC is 100-mm meaning that the free spectral range(FSR)νfsris 1.5 GHz.The resonance frequency of the HFLTC can be tuned across an FSR by varying the voltage on the PZT from 0 V to 75 V.To minimize the influence of temperature fluctuations and vibrations,the HFLTC is mounted in a thermally controlled vacuum chamber on a vibration isolation stage. The temperature drift of HFTLC is smaller than 5 mK/1°C after temperature stabilization.
We stabilize the length of HFLTC to a commercial Iodinefrequency stabilized 1064-nm laser which consists of two units,a YAG laser(Prometheus,Coherent)and an iodine frequency stabilization unit (Innonlight, Coherent). The typical frequency drift of the commercial 1064-nm laser is less than 1 kHz/0.5°C,and the relative Allan deviation is at the 10-13level at dozens of seconds. The standard PDH method is applied to stabilize the length of HFLTC to the 1064-nm laser,and the feedback loop scheme[13]is seen in Fig. 1(a). The power of the 1064-nm incident laser is about 60 μW,which is stabilized to 1% via an acousto-optic modulator (AOM).The scheme of power stabilization is not indicated here for simplicity. A homemade electro-optical modulator (EOM) with a 5.48-MHz modulation frequency is used to modulate the phase of the 1064-nm mater laser and then the HFLTC reflected laser beam is frequency mixed with a local oscillator to generate a standard PDH error signal. The error signal passes through a low-pass filter and then is sent to a proportionalintegral-differential (PID) controller (New Focus, LB1005).And the PID controller sends the feedback signal to the PZT of HFLTC. In this way, we stabilize the length of HFLTC to commercial frequency reference.
Secondly,the 780-nm master laser is frequency stabilized to HFLTC by the PDH method, and the feedback loops are seen in Fig.1(b)upper half part. The 780-nm master laser is an external-cavity diode laser (Toptica DL pro) with a freerunning linewidth less than 50 kHz. The same as the stabilization loop of HFLTC stabilization,the PDH error signal of 780-nm master laser is got from the phase-modulated reflected beam of HFLTC but the feedback signals are fed back into the current modulation modules of the 780-nm master laser. The power of the 780-nm incident laser of HFLTC is 500 μW and we get 100 μW transmitted light when it is resonant with the HFLTC.At 780 nm and 960 nm,the power of damage threshold of the cavity mirror coating is 5×10⁶watts corresponding to the power of damage threshold of incident laser on the order of dozens of microwatt. Therefore,the incident laser on the order of several hundred microwatts will not cause damage to the cavity mirror but will cause substantial thermal expansion of the cavity. The 780-nm transmitted laser of HFLTC is fiber-coupled to the injection locking part,as seen in Fig.1(c).Two optical isolators are used to separate the injection laser beams from the output laser beams of slave lasers. After coming out of the fiber, the 780-nm transmitted laser beam is injected into the 780-nm slave laser for injection locking. The 780-nm slave laser diode (Eagleyard Inc, EYP-RWE-0790-02000-1500-SOT02-0000) is an anti-reflection coating laser diode with a transmittance of 99.95% which is according to the requirement of the stability of injection locking and the output power of slave laser diodes. For 780-nm slave laser,the high transmittance means that the power threshold of injection laser for stable locking is small.[18]The high transmittance also results in the output power being heavily dependent on the power of the injected laser. With 60-μW injection laser,the 780-nm slave laser generates 14-mW output laser which is enough to drive Rydberg transition. This power of injection laser is sufficient for a stable operation of the 780-nm slave laser with an injected current window of 4 mA.

Fig.1. Experimental setup of spectral filtering and frequency stabilization. (a)Setup for stabilizing the length of HFLTC to a 1064-nm laser. (b)Setup for stabilizing 780-nm master laser and 960-nm master laser to the length of HFLTC. (c) Setup for injection locking. Two slave lasers are injection locked to the HFLTC transmitted lasers,respectively.
Finally, the 960-nm master laser is frequency stabilized to HFLTC by the PDH method, and the feedback loops are seen in Fig. 1(b) half bottom part. The 960-nm master laser is one part of a Toptica TA-SHG pro,and another part of TASHG pro is a second-harmonic-generation cavity to generate 480-nm laser. The free-running linewidth of the 960-nm master laser is less than 100 kHz. The error signal is got from the phase-modulated reflected beam of HFLTC and the feedback signals are fed back into the current modulation modules of the 960-nm master laser.The details of PDH methods in our setup can be referred to in our previous work.[22]The power of 960-nm HFLTC incident light is 600 μW and we get 90-μW transmitted light when it is resonant with the HFLTC.After coming out of the fiber, the 960-nm transmitted light is injected into the 960-nm slave laser for injection locking, as indicated in Fig.1(c). The 960-nm slave laser diode(Sheaumann Inc,M9-980-0150-D5P) is an anti-reflection coating laser diode with a transmittance of 99.5%. For 960-nm laser, the power requirement is much higher than 780-nm laser in Rydberg excitation. To obtain more output power and stable injection locking,the transmittance of 960-nm slave laser diode should be smaller than 780-nm slave laser diode.[18]After injection locking with 40-μW injection light, the 960-nm slave laser generates an output power of laser with 40 mW. This power of injection laser is sufficient for a stable operation of the 960-nm slave laser with an injected current window of 0.5 mA.This smaller injected current window is because of the smaller transmittance of 960-nm slave laser diode facet.[18]The output laser is sent to a tapered amplifier to amplify the power to 900 mW,and the power amplified laser passes through a second harmonic generation crystal to generate 480-nm laser with a power of about 300 mW.
3. Results and discussion
3.1. Laser linewidth and laser phase noise
After we realize the frequency stabilization and spectral filtering of two excitation lasers, we turn to characterize the linewidths of frequency stabilized lasers. There are several methods to deduce linewidth of laser, including heterodyne beat measurement of two identical laser sources,[23]timedomain measurement of the frequency Allan deviation,[24]and delayed self-heterodyne interferometer (DSHI).[25-27]Due to limited conditions in our laboratory, we choose the delayed self-heterodyne interferometer method to measure the linewidths of lasers. In principle,the delayed self-heterodyne measurement requires that the delay timeτdof light in a long fiber should be greater than the laser coherence time. Thus,the measurement of linewidth at the 1-kHz level requires a delay fiber with a length of over 300 km. The light attenuation through such a long fiber is so severe that the selfheterodyne beat signals cannot be obtained. Alternatively, a self-heterodyne measurement with a short delay fiber is applied to measure the linewidths. From Huanget al.,[27]the Lorentzian linewidth caused by the white noise of the laser can be also got from the DSHI power spectrum with a short delay fiber.
In our experimental setup, the delayed self-heterodyne measurements are performed using a 1.1-km multimode fiber for 780 nm and a 5.5-km multimode fiber for 960 nm(refractive indexn=1.48),with a corresponding delay time of aboutτ1.1km=5.4 μs andτ5.5km=27 μs. We use a shorter fiber for measuring the 780-nm laser linewidth because the attenuation of the 780-nm laser in the 5.5-km fiber reaches as at-47 dB.An AOM is applied to obtain a beat signal between the original and the delayed field,centered at 80 MHz. The output power spectrum density(PSD)of the DSHI can be given by[27]
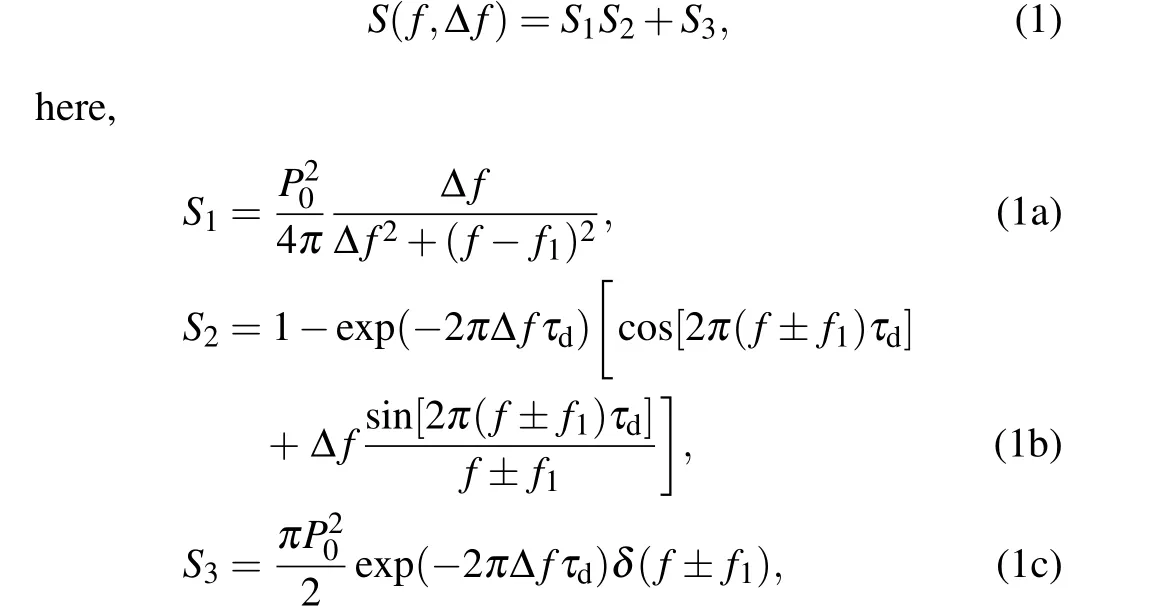
wherefis the measurement frequency,f1is the AOM frequency shift, andτd(τd=L/c,Lis the length of delayed fiber andcis the speed of light)is the time delay of one path with respect to the other path. And Δfis the full width at half maxima (FWHM) of the power spectrum and in fact the line-width of laser. From the theoretical analysis in Ref.[27],the amplitude difference of the coherent envelope is a fixed value once the fiber delayed length and the laser line-width are determined. So the laser line-width could be measured by comparing the contrast difference between the second peak and the second trough(CDSPST)of the coherent envelope of the noise spectrum of the delayed self-heterodyne signal. The self-heterodyne spectrums of the 780-nm master laser (blue curve) and 780-nm slave laser (red curve) are indicated in Fig.2(a). From Fig.2(a),the CDSPST of 780-nm master laser is about 19 dB corresponding to a 900-Hz linewidth, and the CDSPST of 780-nm slave laser is about 16 dB corresponding to a 1.1-kHz linewidth. The linewidth of 780-nm lasers is not so accurate because the length of fiber for 780-nm is too short and leads to an inaccurate coherent envelope.[22]The selfheterodyne spectrums of the 960-nm master laser(blue curve)and 960-nm slave laser(red curve)are indicated in Fig.2(b).From Fig.2(b),The CDSPST of 960-nm master laser is about 20 dB corresponding to a 200-Hz linewidth,and the CDSPST of 960-nm slave laser is about 19 dB corresponding to a 300-Hz linewidth. We contribute the broadening of the linewidth of slave lasers to noises in injection locking.
On the other hand,the beat signals also reflect the spectral characteristics of lasers. From Eq.(1a),the PSD of DHSI can be divided into two parts. One part is the oscillating part with the Lorentz profileS1S2, we call this part the envelope PSD;the other part is a Dirac delta functionS3. From our previous work,[28]the frequency noise PSD can be estimated by the envelope PSD using a so-called envelope-ratio method, and the frequency noise PSD of laser is related to the envelope PSD by the envelop-ratio factor 1/He(f).By measuring the PSD of DHSI in different frequency span and calculating the envelopratio factor 1/He(f), we could estimate the frequency noise PSD of all lasers,which are indicated in Fig.2(c)and Fig.2(d).For 780-nm master laserSν=24814 Hz2/Hz at 750 kHz and for 780-nm slave laserSν=4 Hz2/Hz at 750 kHz. For 960-nm master laserSν=5425 Hz2/Hz at 700 kHz and for 960-nm slave laserSν=5 Hz2/Hz at 700 kHz. Therefore, the phase noises are suppressed about 30 dB around 750 kHz after spectral filtering.Because the PSD of DHSI of slave lasers are limited by PD noise floor(indicated as olive lines in Figs.2(a)and 2(b)), in fact, the phase noises are suppressed more severely than we measured.

Fig. 2. The beat signals and frequency noise PSDs of 780-nm lasers and 960-nm lasers. (a) The blue curve is the beat signal of the 780-nm master laser, and the red curve is the beat signal of the 780-nm slave laser. The olive line is the detection noise floor, which limits the detected signals. The video bandwidth(VBW)of signal analyzer is 3 kHz and resolution bandwidth(RBW)of signal analyzer is 100 Hz when measuring the beat signals.(b)The beat signals of 960-nm master laser and slave laser. The blue curve is the beat signal of the 960-nm master laser,and the red curve is the beat signal of the 960-nm slave laser. The VBW of signal analyzer is 3 kHz and RBW of signal analyzer is 100 Hz when measuring the beat signals. (c)The calculated frequency noise PSD of 780-nm master laser and 780-nm slave laser. (d)The calculated frequency noise PSD of 960-nm master laser and 960-nm slave laser.
3.2. Application to Rydberg excitation of single rubidium atom
In this section, we apply the 780-nm laser and 480-nm laser to drive two-photon transition from|g〉=|5S1/2,F=2,mF=0〉to|r〉=|79D5/2,mj=5/2〉of87Rb atom. The method for single-atom’s preparation in an optical tweezer can be found in our previous work.[10]A linear polarized 830-nm laser is strongly focused to form an optical dipole trap with a beam waist of 1.2 μm using a high numerical aperture (NA)lens. Single87Rb atoms are loaded from a magneto-optical trap(MOT)into this dipole trap of 0.6-mK trap depth. Then,a bias magnetic field of 3 Gs(1 Gs=10-4T)is applied to define the quantization axis and we prepare87Rb atoms into|g〉by optical pumping with the efficiency>99%. After87Rb atoms are prepared in|g〉, we apply 780-nm laser and 480-nm laser to couple the|g〉and|r〉through a intermediate level|p〉=|5P3/2〉,and the energy scheme is indicated in Fig.3(a).The single photon detuning of 780-nm laser is-5700 MHz.The method of detecting Rydberg atoms is based on the photon ionization and repulsion induced by dipole trap light which has negative polarizability for atoms in the Rydberg state.And the detection efficiency is measured to be about 90%. To measure Rabi oscillations, we keep 480-nm laser on during the excitation process and scan the 780-nm laser pulse duration to excite87Rb atoms. And we obtain the experimental results(black solid circle points),as indicated in Fig.3(b). The fitted 1/e decay time of Rabi is (67±37) μs, and the large uncertainty of decay time is caused by the measurement error when determining such a long decay time on the order of 67 μs by data points on 7-μs time scale. Besides, using the method of Ref. [10] we estimate that the single-photon Rabi frequencies to beΩr=2π×210 MHz for 780-nm laser andΩb=2π×50 MHz for 480-nm laser for this experiment.
The contributions to the decay of Rabi oscillation between|g〉and|r〉may come from the phase noise of the excitation lasers, single-photon Rabi frequency fluctuation,Doppler shift caused by the atoms’ residual thermal motion,off-resonant scattering from the intermediate level|p〉, finite Rydberg state lifetime,and so on. We build a four-level model for atoms to simulate the Rabi oscillation using Qutip,[29]similar to the method of Ref. [11]. In this model, the Rydberg lifetime is included by introduing a decay channel from|r〉to|g′〉with rate ofΓr, whereΓr=2π×1 kHz is the natural linewidth of|r〉. The off-resonant scattering from the intermediate level|p〉is included in this model by introducing an extra decay channel from|p〉to another ground state|g′〉with rate of 4Γp/5,whereΓp=2π×6.6 MHz is the natural linewidth of|p〉.The temperature of atoms in our setup is 5.2 μK measured by release and recapture method.[30]And the Doppler shift is included as a random detuningδDfrom a Gaussian distribution of widthδD/(2π)=16 kHz. The single-photon Rabi frequency fluctuation comes from the instability of light intensity and intensity fluctuation induced by the thermal distribution of cold atoms’ motion. We estimate that the total single-photon Rabi frequency deviation of 480-nm laser isσ480=0.35%and that of 780-nm laser isσ780=0.35%,which are also included in this simulation.
Taking all these factors into account,we solve the optical Bloch equations(OBEs)for the density matrixρ

and the simulation result is indicated in Fig.3(b)(red curve).The 1/e decay time of the simulated Rabi oscillation fringe is about 77 μs. We find that the simulation results are in good agreement with the experimental results.Notice that the simulation does not include any laser phase noise,which indicates that the phase noise of excitation laser has little effect on Rabi oscillation.
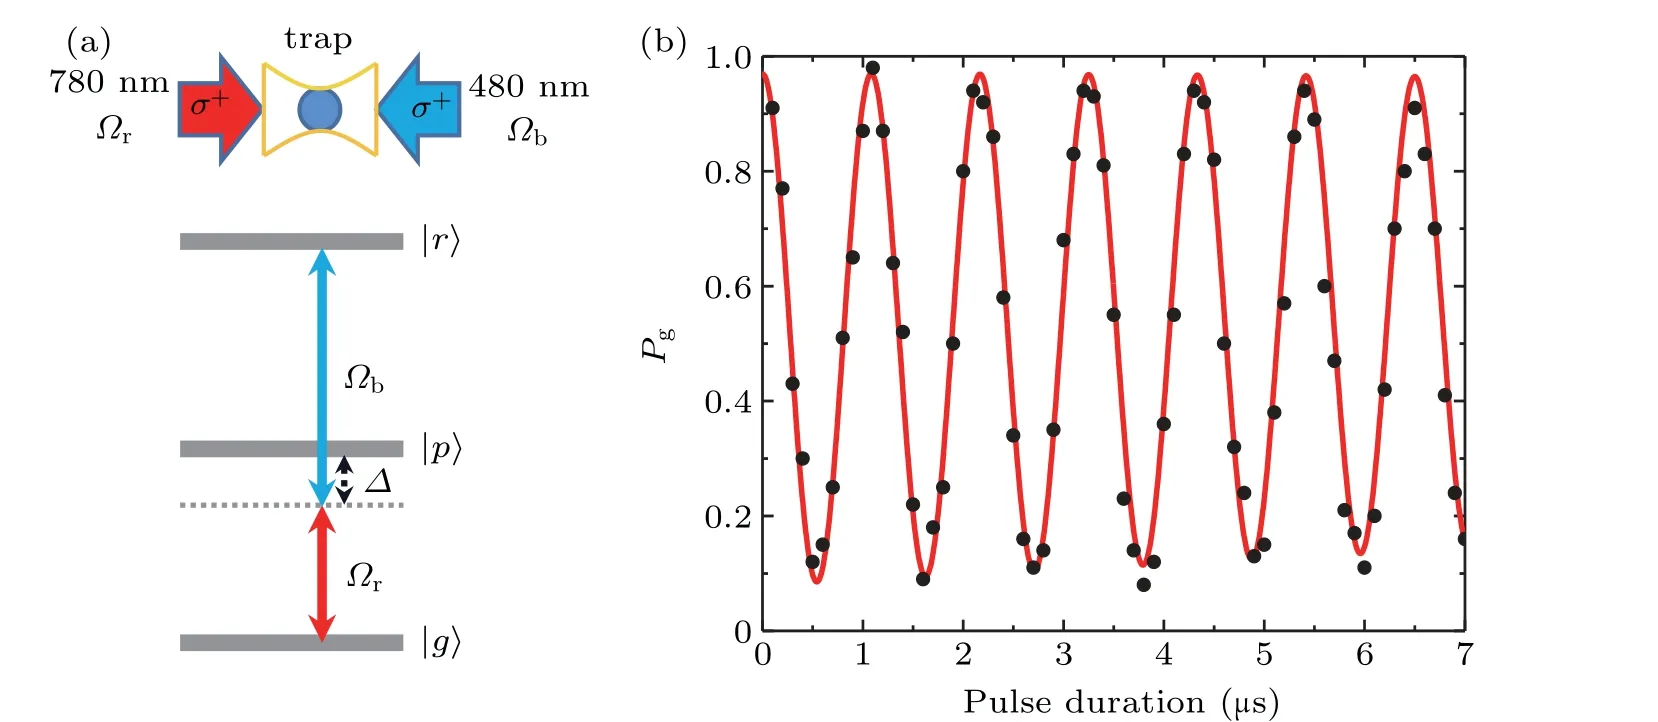
Fig.3. Application to Rydberg excitation. (a)The experimental scheme for Rydberg excitation. The 780-nm laser with σ+polarization and the 960-nm laser with σ+ are applied to excite 87Rb atoms in dipole trap from ground state |g〉 to Rydberg state |r〉 via an intermediate state |p〉. (b) The Rabi oscillation fringe between|g〉and|r〉using spectral filtered lasers. The 1/e decay time of the experimental Rabi oscillation fringe is(67±37)μs,and experimental results (black solid points) are well consistent with the simulation results (red curve). The 1/e decay time of simulated Rabi oscillation fringe is 77 μs.
3.3. Frequency stability
Next,we characterize the frequency stability in three aspects. Firstly, the intro-cavity absorption effect due to manufacturing technology is severe in our experiments for the high power of HFLTC incident laser. This intro-cavity absorption causes substantial thermal expansion of HFLTC,ultimately resulting in the drift of HFLTC length. In our setup,the drift of HFLTC length is suppressed by actively stabilizing the HFLTC length to commercial frequency reference. To illustrate the thermal expansion of the HFLTC more clearly, the feedback voltage on the PZT after the master lasers are stabilized to HFLTC is measured. The change in feedback voltage over time is indicated in Fig. 4(a) (black curve), and we extract a 1/e equilibrium time at about 1000 s. In particular, we measure the transition frequency of|g〉to|r〉during the process of equilibrium,indicated in Fig.4(a)(red square points). The maximum change in transition frequency is on the order of 28 kHz which is almost equal to measurement error,meaning the upper bound of frequency drift in the equilibrium process is about~28 kHz.These results reflect that the HFLTC length is still well stabilized under the condition of severe thermal expansion.
Secondly,the PZT of HFLTC has a resonance frequency of 20 kHz, which may result in short-term fluctuation of HFLTC length on the several μs time scale. We demonstrate short-term frequency fluctuation by measuring the Ramsey fringe between the ground state and Rydberg state. We follow the standard methods of measuring Ramsey fringe by applying twoπ/2 pulses and sweep the gap time between the twoπ/2 pulses. The measured depahsing time isT*2=(8.5±0.7) μs from Ramsey fringe, which is indicated in Fig.4(b). The dephasing is partly explained by thermal Doppler effects. AtT=5.2 μK, the atomic velocity in every single experiment shot rendered as a random detuningδD/(2π)from a Gaussian distribution of width 17 kHz, resulting in a dephasing time of 12.8 μs. Considering the extreme case, we contribute all the residual dephasing to feedback voltage fluctuation,and we get a short-term fluctuation at the order of 8.6 kHz. In our setup,the resonant frequency of the cavity changes by 1 kHz,and the transition frequency changes by about 3.6 kHz. For each laser,the short-term fluctuation of 780-nm laser is about 8.6/3.6×(1064/780) = 3.3 kHz and the short-term fluctuation of 480-nm laser is about 8.6/3.6×(1064/960)×2=5.3 kHz. The factor 2 is due to the fact that the 480-nm laser is generated by frequency doubling 960-nm laser. Hence,the short-term fluctuation of 960-nm laser is about 2.7 kHz.

Fig. 4. Calibration of frequency stability. (a) Calibration of the thermal expansion of HFLTC. The black curve is the feedback voltage on the PZT after the master lasers are stabilized to HFLTC. And the red square data points are measured transition frequency drift during the equilibrium process. (b) A π/2-gap-π/2 pulse sequence is applied to measure Ramsey fringe. The data points are fitted to exponentially decay sine curve with a 1/e decay time of(8.5±0.7) μs. (c) The drift of measured transition frequency for one month and the maximum drift is about 120 kHz and the standard deviation is about 30 kHz. The red line is to guide the eye,and the error bars are the standard deviation from the transition spectrum fitting. All these data points are calculated from 50 or 150 single experiment shots.
Thirdly, to demonstrate the long-term frequency stability of excitation lasers, we measure the long-term drift of the measured transition frequency of|g〉to|r〉for one month. The measured resonance frequency difference is centered around the mean value which is set as the zero relative frequency,with maximum drift at~120 kHz and standard deviation at~30 kHz for one month, as indicated in Fig. 4(c). Hence,the total frequency drift of 780-nm laser and 480-nm laser has a upper bound of 120 kHz. Focus on each single excitation lasers,the frequency drifts of 780-nm lasers have a maximum drift of about 120/3.6×(1064/780) kHz = 46 kHz and the frequency drifts of 480-nm lasers have a maximum drift of about 120/3.6×(1064/960)×2 kHz = 74 kHz. The factor 2 is because the 480-nm laser is generated by frequency doubling 960-nm laser. Hence, the frequency drifts of 960-nm laser have a maximum drift of about 37 kHz. Considering the finesse of 1064 nm is 86600 corresponding to a linewidth ΔfFWHMof 1064-nm transmitted peak is about 17.4 kHz,this sets a frequency instability upper bound.[22]Besides,the longterm drift of the commercial 1064-nm laser is 1 kHz/0.5°C.All these factors result in a typical whole frequency drift for single laser of about 20 kHz assuming a temperature drift of 2°C. Even if we stabilize the HFLTC length to the commercial frequency reference,there is still some residual frequency drift about 20 kHz that has not been eliminated. However,this result is pretty well when comparing the long-term drift of a general cavity without active feedback on the order of several MHz/day.[20]
4. Conclusion
In conclusion, we have obtained 780-nm and 960-nm lasers which have narrow linewidth, low phase noises, and better frequency stability at the same time. Besides, due to PDH stabilization, the linewidth of 780-nm laser is narrowed to 1.1 kHz and the linewidth of 960-nm laser is narrowed to 300 Hz. At the same time,the measured high-frequency phase noises around 750 kHz from the carrier are suppressed at least 30 dB after spectral filtering. Specially, the HFLTC length is still well stabilized under the condition of severe thermal expansion due to cavity transmitted laser with total power up to 200 μW. Furthermore, we realized the coherent excitation of ground state and Rydberg state using the frequency stabilized 780-nm laser and 480-nm laser. Verified by Rydberg excitation experiments, we conclude that the each frequency short-term fluctuation is at~3.3 kHz for 780-nm laser and~2.7 kHz for 960-nm laser. And the each frequency longterm drift during a month is about 46 kHz for 780-nm laser and 37 kHz for 960-nm laser.
The technique described in this paper can be not only applied in neutral atom quantum information processing[31,32]but also in many other experiments requiring a laser with linewidth on several hundreds of Hertz,ultralow frequency noises,and well frequency stability, such as in trapped ions system,atomic metrology, and atomic clock frequency standard domain where laser with low-frequency noises and long-term frequency stability is required.
杂志排行

Chinese Physics B的其它文章
- Projective representation of D6 group in twisted bilayer graphene*
- Bilayer twisting as a mean to isolate connected flat bands in a kagome lattice through Wigner crystallization*
- Magnon bands in twisted bilayer honeycomb quantum magnets*
- Faraday rotations,ellipticity,and circular dichroism in magneto-optical spectrum of moir´e superlattices*
- Nonlocal advantage of quantum coherence and entanglement of two spins under intrinsic decoherence*
- Universal quantum control based on parametric modulation in superconducting circuits*