Electron density distribution of LiMn2O4 cathode investigated by synchrotron powder x-ray diffraction*
2021-07-30TongtongShang尚彤彤DongdongXiao肖东东QinghuaZhang张庆华XuefengWang王雪锋DongSu苏东andLinGu谷林
Tongtong Shang(尚彤彤) Dongdong Xiao(肖东东) Qinghua Zhang(张庆华)Xuefeng Wang(王雪锋) Dong Su(苏东) and Lin Gu(谷林)
1Beijing National Laboratory for Condensed Matter Physics,Institute of Physics,Chinese Academy of Sciences,Beijing 100190,China
2School of Physical Sciences,University of Chinese Academy of Sciences,Beijing 100049,China
3Songshan Lake Materials Laboratory,Dongguan 523808,China
4Yangtze River Delta Physics Research Center Co. Ltd.,Liyang 213300,China
Keywords: lithium-ion batteries,LiMn2O4,electron density distribution
1. Introduction
Lithium ion batteries (LIBs) with high energy density,low self-discharge, and long cycle life have become the most popular energy storage devices in portable electronics and electric vehicles.[1-3]Among cathode materials, spinel LiMn2O4has the advantages of inexpensive,nontoxicity,and good safety.[4,5]However, the commercial application of this cathode is limited by the severe capacity fading during electrochemical cycling due to the Mn dissolution.[6,7]Many strategies have been proposed to improve the structure stability and cycling performance, such as doping[8-10]and design of nanostructures.[11]Real-space measurement of electron distribution of LiMn2O4experimentally can provide direct evaluation on the strength of Mn-O bond and understand the intrinsic mechanism of capacity fading.
Considerable progress has been made on electron density measurement and related properties of materials through xray diffraction (XRD),[12-15]such as inter-icosahedral bonding in boron polymorphs,[16]additional charge concentration perpendicular to the bond path in Sc3TMC4(TM=Fe,Co, Ni),[17]etc. Besides, the density-based quantum theory of atoms in molecules developed by Bader provides a powerful tool for interpreting the x-ray determined charge densities.[18-20]This allows for the characterization of the nature of chemical interactions between bonded atoms in molecular rather than simple connection of atoms.Kasaiet al.found the van der Waals interactions between interlayer S-S in TiS2through quantitative topological analysis of measured electron density,which cannot be calculated by density functional theory(DFT).[21]
Compared with single-crystal XRD, powder diffraction has the advantages of reduced systematic errors with the negligible absorption and extinction effects, as well as the same scale factor.[13,22,23]However, some shortages to be noticed are the peaks overlapping at high scattering-angle part and the difficulty of treatment on background. Benefiting from stable third-generation synchrotron x-ray sources,[24-26]the highquality diffraction data allow more precise determination on electron density. In this work, we investigated the electron density distribution of cathode material LiMn2O4using high energy SPXRD and multipole model. Through the topological analysis of the chemical interaction of Mn-O bond based on the measured electron density,a relatively weak covalency of Mn-O bond is characterized. Also, the relationship between the electron density and electrochemical properties is discussed.
2. Experimental details
The polycrystalline powder LiMn2O4was brought from Alfa with metals basis of 99.5%. SEM image showed that the particle size is about 2-5 μm. The electrochemical curve of LiMn2O4cell with Li metal as a negative electrode was operated in voltage of 3.09-4.46 V.The atomic structures of the LiMn2O4were characterized using an ARM-200CF (JEOL,Tokyo, Japan) transmission electron microscope operated at 200 kV and equipped with double spherical aberration (Cs)correctors. High-angle angular dark-field (HAADF) and angular bright-field (ABF) images were acquired at acceptance angles of 90-370 mrad and 12-24 mrad,respectively.
Before collecting the synchrotron XRD data, the lab XRD with CuKαradiation was done to determine the crystallinity and structure of the sample. Polycrystalline samples of LiMn2O4were sealed in a 0.3 mm internal diameter Lindeman glass capillary. Synchrotron powder x-ray profiles were measured at the SPring-8 BL19B2 beamline. A large Debye-Sherrer camera with an imaging plate (IP) detector was used for data collection. The data were collected at room temperature to avoid the phase transition below 280 K.The wavelength of the incident x-rays was 0.413269 ˚A by calibration with a National Institute of Standards and Technology(NIST)CeO2standard sample. Data were collected with 2θfrom 2.1°to 78.165°and step width of 0.005°which guarantee the enough resolution for refinement. To subtract the contribution of glass capillary on the background intensity, diffraction data of an empty Lindeman glass capillary was also collected under the same condition.
3. Results and discussion
Figure 1 shows the atomic structure and electrochemical performance of the spinel LiMn2O4. The structure projected along [100] zone axis exbibits the typical spinel atomic arrangement as shown in Fig. 1(a), where Li ions occupy the 8asites with tetrahedral coordination, Mn ions being in the 16dsites with octahedral coordination, and the O ions in the 32esites. The[MnO6]octahedra share faces with the[LiO4]tetrahedra. The uniform morphology and particle size between 2-5 μm can also be visualized in Fig.1(b). To examine the structure and crystallinity of LiMn2O4, laboratory XRD with CuKαhas been performed as illustrated in Fig. 1(c).Through Rietveld refinement the space group is defined byFd-3m. Also, the goodRfactors prove that no impurity phase exists. HAADF- and ABF-STEM images along the [110]zone axis exhibited in Figs.1(e)-1(f)show the homogeneous atomic structure of spinel LiMn2O4.
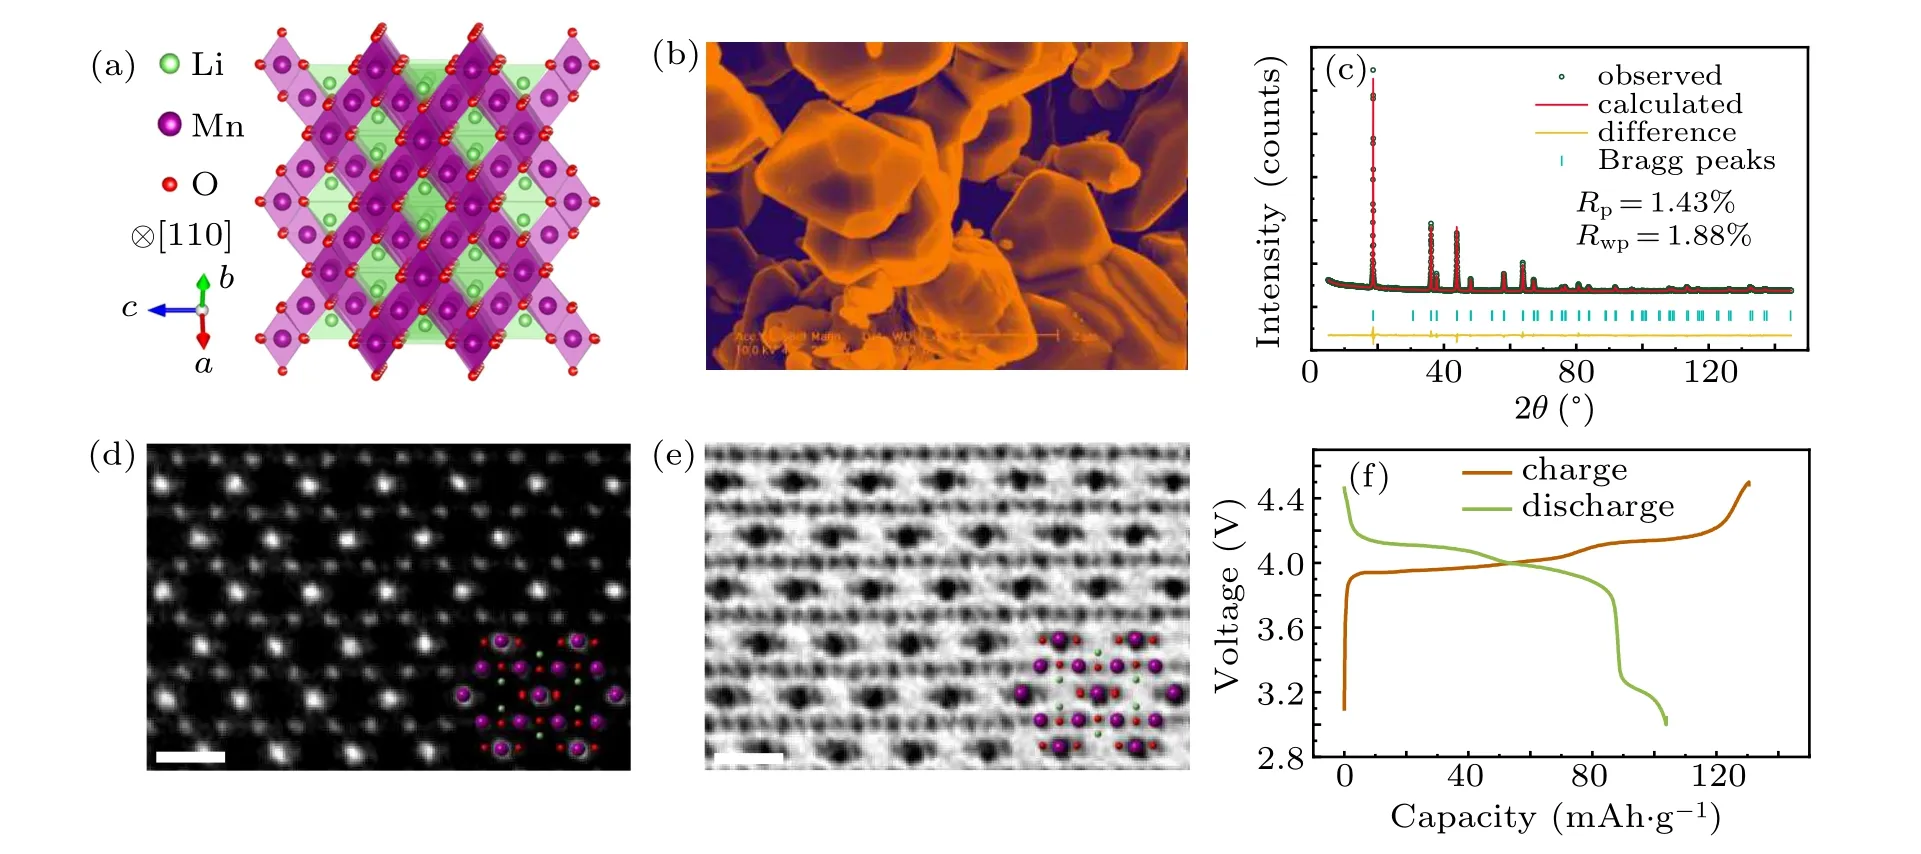
Fig.1. Structural characterization and electrochemical performance of the spinel LiMn2O4 cathode. (a)Structure model of spinel LiMn2O4 projected along [110] zone axis. (b) Low-magnification SEM image of polycrystalline LiMn2O4 grains. (c) Refined XRD pattern acquired in lab facility. (d)-(e) HAADF and ABF images along [110] direction, where the structural models of LiMn2O4 are overlayered. Scale bar:0.5 nm. (f)Capacity-voltage curve of LiMn2O4 cathode with Li metal as a negative electrode in the first charge/discharge cycle.
To further confirm the performance of LiMn2O4,the first electrochemical charge/discharge cycling was carried out as shown in Fig. 1(f). The severe capacity fading after initial charging is partially from the high cut-off charge voltage up to 4.46 V.The chemical composition analysis was characterized by inductively coupled plasma-mass spectrometry (ICP-MS)and the weight percent (wt%) of the three elements Li, Mn,and O can be seen in Table 1.The result shows that the content of oxygen is slightly lower than stoichiometry.This may cause the capacity fading because the oxygen deficiency can lead to the increasing of Mn3+dissolution.[27]The small oxygen deficiencies have little influence on the structure framework of pristine LiMn2O4as shown in HAADF and ABF images.Thus, it assumes that the arrangement of oxygen deficiencies is homogeneous and disordered.

Table 1.Chemical composition obtained by inductively coupled plasma of LiMn2O4.

Table 2. Refined results of LiMn2O4.
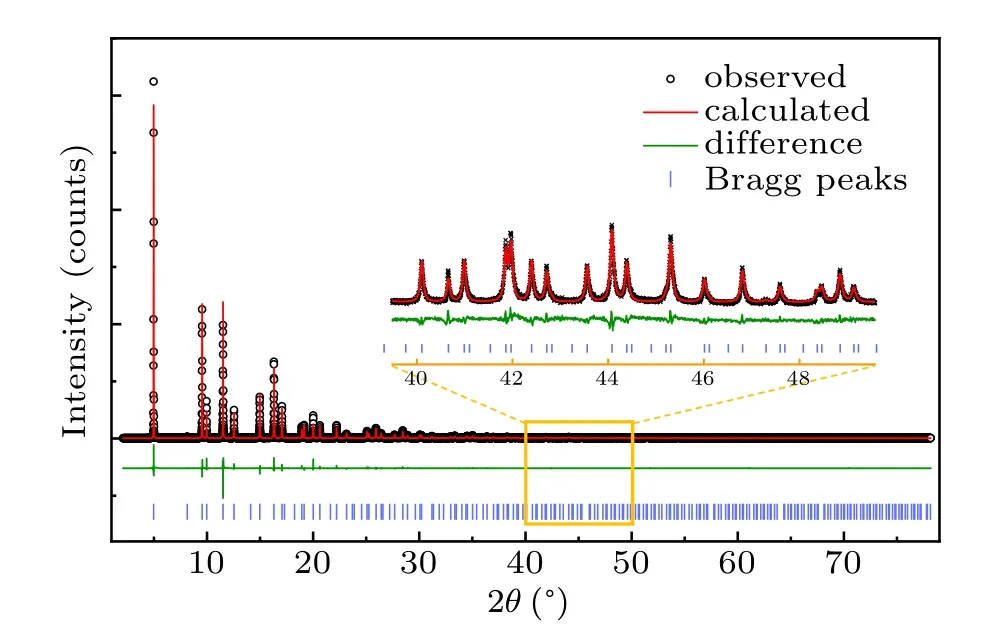
Fig.2. Synchrotron powder XRD data and Rietveld refinement results for LiMn2O4. The inset is the magnified image from the orange box.Black cross is observed data. Red line is the corresponding calculated one. Green line is the difference between experimentally observed and calculated data. Blue vertical bar is the Bragg peak position.
The synchrotron powder x-ray diffraction was collected with sinθ/λmax= 1.52 ˚A-1that is enough for multipole refinement according to the condition that sinθ/λmax≥1.0 ˚A-1.[13]To reduce the systematic error caused by unapt modeling of background, a combination linear interpolation and 20 terms of Legendre polynomial expansion were used.The linear interpolation between 16 points was manually selected and adjusted to make sure that it did not inappropriately describe data features. As the diffraction data was collected at room temperature,the contribution of atomic displacement parameter(ADP)on diffraction intensity cannot be neglected.After testing different orders of ADP, the best refinement of ADPs for different atoms is anisotropic 2-order for Li,3-order for O, and 4-order for Mn. It should be noted that two constrains for Li were imposed during multipole refinement: the valence population fixed to be 0,and the deformation valence electron was not refined. The refinement parameters exhibited in Table 2 after multipole refinement show the acceptable results according to theRfactors. Figure 2 plots the multipole model and experimental data after multipole refinement. Table 2 lists some refinement parameters.[28]The refined valence populations of Mn and O are 5.68 and 6.66, respectively, in which the number of transferred electrons is lower than that of the classical valence state, indicating the covalence of Mn-O bond.
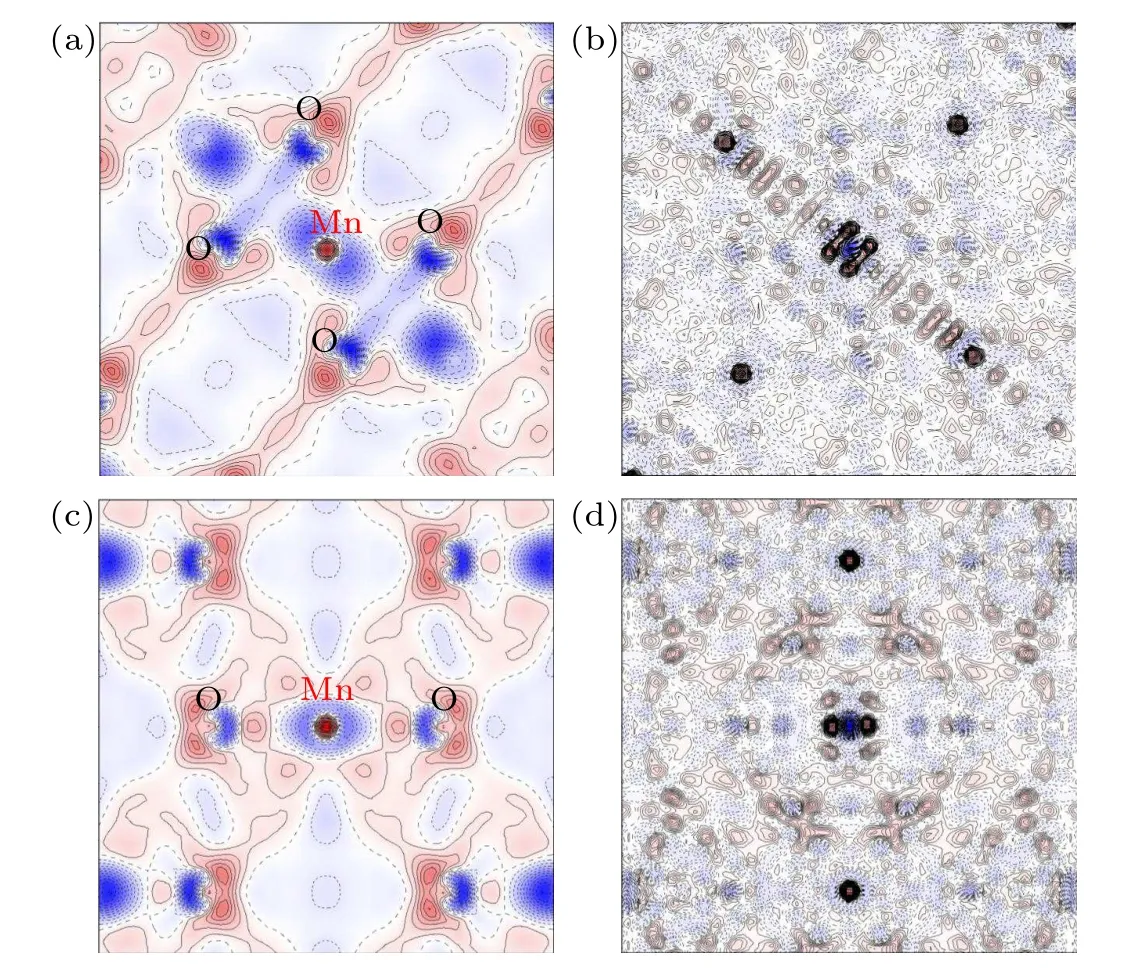
Fig.3. Deformation charge density distribution and residual density maps of LiMn2O4. (a) and (b) are the static multipole deformation density and the corresponding residual density maps in the (010) plane. (c) and (d) are the static multipole deformation density and the corresponding residual density maps in the(110)plane. The contour interval is 0.1 e·˚A-3,with positive and negative contours drawn as solid red and dotted blue lines,respectively.
Figure 3 shows the static multipole deformation density and residual density of(010)and(110)planes containing Mn-O bonding of [MnO6] octahedron. The residual density map obtained from the difference between multipole model and experiment reflects the quality of the refinement. There is accumulation of residual density at and near the nuclei, but no obvious features of valence electrons which can be seen from Figs.3(b)and 3(d). This indicates the good quality of modeling the electron density of Mn and O.The deformation density is the difference between non-spherical multipole model and spherical independent atom model which can clearly reveal the valence electron distribution of bonding atoms. Figures 3(a)and 3(c) show the Mn-O4and Mn-O2plane in [MnO6] octahedron. The overlap electrons between bonded Mn and O indicate the shared shell interaction,i.e.,the covalent interaction of Mn-O bond. Quantum topological analysis of the total charge density can give the quantitative atomic interactions based on the features of electrons at the bond critical points(BCPs), i.e., the maximum of electron density. According to the criterion in terms of the sign of ∇2ρ(rc),the Mn-O bond is shared covalent interaction,as the ∇2ρ(rc)between Mn and O is-0.7469,the negative Laplacian corresponding to the covalent bonding interaction.[18]However, the ratio of Hessian eigenvalues between the perpendicular and parallel directions in respect to the bond path|λ1/λ3|is 0.6025 which is smaller than 1. This indicates that the covalency of Mn-O bond is relatively weak.[29]The covalency of the Mn-O bond is strongly correlated with Mn dissolution;[30]with increasing covalency of Mn-O bond,the dissolution of Mn can be reduced and the formation of John-Teller active Mn3+can also be suppressed.In this work, the weak of covalency can be explained by the decrease of the oxygen content. Since the oxygen deficiency leads to the increasing amount of Mn3+,with which the Mn-O bond is ionic. The decreasing covalent character of Mn-O interaction is strongly related to the capacity decay as shown in Fig.1(f).
In summary, the electron accumulation between Mn and O atoms in deformation charge density map as well as the negative Laplacian and small|λ1/λ3| at the BCP of Mn-O bond indicates a weak covalent interaction. This may relate with the oxygen deficiency of LiMn2O4and correlate with the severe capacity fading from the initial charge/discharge process.A strategy on maintaining oxygen stoichiometry or increasing the valence state of Mn would be valid for preventing the Mn dissolution and capacity fading. As the x-ray electron density can be correlated with structure, future development of electron density on functional materials can be focused on the response on external field,i.e.,temperature,strain,electric and magnetic fields, which can induce and control physical properties such as thermoelectricity, piezoelectricity, colossal magnetoresistance, etc. The ability to experimentally reveal the changes of electron redistribution and bonding interaction should have a great influence on the design of functional materials.
杂志排行

Chinese Physics B的其它文章
- Projective representation of D6 group in twisted bilayer graphene*
- Bilayer twisting as a mean to isolate connected flat bands in a kagome lattice through Wigner crystallization*
- Magnon bands in twisted bilayer honeycomb quantum magnets*
- Faraday rotations,ellipticity,and circular dichroism in magneto-optical spectrum of moir´e superlattices*
- Nonlocal advantage of quantum coherence and entanglement of two spins under intrinsic decoherence*
- Universal quantum control based on parametric modulation in superconducting circuits*