Dynamical robustness of networks based on betweenness against multi-node attack*
2021-05-24ZiWeiYuan袁紫薇ChangChunLv吕长春ShuBinSi司书宾andDongLiDuan段东立
Zi-Wei Yuan(袁紫薇), Chang-Chun Lv(吕长春), Shu-Bin Si(司书宾),†, and Dong-Li Duan(段东立)
1School of Mechanical Engineering,Northwestern Polytechnical University,Xi’an 710072,China
2Key Laboratory of Industrial Engineering and Intelligent Manufacturing(Ministry of Industry and Information Technology),Xi’an 710072,China
3School of Information and Control Engineering,Xi’an University of Architecture and Technology,Xi’an 710311,China
Keywords: complex network,robustness,betweenness,critical threshold
1. Introduction
Complex networks have become a common focus in different fields such as biology, medicine, transportation and power grid due to the fact that many real-world systems can be represented as complex networks.[1–10]The robustness of networks is one of the central topics of complex networks.[11–17]Robustness refers to a network’s ability to keep its normal functioning when errors, failures or environmental changes occur. The robustness of networks can be classified into two categories: static robustness and dynamical robustness. Static robustness is about how the structure of a network changes after removing vertices or edges from the network. Obviously a network will be discomposed into several small-scale networks after removing a group of vertices or edges, which makes the network disable to function properly. Dynamical robustness discusses the ability of a network with dynamical behaviors to adjust its activity to retain its basic function when the network is subject to errors or failures. The dynamical behavior in networks complicates the cascading process, and maybe a single-node failure can induce the whole network to collapse.
Many studies have been devoted to discussing static robustness. Callaway et al. studied percolation on graphs with completely general degree distribution,giving exact solutions for a variety of cases,including site percolation,bond percolation,and models in which occupation probabilities depend on vertex degree.[18]Albert et al. explored error and attack tolerance of complex networks,and they found that scale-free networks are extremely vulnerable to the selection and removal of a few nodes that play a vital role in maintaining the network’s connectivity.[19]Holme et al. studied the response of complex networks subject to four different attacking strategies including: removals by the descending order of the degree and the betweenness centrality,calculated for either the initial network or the current network during the removal procedure. Several existing complex network models as well as real-world networks of scientific collaborations and Internet traffic are numerically investigated.[20]Lyer et al. studied the effect on the change of the network structure of removing vertices based on four centrality measures.[21]Zhang et al. studied the robustness of small-world networks under three attacks and it was found that the increase in rewiring probability and average degree effectively enhances the network robustness.[22]Buldyrev et al. extended the study on complex networks from a single non-interacting network to interdependent networks,and they developed a model for understanding the robustness of interacting networks subject to the failure of a fraction of nodes.[23]Gao et al.developed a general analytical framework for studying percolation of n interdependent networks.[24]The network topology plays an important role in static robustness. For example,the response of homogeneous networks to random and targeted attack is identical,while heterogeneous networks are robust to random attack but fragile to targeted attack.[19]
Researchers have found that the dynamical behavior of networks considering the physical quantities on vertices and the flow of physical quantities between vertices is in agreement with some cases in reality because vertices of the realworld networks always carry materials, energy, information or other forms of load, for example, each vertex deals with a load of power in power transmission grid. Thus the dynamical robustness has attracted much attention. Motter et al. introduced a model for cascading failures in complex networks in which the initial load of a vertex is related to the shortest paths passing through the vertex and its capacity is proportional to its initial load.[25]The authors of Refs. [26,27] also studied the cascading process using the model that is based on the shortest paths. In Ref. [26], the capacity of a vertex was represented as the Heaviside step function in which whether or not each vertex was assigned to some extra capacity was controlled by two parameters. In Ref. [27], the capacity allocation mechanism of a vertex considered not only the extra capacity but also the topological structure. Wu et al. studied the onset and spreading of cascading failures on weighted heterogeneous networks by adopting a local weighted flow redistribution rule where the weight and tolerance of a node is correlated with its link degree.[28]Wang et al. investigated the cascading failure on weighted complex networks by removing a single edge and adopting a local weighted flow redistribution rule based on degree.[29]Mirzasoleiman et al. studied the tolerance of cascaded failures in weighted networks with three weighting strategies including the betweenness centrality of the edges, the product of the degrees of the end nodes and the product of their betweenness centralities.[30]Wang et al. proposed a local protection strategy to address the problem of the optimal defense in the cascading propagation where the neighboring nodes of an overload node provide some protection resource to this node.[31]Lv et al. developed a quantitative approach to examine the cascading overload condition based on the structure connectivity when a fraction f of nodes were attacked randomly and explored the critical threshold against cascading failures with two types of load redistribution rule.[32]The above references are about cascading failures based on overload models. Network self-recovery is another topic of dynamical robustness,which refers to the capacity of spontaneous recovery after networks collapse by restoring the failed nodes or edges. Majdandzic et al. explored the behavior of dynamical networks when node recovery is taken into account and found the spontaneous emergence of macroscopic‘phase-flipping’ phenomena, which showed that the fraction of active nodes z switches back and forth between the two network collective modes characterized by high network activity and low network activity.[33]Shang discussed the robustness of complex networks by considering localized recovery (LR)strategy and developed a theoretical framework to compare the effect of random recovery (RR) and localized recovery(LR)strategy.[34]Gallos et al. proposed a simple and effective self-healing strategy where each node decides independently whether to create a new link depending on the fraction of neighbors it has lost.[35]Shang revealed the effect of varying self-healing capability on network robustness and developed analytical tools to deal with this problem using degree distribution as the only input.[36]Besides node recovery, Shang also studied a network model with arbitrary degree distributions possessing natural link oriented recovery mechanisms,in which a failed link can be recovered if its two end nodes maintain sufficient proportions of functional links. It was found that the self-healing effect induces distinct resilience characteristics for scale-free networks under random failure and intentional attack,and a resilience crossover has been observed at certain level of self-healing.[37]
Many works mentioned above on cascading failures based on overload models refer to the case of a single vertex or edge being removed. Malfunction in real systems may be also caused by failures of a part of their components. An example is the blackout in Northern America, which was induced by the voltage overload of three circuits. Another example that exists in our daily is public traffic system. In transportation network,it can be seen that several road sections are blocked at the same time, which gives rise to traffic congestion especially during the evening rush hour. Thus multi-node attack on networks should attract more attention to understand the failure mechanism in real systems further. Furthermore,betweenness is a centrality measuring the number of shortest paths between pairs of vertices that pass through a given vertex. Betweenness has practical significance in many real-work systems. For example,the shortest paths are common choices in the transportation networks and on the internet data always travels along the shortest paths. Therefore, in this article, we explore a dynamical process that seizes two aspects: a fraction of vertices is removed and an overload model is related to betweenness.
In the rest of this article, in Section 2 we describe the overload dynamic model and the normalized avalanche size that quantifies the robustness of the whole network. In Section 3 we give the theoretical analysis of critical threshold αc. In Section 4, simulation results about the critical threshold αcare presented. In Section 5, we compare the robustness of networks against cascading processes based on two overload models. The conclusion is given in Section 6.
2. Overload dynamic model
In the dynamical process,the load on vertices and the flow of the load between vertices are considered. According to the local load preferential sharing rule, the load of each removed vertex is redistributed to its neighboring vertices. If the updated load of a vertex exceeds its capacity after redistribution,the overload failure occurs and redistribution continues. The iterative process does not stop until there are no overload failures or the system collapses. We assume that the initial load of the vertex i is

where θ is the strength parameter,Biis the betweenness of the vertex i. If the vertex j is a neighbor of the vertex i,the extra share added to the vertex j from the vertex i is proportional to the initial load of the vertex j
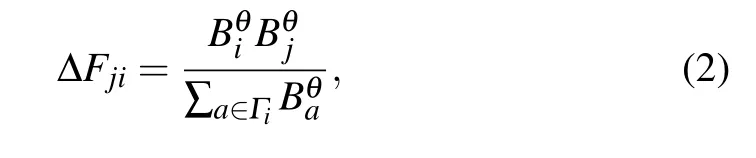
where Γiis the set of neighboring vertices of the vertex i.When a fraction f of vertices is removed from a network at random,these removed vertices belonging to the neighbors of the vertex j will redistribute their load to the vertex j, so the total additional load of the vertex j,which is denoted as ΔFj,is
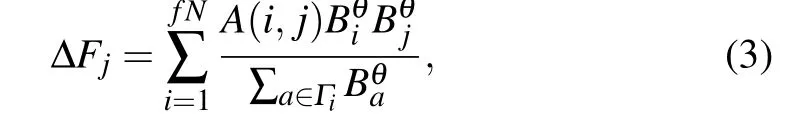
where fN is the number of initial removed vertices, A is the adjacent matrix of a network, where A(i,j)=1 if the vertex i and the vertex j are connected and A(i,j)=0 otherwise. In addition,each vertex has its capacity that is the maximum load a vertex can handle. The capacity of a vertex is proportional to its initial load
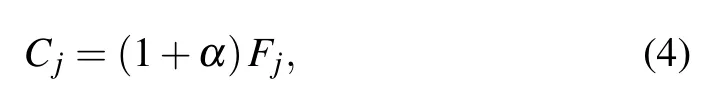
where α is the tolerance parameter. If Fj+ΔFj>Cj,the vertex j fails and its load is redistributed to its neighboring vertices, which may induce other vertices to fail. Obviously the larger the tolerance parameter α is,the less likely the total load of a vertex will exceed its capacity.
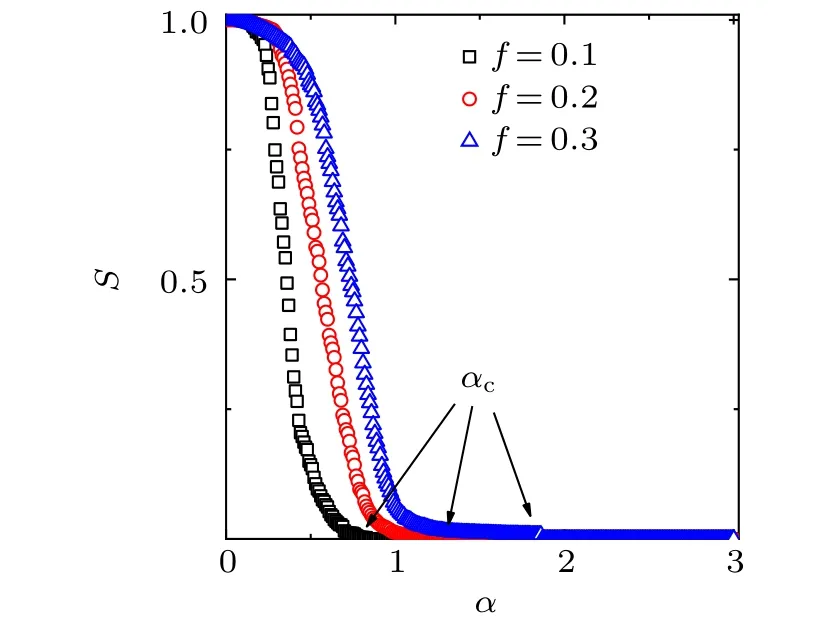
Fig.1. Normalized avalanche size S as a function of tolerance parameter α for different removal fractions f with the overload model based on betweenness. The avalanche sizes for f =0.1 (squares), f =0.2(circles), f =0.3(triangles)are presented. These results of numerical simulations are the average of 10 realizations of a single BA network with N=1000,m=2,m0=2. αc is the critical threshold where phase transition appears and any value α that is greater than αc ensures there are no cascading failures in a network.
3. Theoretical analysis of critical threshold
In manmade networks the capacity of a vertex is limited by cost and resource. To acquire the strongest robustness by using minimal cost and resource, we attempt to find the minimal tolerance parameter that ensures there is no cascading failure in the network. First the initial load and capacity of a vertex can be seen in Eqs.(1)and(4),respectively. The redistribution rule according to which the load of a removed vertex is redistributed to other vertices is presented in Eq. (2). The additional load that an intact vertex gets is shown in Eq. (3).To avoid cascading failures, the total load of a vertex after a fraction f of vertices is removed should remain

the following condition should be satisfied,
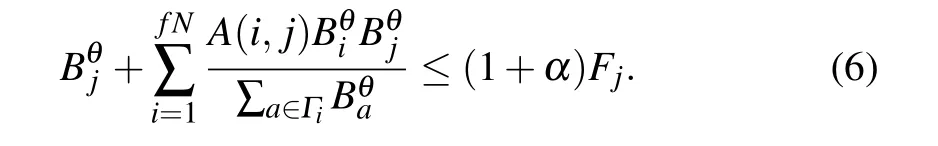
The first term of the left hand side of the inequality is the load of the vertex j,the second term of the left hand side of the inequality is the total additional load from removed vertices,so the left hand side of inequality represents the total load of the vertex j. The right hand side of the inequality is the capacity of the vertex j. To avoid cascading failures,the total load of a vertex should be no more than its capacity.
If the betweenness of the vertex i is Bi,the probability of a vertex that has betweenness B′being connected with the vertex i can be represented as the condition probability P(B′|Bi),we have

where Bmaxand Bminare the maximum and minimum of betweenness;kiis the number of neighboring vertices of the vertex i.
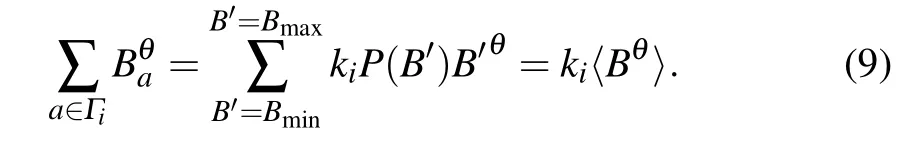
It has been shown in Ref. [30] that BA networks do not show any significant betweenness-betweenness correlations,thus we can write

From Eqs.(7)and(8),we have
From Eqs.(6)and(9),we have
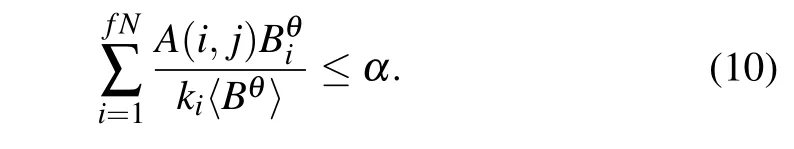
The critical threshold αcis set to the maximum value of the left hand side of the inequality (10) so that for any value of α that is larger than the critical threshold αc, there are no cascading failures in networks

Here the extreme case is considered to get the critical threshold. Assume that all the fN initially removed vertices are neighboring vertices of the vertex j, thus each removed vertex will redistribute extra load to the vertex j. The total load of the vertex j is the largest in this case. Of course the number of vertices redistributing extra load to the vertex j is limited by the degree kjof the vertex j. Thus it needs to be discussed separately.When the number of initial removed vertices is less than the degree of the vertex j,i.e., fN <kj,there are at most fN vertices that are neighboring vertices of the vertex j redistributing load to the vertex j. When the number of removed vertices is more than the degree of the vertex j,i.e.,fN >kj,there are at most kjvertices as neighboring vertices of the vertex j redistributing load to the vertex j. Thus two conditions are considered:
when fN <kj,
for θ ≥1
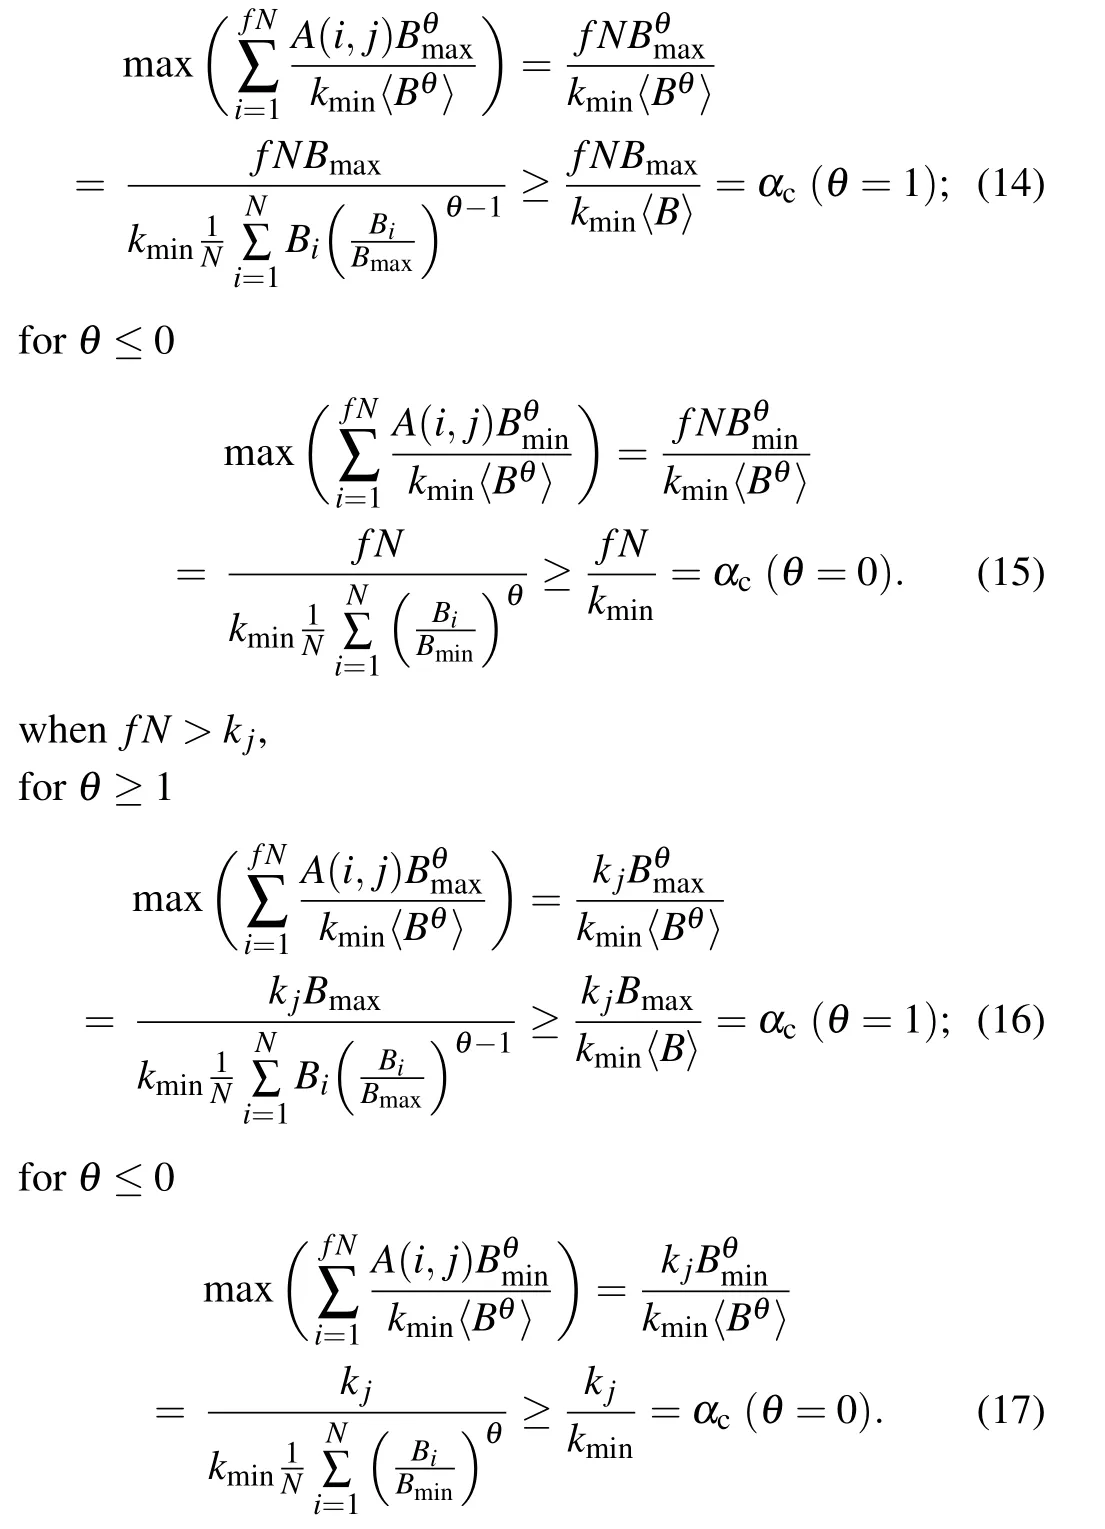
As we can see, we have αc(θ ≥1) ≥αc(θ =1) and αc(θ ≤0)≥αc(θ =0)in two conditions. Thus the network has its strongest robustness at 0 <θ <1. Although our formula can not deduce exactly the value of θ at which the minimal αcis obtained,we can roughly estimate where the minimal αcappears by the numerical analysis.
4. Simulation result
Simulations are performed to verify the result of theoretical analysis. The simulation processes are as follows: Step one: build a BA network with N vertices.[39](1) Start with a small number m0of vertices,there is no link between pairs of these vertices. (2)Add a new vertex and link the vertex to m0initial vertices. (3) Calculate the cumulative degree distribution of all vertices beginning with a vertex so that each vertex has a probability value p,then add a new vertex. (4)Generate a random value r. (5) Compare r with probability p of each vertex already at present one by one. If r <p, link the new vertex to the vertex corresponding to p and stop comparing.(6)Repeat process(4)and(5)m times,create m links between the new vertex and vertices already at present. (7)Repeat process(3),(4),(5)and(6)N −m0−1 times,a network with size N is built. Step two:randomly choose and remove a fraction f of vertices. Step three: redistribute the load of these removed vertices to their neighboring vertices,giving rise to the change of the load of intact vertices. Step four: compare the load of each vertex with its capacity. If the load of a vertex is greater than its capacity, remove the vertex and redistribute its load to neighboring vertices, which stops until the load of all remaining vertices is no more than their capacity. Step five: the existing load subtracts the initial load for each vertex to obtain the total additional load of a vertex. The maximum total additional load of all remaining vertices is the critical threshold.Step six: repeat step two to five 10 times, average 10 critical thresholds as the final critical threshold.
According to theoretical analysis the removal fraction f,the strength parameter θ and network connectivity are factors that affect the cascading process triggered by removing vertices. In Fig. 2, we illuminate the effect of the removal fraction f and the strength parameter θ on the threshold αc. It can be seen that for a given removal fraction f,there exists a minimal value of critical threshold when the strength parameter θ ranges from 0 to 2. For different f, there always exists the minimal αc,which is in agreement with the result of theoretical analysis. It is also found that the minimal αcincreases with the increase of the removal fraction f. The trend of the minimal αcchanging with removal fractions f is illustrated in Fig. 2(b), which is an upward curve. A larger proportion of vertices is removed from a network means more load will be redistributed to existing vertices, which induces the network to be prone to cascading failures.
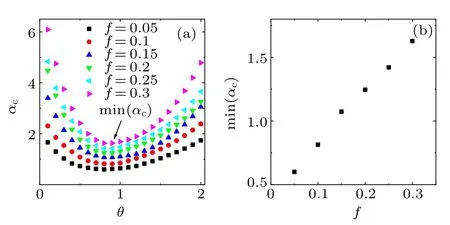
Fig.2. (a)Critical threshold αc as a function of θ for different removal fractions f with the overload model based on betweenness. Critical threshold αc for f =0.05(squares), f =0.1(circles), f =0.15(upper triangles), f =0.2 (lower triangles), f =0.25 (left triangles), f =0.3(right triangles) are presented. Every point is a critical threshold αc corresponding to θ. The min(αc)represents the minimal critical threshold which is the lowest point of the curve for a given removal fraction.(b) The minimal αc for different removal fractions f. Every simulation result is the average of 10 realizations of a single BA network with N=1000,m=2,m0=2.
Figure 3 illustrates the effect of the average degree on αc,showing the simulation results of three average degrees k=4,k=8, k=12 when f =0.1, f =0.2, f =0.3 respectively,in (a), (b) and (c). It can be seen that the critical threshold αcdecreases with the increase of the average degree. We can conclude that a network with a large average degree is more robust than that with small average degree. A large average degree means more neighboring vertices for a vertex. When a vertex fails in such a network, its load will be shared by more vertices, giving rise to a small additional load for each neighbor,possibly without inducing further cascading failures.Figure 3(d)shows the minimal αcas a function of the removal fraction f. It displays that for a given removal fraction f the minimal αcincreases with the decrease of the average degree,which means the larger the average degree is,the stronger the robustness of the network against cascading failures is.
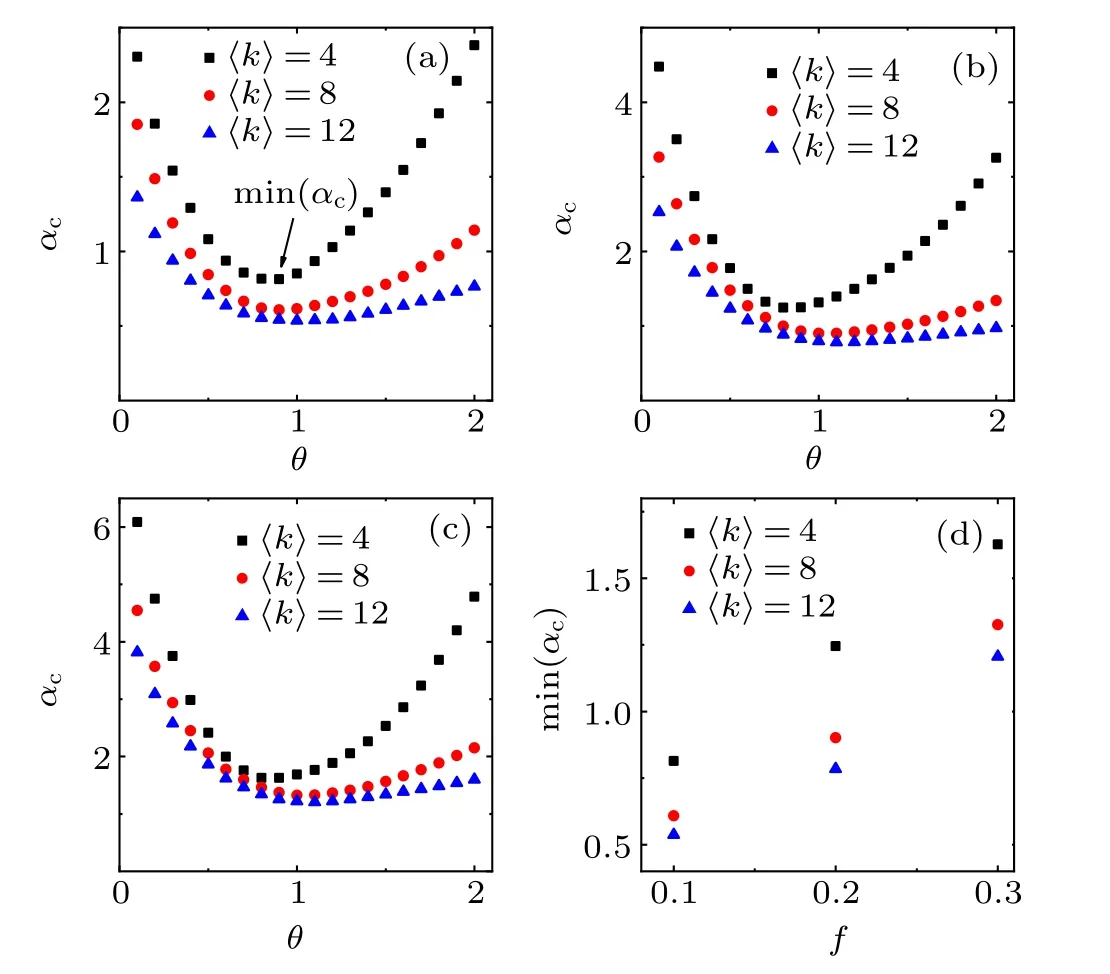
Fig. 3. Effect of the average degree on the robustness against removing a fraction f of vertices. (a), (b), (c) Simulation results of critical thresholds on BA networks with 〈k〉=4 (squares), 〈k〉=8 (circles),〈k〉=12(triangles)for f =0.1, f =0.2, f =0.3,respectively. (d)The minimal αc as a function of f for different average degrees. Every simulation result is the average of 10 realizations of a single BA network with N=1000,m0=2.
5. Comparison of two overload models
Betweenness centrality is the number of shortest paths passing through a vertex, which can measure the importance of some vertices that have a small degree but play an important role in connecting different parts of a network. Besides betweenness centrality, among many measures used to indicate the importance of a component, the degree of a vertex plays a fundamental role in networks. Many studies have been devoted to exploring cascading failures based on degree.[32,38]Hereafter we investigate the robustness of BA networks against the random removal of a fraction f of vertices where the overload model is based on degree and compare this result with the previous result whose overload model is based on betweenness. The initial load, the capacity and the redistribution rule based on degree can be represented as Eqs.(1)–(4)by substituting B with k. B and k account for the betweenness and degree of a vertex.
Figure 4(a)depicts the critical threshold αcas a function of the strength parameter θ for different removal fractions f with the overload model based on betweenness, which is the three-dimensional form of Fig.2(a). Figure 4(b)illustrates the critical threshold αcas a function of the strength parameter θ for different removal fractions f with the overload model based on degree. According to Figs. 4(a) and 4(b), we can observe that there exists a minimal αcin two overload models. Compared Fig. 4(a) with Fig. 4(b), when θ ranges from 0 to 2, the change of the critical threshold αcbased on betweenness is more prominent. Therefore, although the critical thresholds αccorresponding to θ that is close to 0 or 2 in Fig. 4(a) are greater than those in Fig. 4(b), the minimal αcbased on betweenness is smaller than that based on degree, which means that the overload model based on betweenness has stronger robustness. From Fig. 4(c) it can be seen that the minimal αcare obtained at θ =1 when the overload model is based on degree,while the minimal αcappears when θ is between 0 and 1 in the betweenness-based overload model. From this point, compared with the overload model based on betweenness, the overload model based on degree can provide a precise robustness prediction. The minimal αcvalues obtained from the betweenness-based overload model are slightly greater than those obtained from the degree-based overload model in Fig. 4(d), which also shows the overload model based on betweenness has stronger robustness.
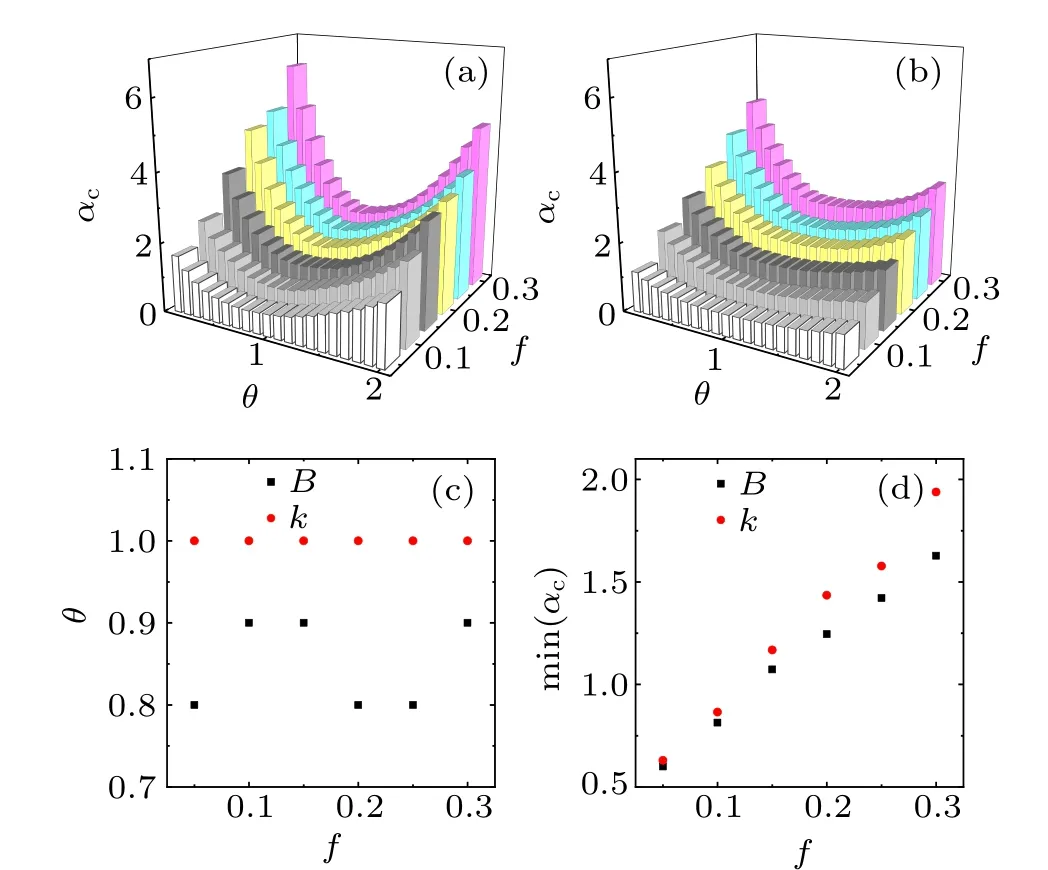
Fig. 4. Comparison of two overload models. (a) and (b) The critical threshold αc as a function of the strength parameter θ for different removal fractions f with the models based on betweenness and degree respectively. Here (a) is the three-dimensional form of Fig. 2(a). The height of every column represents a critical threshold corresponding to θ. The minimal critical threshold is the lowest point of the curve for a given removal fraction. (c)The values of θ at which the minimal αc values are obtained for different removal fractions f. (d)The minimal αc based on two overload models for different removal fractions f. In(c)and(b),red circles represent the results of the overload model based on degree and black squares represent the results of the overload model based on betweenness. Every simulation result is the average of 10 realizations of a single BA network with N=1000,m=2,m0=2.
6. Conclusion and discussion
In summary, we have investigated the robustness of networks against cascading failures concerning removing a fraction f of vertices at random. We construct a simple cascading model and apply it to BA networks to mimic the cascading process. The initial load of a vertex is based on its betweenness and its capacity is proportional to its initial load. In the model the critical threshold αcis explored to measure the robustness of BA networks against cascading failures. For a fixed removal fraction f,it is found that there exists a minimal αcwhen θ is between 0 and 1. The minimal αcincreases with the increase of the removal fraction f or the decrease of the average degree. Also,we investigate the robustness of networks against the random removal of a fraction f of vertices whose overload process depends on their degree. Then we compare the robustness of the overload modes based on betweenness and degree and find the networks with the betweenness-based overload process have better robustness.The derivation of theoretical analysis relies on the property of BA networks and the simulations are performed on BA networks, so the finding is applicable to BA networks. We will explore the robustness against the random removal of a fraction f of vertices where an overload model is based on betweenness on other synthetic networks such as ER networks and SW networks as well as realistic networks in near future.
杂志排行

Chinese Physics B的其它文章
- Corrosion behavior of high-level waste container materials Ti and Ti–Pd alloy under long-term gamma irradiation in Beishan groundwater*
- Degradation of β-Ga2O3 Schottky barrier diode under swift heavy ion irradiation*
- Influence of temperature and alloying elements on the threshold displacement energies in concentrated Ni–Fe–Cr alloys*
- Cathodic shift of onset potential on TiO2 nanorod arrays with significantly enhanced visible light photoactivity via nitrogen/cobalt co-implantation*
- Review on ionization and quenching mechanisms of Trichel pulse*
- Thermally induced band hybridization in bilayer-bilayer MoS2/WS2 heterostructure∗