合格献血者的人口学特征“可视化”应用初探
2021-04-09钟炽辉梁自领陈少彬叶群弟何子毅郭鹏豪陈庆恺
钟炽辉 梁自领 陈少彬 叶群弟 何子毅 郭鹏豪 陈庆恺
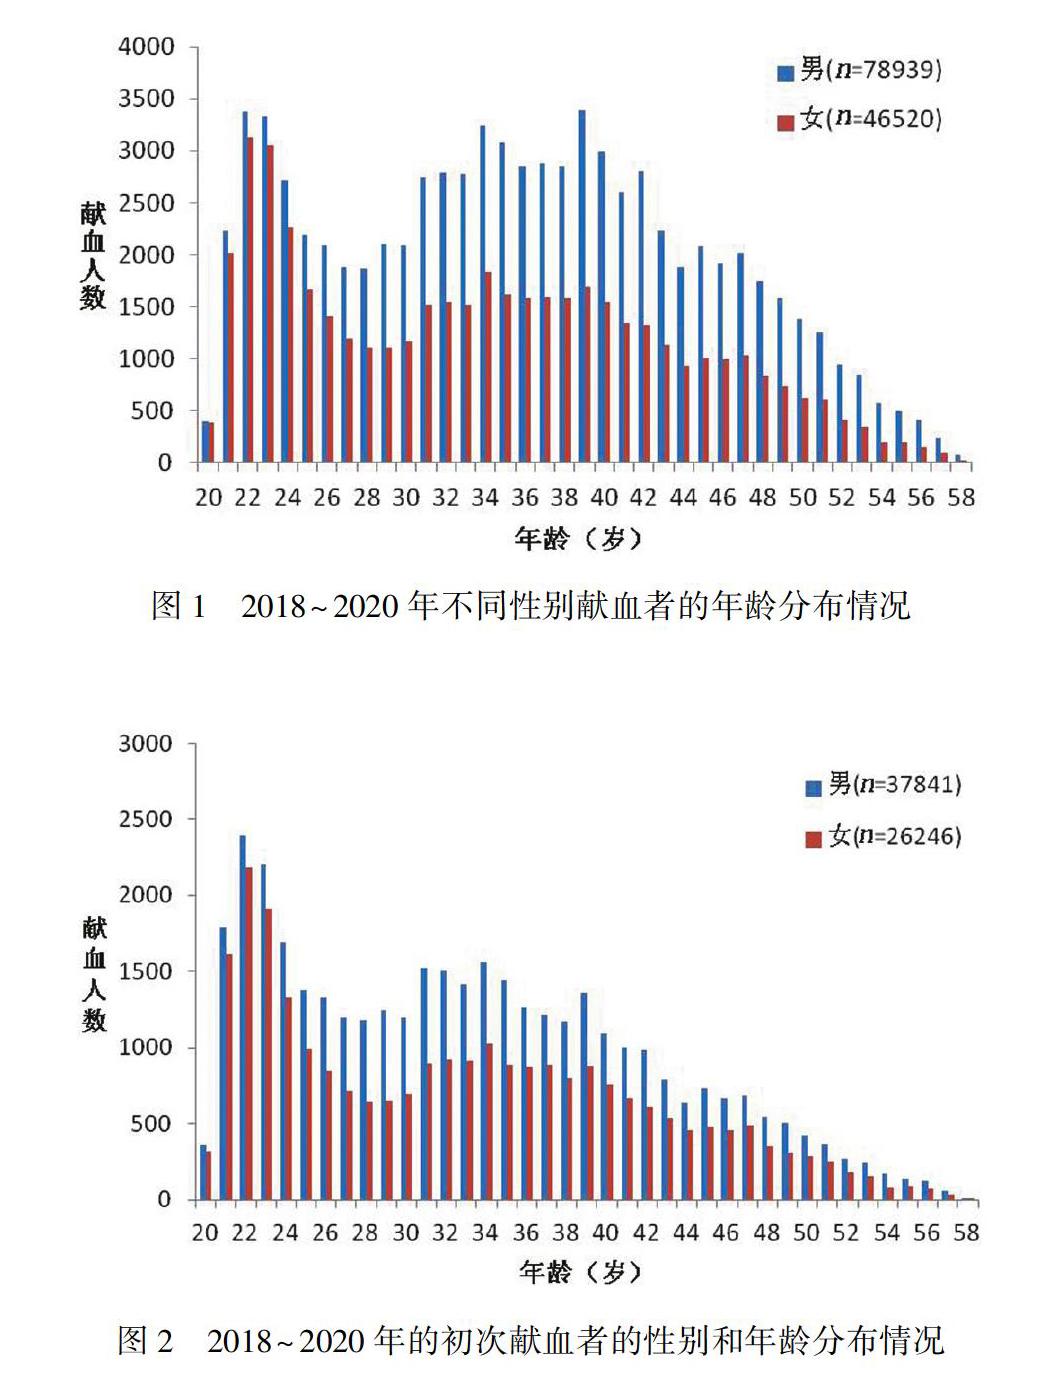
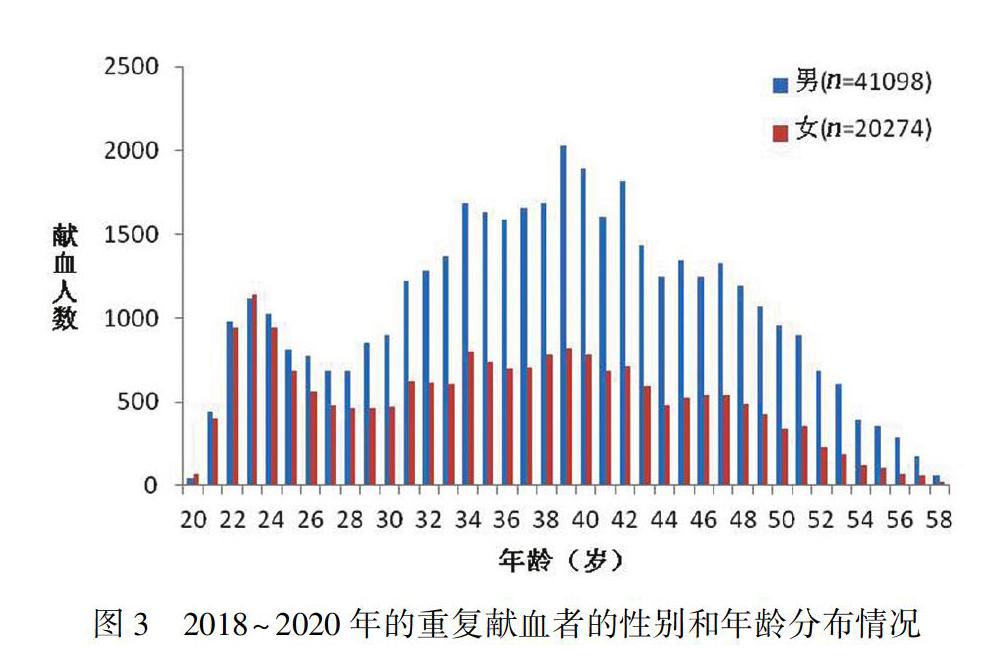
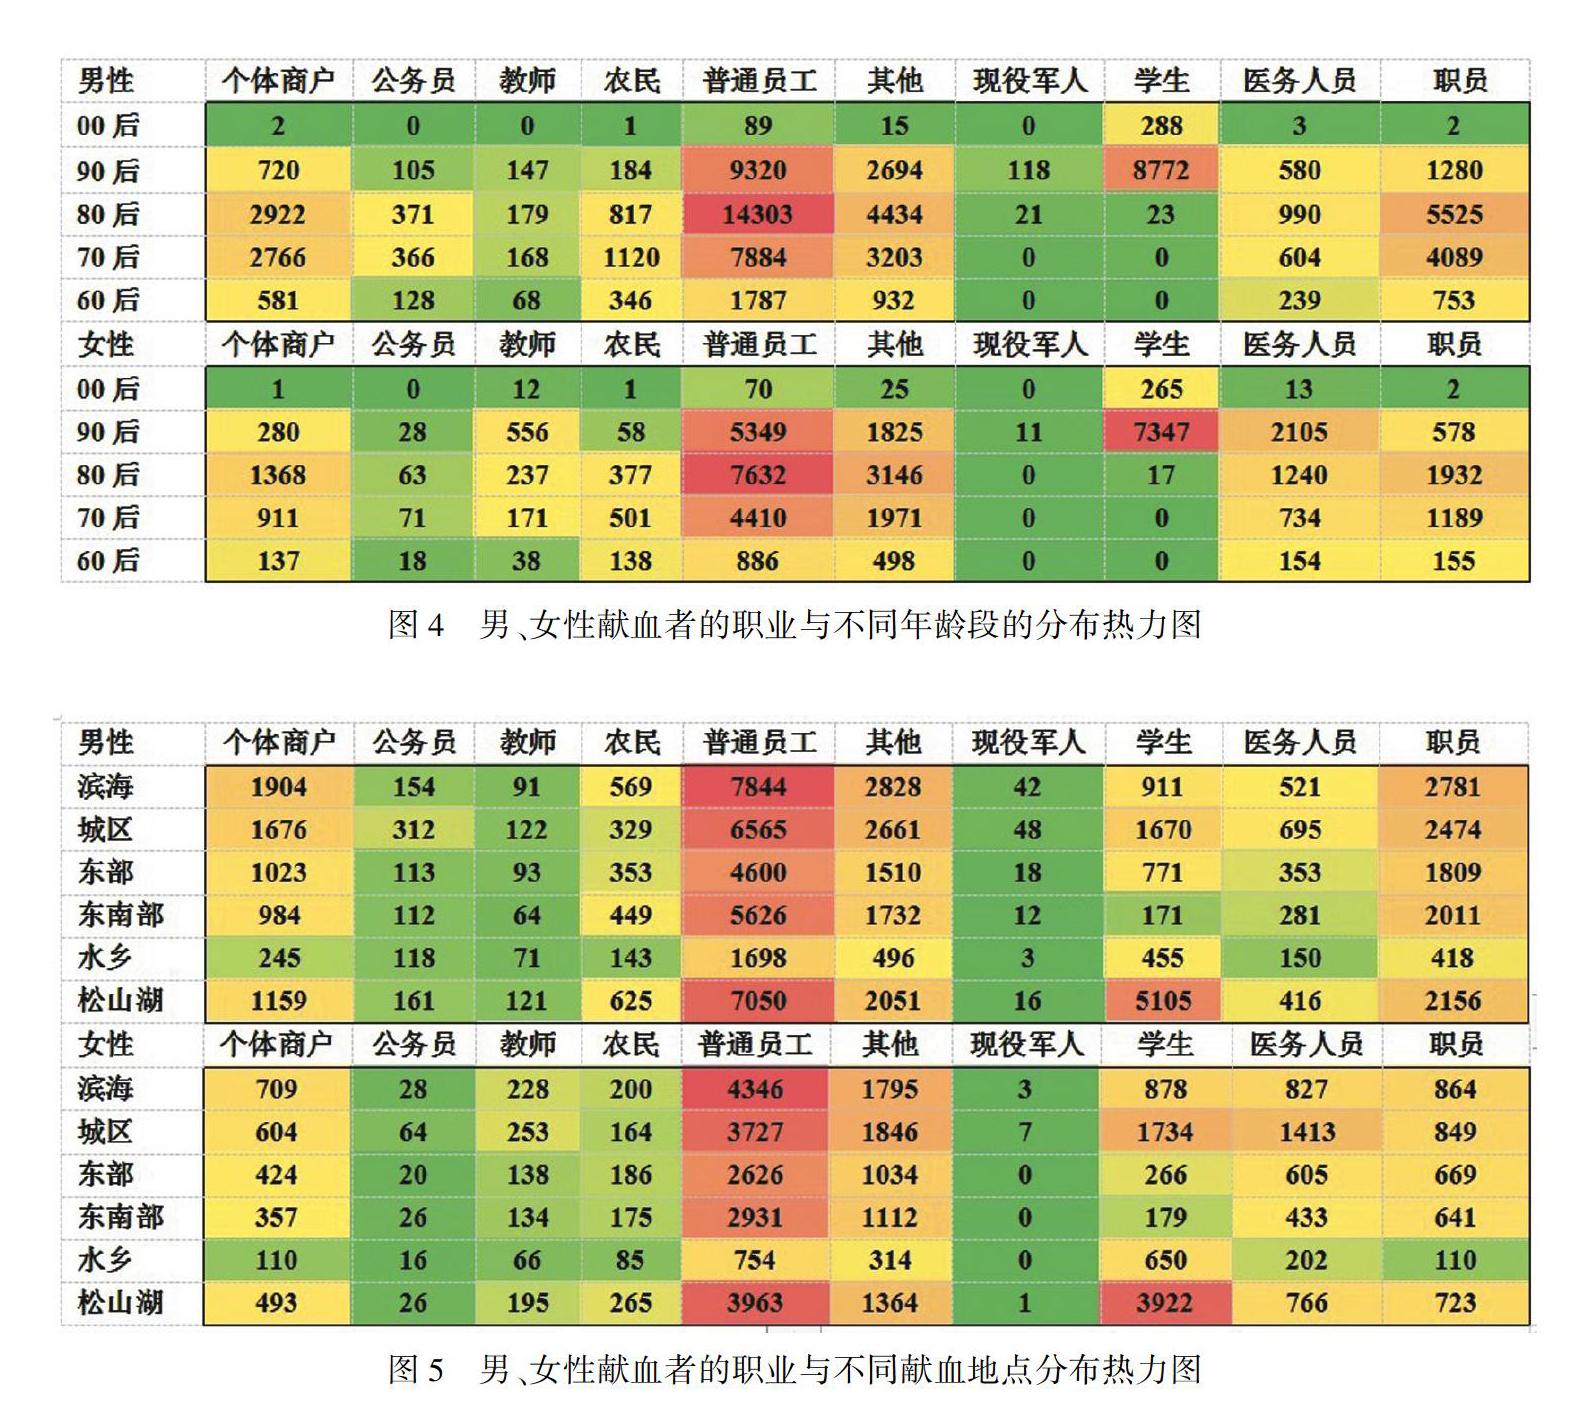
【摘要】 目的 通过挖掘某市献血者的基本信息,转化为“可视化”的人口学特征,为制订个性化的献血者招募策略提供参考依据。方法 整理2018年1月至2020年6月共125 459名血液检测合格的献血者信息,将不同年龄、性别、职业、献血次数和献血地点等数据转化为“可视化”的图表加以分析。结果 125 459名合格的献血者中,男性与女性献血者在年龄分布上不同(P<0.01),重复献血者在34~42岁年龄段的比例最高;不同职业的献血者以普通员工的比例最高,且“80后”的普通员工最多;该市各行政区域的献血人数不同,其中水乡片区最少,献血者主要分布在滨海片区、城区片区、东南部片区及松山湖片区,献血1次的普通员工最多。结论 “可视化”图表分析可直观明了概括该市献血人群的基本特点,通过对献血者不同特征指标分析,为挖掘“潜在献血者”和制订个性化精准招募对策提供直观的参考依据。
【关键词】 献血者;可视化;人口学特征;热力图
中图分类号:R193.3 文献标志码:A DOI:10.3969/j.issn.1003-1383.2021.02.008
【Abstract】 Objective To provide reference for the development of personalized blood donor recruitment strategy by mining the basic information of blood donors in a city and transforming it into visualized demographic characteristics. Methods From January 2018 to June 2020, the information of 125 459 blood donors who passed the blood test were collected, and the data of different ages, genders, occupations, blood donation times and blood donation locations were transformed into visualized charts for analysis. Results Among 125 459 qualified blood donors, male and female donors were different in age distribution (P < 0.05). Repeated donors had the highest proportion in the age group from 34 to 42 years. Ordinary employees had the highest proportion in the donors of different occupations, and most of them were the post-80s. The number of blood donations were different among different administrative areas in this city. Among them, blood donors in Shuixiang area was the least. Donors were mainly distributed in coastal area, urban area, southeast area, and Songshan Lake area, and ordinary employees who donated blood once were the most. Conclusion Visualized chart analysis can intuitively summarize the basic characteristics of donors in this city. Through the analysis of different characteristic indicators of blood donors, it can provides an intuitive reference for mining potential blood donors and formulating personalized and precise recruitment strategies.
【Key words】 blood donors; visualization; demographic characteristics; thermodynamic diagrams
“可視化”在现代化的大数据信息技术转化成果中应用广泛[1]。近年来,综合分析采供血过程中形成的大量数据并进行整理,从中找出有意义的指标,转化为“可视化”的图形或指标已成为大型血站数据分析和应用的发展趋势。本站利用大数据分析等手段在制订献血者精准招募策略方面有一定基础,但应用效果还需加强。为了掌握不同类型献血者的基本特征,提高献血者的招募效率,解决季节性、结构性和紧急性的供血紧张问题,利用数据分析和图表制作技术分析了2018年以来血液检测合格的献血者在年龄、性别、职业、献血次数及献血地点等方面的特征,直观地显示分析结果,为制订个性化的招募策略提供参考,现将结果报道如下。
1 对象与方法
研究对象 选取本站2018年1月至2020年6月血液检测结果为“合格”的献血者125 459名,其中男性78 939人, 平均年龄(35.81±9.15)岁,女性46 520人,平均年龄(33.88±9.27)岁。
1.2 资料来源 通过“现代血站信息管理系统 SHINOW 9.0”查询该部分献血者的基本数据信息,包括年龄、性别、职业、献血次数和献血地点等。……
