Analysis of asymmetry of the Dα emission spectra under the Zeeman effect in boundary region for D–D experiment on EAST tokamak∗
2021-03-11WeiGao高伟JuanHuang黄娟JianxunSu宿建勋JingFu付静YingjieChen陈颖杰WeiGao高伟ZhenweiWu吴振伟andEASTTeam
Wei Gao(高伟), Juan Huang(黄娟), Jianxun Su(宿建勋), Jing Fu(付静),Yingjie Chen(陈颖杰), Wei Gao(高伟), Zhenwei Wu(吴振伟), and EAST Team
Institute of Plasma Physics,Chinese Academy of Sciences,Hefei 230031,China
Keywords: Zeeman effect,deuterium atom,spectral lineshape,plasma
1. Introduction
In fusion plasma, the boundary plasma plays a very important role in plasma confinement[1–3]which influences impurity level and confinement of the core plasma. Beside the scrape-off layer, the atomic and molecular processes in the boundary were dominated in boundary recycling for rapidly decrease in electron temperature and density.[4]Therefore, it is important to study atomic and molecular spectra emitted by these processes in boundary region to understand the boundary recycling.For the strong magnetic field on different fusion devices,the Zeeman effect on the observed spectra was observed and investigated based on spectroscopic methodology,[5–19]and the lineshape of the emission spectrum was usually used to study and acquire the local plasma information. The emission spectrum under Zeeman effect was introduced as a tool for studying atomic processes in edge plasma on TEXTOR.[5–8]The Zeeman effect in hydrogen-like systems and its influence on fusion plasma temperature measurement was studied in detail on JET.[9,10]On Alcator C-Mod,[11–13]the neutral atomic temperature and flow velocity measurement by Zeeman split spectra were introduced,and only one emission region(inner divertor region)and the viewing angle θ were considered.The local values of the magnetic field,population density,temperature,and flow velocity by analyzing the Zeeman splitting spectra of atomic(Hα,He I)and molecular(H2: Fulcher-α band)spectra were evaluated on TRIAM-1M.[14–17]By filtering the π component, only the ±σ components of the spectra were observed, so the viewing angle θ was considered to be 90◦and not mentioned in Refs. [14,15,17] In their work, the hydrogen emission spectra were considered from two different emission regions (LFS and HFS) and roughly classified into two[14]or three[15,17]energy categories based on the atomic processes. On LHD,[18,19]the Zeeman splitting spectrum of He I had been used to determine the local values of the magnetic field and the emission positions near the ergodic layer[18]and the theoretical works about the Zeeman effect of the spectra were also introduced.[19]Because of the asymmetry of the Balmer-alpha line shape in the tokamak scrape-off layer, an algorithm for recovering the effective temperature of atoms of hydrogen (and its isotopes) was proposed[20,21]in which the non-Maxwellian distribution of the atoms was considered for the asymmetric phenomena in boundary in SOLPS4.3 code.For inverse problems and error estimations for the strong non-Maxwellian effect and intense divertor stray light on the Halpha diagnostic for ITER,the synthetic spectral signals with the Zeeman splitting were studied[22]and considered either from LFS or from HFS, in which the non-Maxwellian effect was also considered for the highly reflecting walls on future ITER,the I+σ=I−σwas used in the algorithm and the viewing angle was not mentioned. Based on the asymmetric spectral lineshape algorithm in Refs.[20–22], the effect of strong divertor stray light was studied in high-resolution main chamber Hαspectroscopy,[23]and the isotope ratio in the divertor was determined to increase the accuracy of tritium concentration measurement on JET-ILW by filtering the π component of the spectra.[24]On EAST,the Zeeman effect on Dαemission spectra was also studied and discussed in previous work.[25]
In this work, an algorithm was proposed to understand the asymmetry of the Dαemission spectra on EAST.Based on the high resolution spectra,the spectral lineshape method was used to analysis the emission spectra to acquire the important and useful parameters of the local plasma to understand the atomic processes in boundary recycling. The emission spectra with all polarization components(π and±σ)were observed and studied, because the effect between π and ±σ components was hard to be completely eliminated by using the polarizing filter in the experiment which might reduce the accuracy of data analysis. At meanwhile, the viewing angle θ could not be considered exactly 90◦for the actual optical path installation and the variation of the spatial magnetic configuration over the time. The intensity of ±σ components with I+σ/=I−σwas set and discussed in the algorithm. The effect of the instrument function of optical spectrometer system was also considered in data analysis. Based on the algorithm,a fitting procedure using the nonlinear least squares method was applied to fit and analyze the emission spectra to acquire the information of the local plasma. The viewing angle, the intensity of magnetic field at two emission positions, and the proportion and flow velocity of different energy categories of the emision spectra were determined by the algorithm. During the discharge,the atomic processes in boundary recycling were discussed in plasma discharge. A relationship between the intensity of the emission spectra and the magnetic field intensity was also concluded in this work.
The rest of this paper is organized as follows. The algorithm for asymmetry of Dαemission spectra under the Zeeman effect will be introduced in Section 2. Section 3 will introduce the asymmetric phenomena of the emission spectra and the algorithm test. Finally,summary will be given in Section 4.
2. Algorithm for asymmetry of the Dα emission spectra under the Zeeman effect
2.1. Zeeman effect on the Dα spectra
According to the quantum mechanical of the interaction between an atom and an external magnetic field B, the total non-relativistic Hamiltonian Htotof the atom can be expressed as
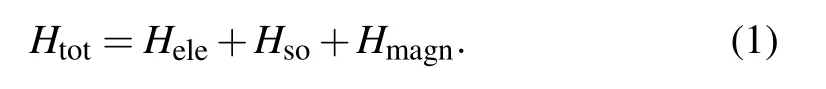
In first-order perturbation theory,the relative strength between the spin–orbit interaction Hsoand the external magnetic field affection Hmagnshould be considered. The change in energy due to the perturbation terms H′=Hso+Hmagncould be expressed as[25,26]
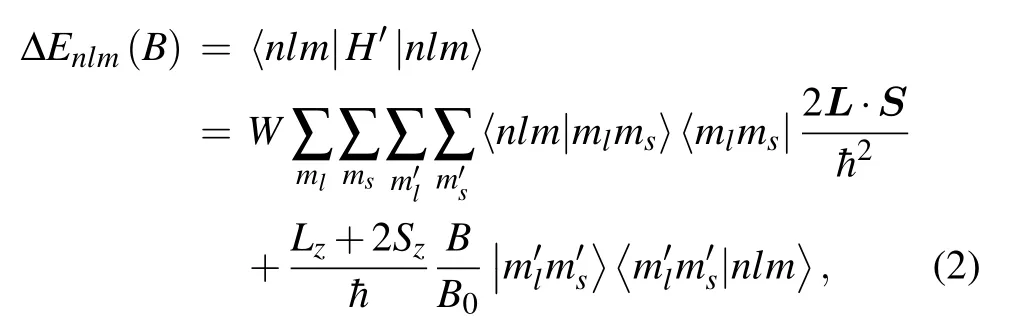
where L and S are the total orbital and total spin angular momenta,
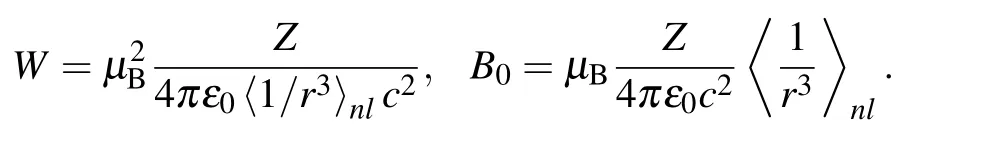
The other symbols have their usual meaning. In Eq. (1), the relative strength between the spin-orbit interaction and the external magnetic field affection should be considered,and a criterion of comparing B and[Z4/n3l(l+1)]·12.5 sizes can be used for the judgment here. If B ≫[Z4/n3l(l+1)]·12.5, the external magnetic field affection is dominant which belongs to the strong field effect, otherwise it belongs to the weak field effect. According to the above criterion, it belongs to the strong field effect under the current EAST operating conditions. Therefore, the perturbation of the energies could be simplified from Eq.(2)and expressed as
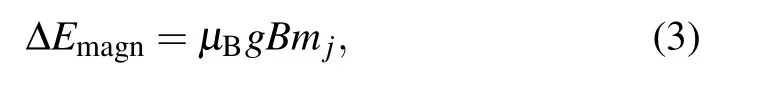
whereµBis Bohr magneton,
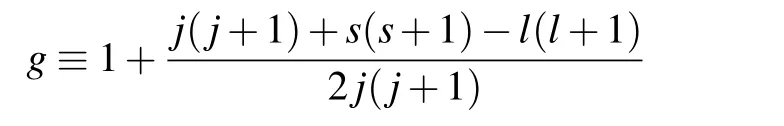
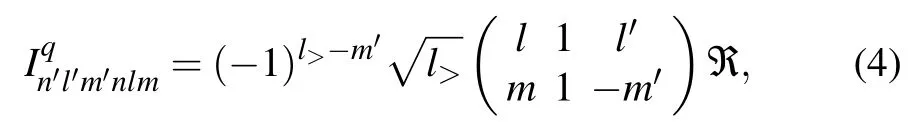
is the Land´e factor. Based on Wigner–Eckart theorem,[27]the transition intensity I between the upper and lower states can be expressed as
2.2. Algorithm for asymmetry of the Dα spectra
In the present work, the measured Dαemission spectra are considered to be mainly broadened by following essential elements: the first is the Doppler broadening of the spectra,the second is caused by the instrument function of the spectral measurement system(OSMA),and the last is the Zeeman split by the magnetic field B. Compared with these broadening factors, the natural broadening, the stark broadening, and the Dick effect are too small to be ignored here. As far as the algorithm without these factors it could fit the spectral lines very well. If the additional sought-for parameters for these factors are added, it will complicate the algorithm and make the fitting worse. In the algorithm,the neutral atoms are considered to follow the Maxwell distribution at the present plasma conditions on EAST.The final spectral lineshape can be obtained by convolving the spectral lineshape with the instrument function of OSMA system. In general, both of the broadening of the emission spectra and the instrument function are Gaussian lineshape, so the convolution result of the two Gaussian lineshapes is still Gaussian lineshape which could be expressed as


3. Test of the algorithm for the asymmetry of the Dα spectra
3.1. Asymmetry of the Dα spectra
In the experiment, the Dαemission spectra (22P1/2,3/2–32D3/2,5/2, 22S1/2–32P1/2,3/2, 22P1/2,3/2–32S1/2: 656.1 nm)were observed in lower divertor region by OSMA system on EAST. The details of the experiment setup and the diagnostic performance can be found in previous work.[25]In order to obtain higher spectral and temporal resolution, the 750 mm focal length of the spectrograph and 2400-g/m grating was used to observe the emission spectra to increase the resolution. The exposure time was set at 10 ms and the width of slit was adjusted to 10 µm to ensure sufficient light intensity and reduce the instrument broadening effect. The reciprocal linear dispersion was 0.286 nm/mm at 656 nm, and the wavelength resolution was 0.013 nm at full width at half maximum (FWHM). Base on these setting of the OSMA system,the asymmetry of Dαspectra under the Zeeman effect were measured and three kinds of the asymmetric phenomena of the spectra were summed and shown in Fig.1. The first kind was that the left part (+σ) was sightly higher than the right part(−σ)in Fig.1(a),the second was the opposite in Fig.1(b)and the last was that the middle part (π) was lower than the left(−σ)and right parts(+σ)in Fig.1(c). Figures 1(a)and 1(b)were observed in poloidal section and figure 1(c)was observed in mid-plane tangential angle observation.
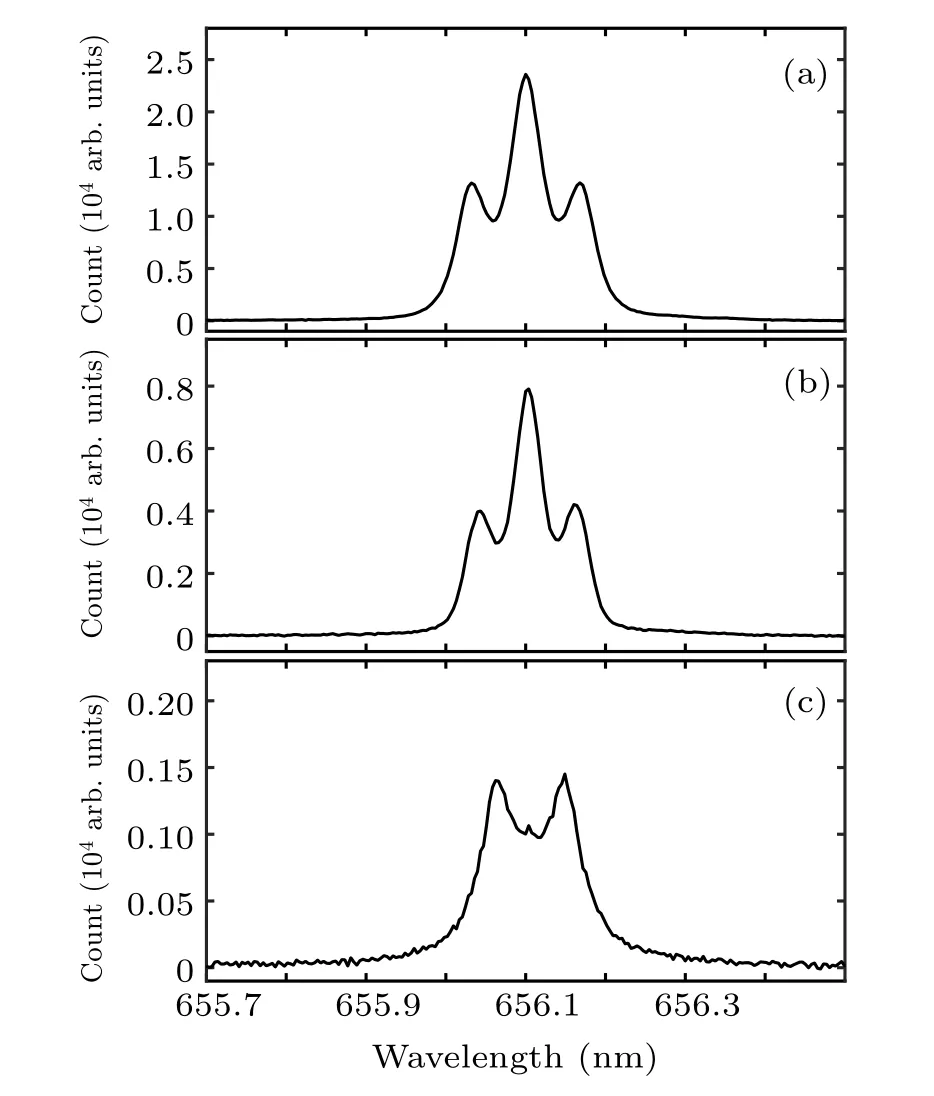
Fig.1. Three kinds of the asymmetry of Dα emission spectra.
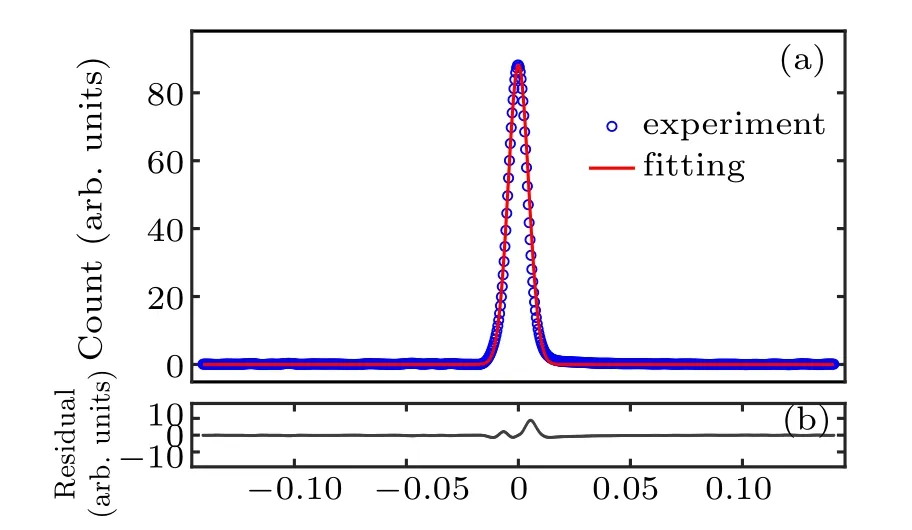
Fig.2. The fitting of the instrument function of the OSMA(channel 8)and the fitting residual are shown in panels(a)and(b),respectively.
3.2. Fitting of the asymmetric Dα spectra
In Fig.1(a), the plasma was operated in lower single null (LSN) divertor configuration with ion gradient drift B×∇B ↓. The 4.6-GH low hybrid current drive (LHCD,2.3 MW) heating system was used as auxiliary heating, the toroidal magnetic field strength B0was −2.48 T at the major radius of R0=1.85 m(magnetic axis),plasma current Ipwas 450 kA,the core electron temperature Tewas 1.2 keV and the line-averaged electron density newas 3.8×10¹⁹m−3. The instrument broadening was about 0.0106 nm for the 8th viewing chord. The Dαspectra was fitted and the results were also shown in Fig.3. According to the fitting results, the viewing angle θ was 74.4◦.The intensity of magnetic filed at two spectral emission positions (HFS and LFS) were BHFS=3.44 T and BLFS=1.95 T, respectively. It could be used to acquire the emission position by using the EFIT code to calculate the spatial magnetic field intensity distribution in poloidal section,which was done in our previous work and not discussed in this paper. The experimental data and the fitting curve of the Dαspectra were shown in Fig.3(a),and the recovery spectra from HFS and LFS were also shown here. According to fitting calculations, the spectra from the HFS region accounted for 90.5% of the total spectra, and that from the LFS accounted for 9.5%. The fitting residual of the spectra was given in Fig.3(b). The three energy categories (the cold, warm and hot) of the emission spectra from two separate regions (HFS and LFS)were shown in Figs.3(c)and 3(d),respectively. The proportion of the cold,warm and hot energy categories of the spectra from HFS were 0.89 eV (35.7%), 3.72 eV (44.5%)and 84.63 eV(10.3%),respectively. For the spectra from LFS,they were 1 eV(3.7%),2.57 eV(4.7%),and 10.14 eV(1.1%),respectively. In the experiment, the wavelength of observed spectra was lack of an absolute wavelength reference and the values of the wavelength were calculated by the program of OSMA system. Therefore, the flow velocity of each energy category was the relative flow velocity which was calculated by the Doppler shift of the spectra from HFS and LFS in this paper. The relative flow velocity of three energy categories were estimated at about 2.3 km/s (cold), 4.4 km/s (warm),19.2 km/s(hot).
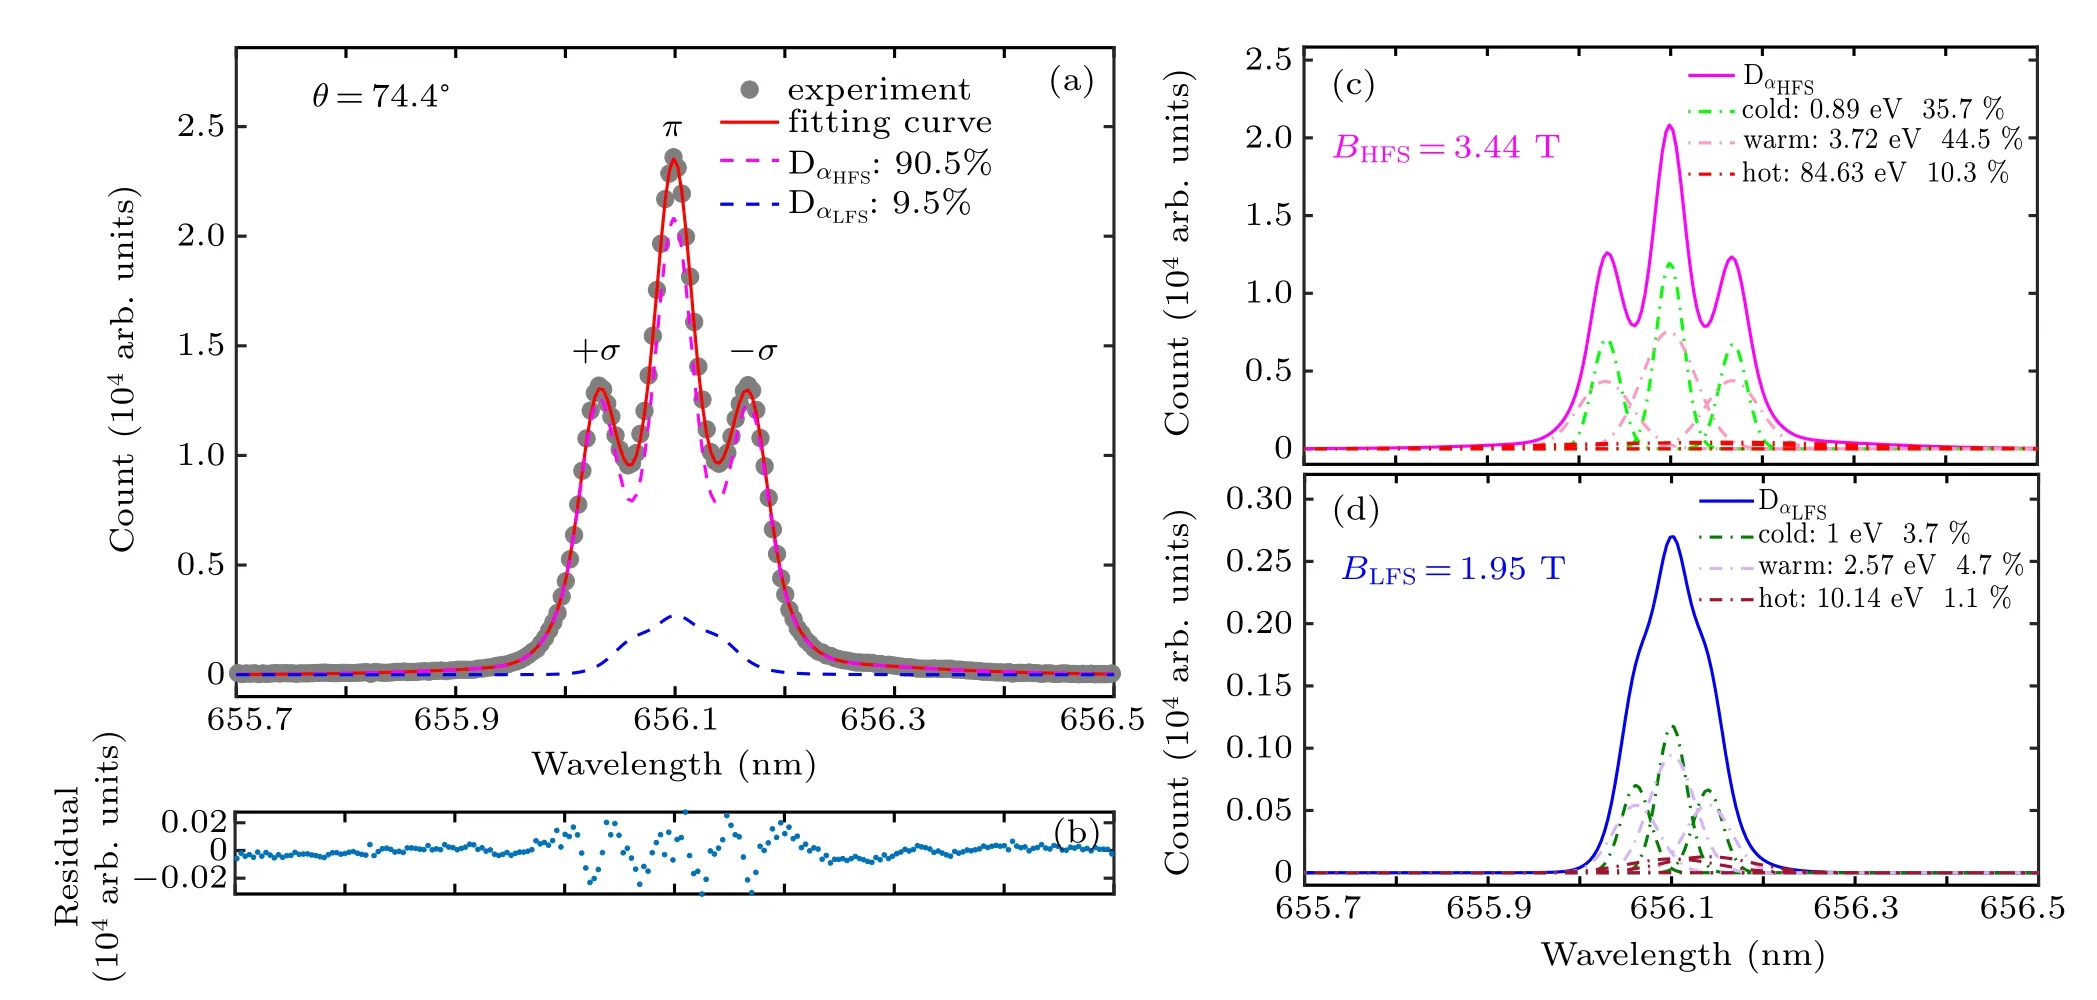
Fig.3. Beat fit of the Dα emission spectra by the algorithm. (a)The grey dots correspond to the measured Dα spectral line subtracting at t =4 s of shot#55940,the red line represents the fitting curve,and the carmine and blue dotted lines are the recovery spectra from HFS and LFS;(b)the fitting data residual is given;each recovery lines and proportion of three energy categories(the cold,warm,and hot)in HFS and LFS are given in panels(c)and(d),respectively.
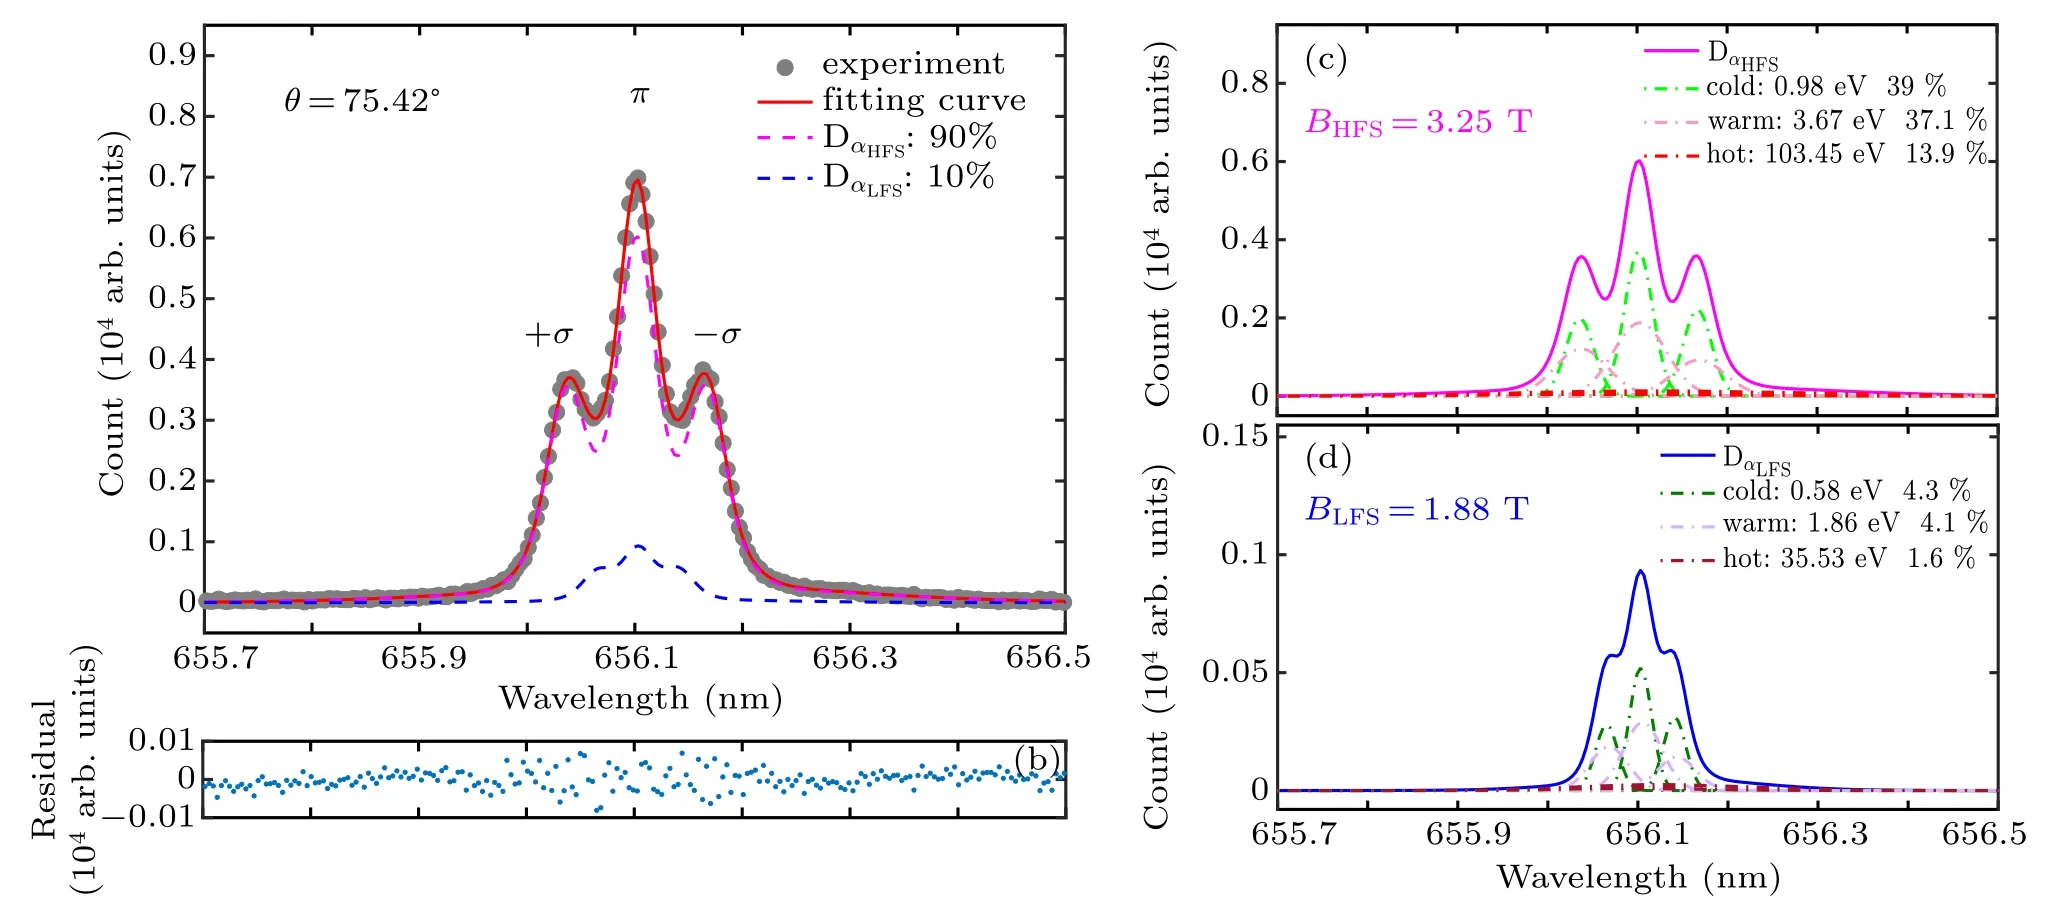
Fig.4. Beat fit of the Dα emission spectra. (a)The grey dots correspond to the measured Dα spectral line at t=4 s of shot#55930,the red line represents the fitting curve,and the carmine and blue dotted lines are the recovery spectra from HFS and LFS;(b)the fitting data residual is given;each recovery lines and proportion of three energy categories(the cold,warm,and hot)in HFS and LFS are given in panels(c)and(d),respectively.

Fig.5. Beat fit of the Dα emission spectra. (a)The grey dots correspond to the measured Dα spectral line at t=4 s of shot#55930,the red line represents the fitting curve,and the carmine and blue dotted lines are the recovery spectra from HFS and LFS;(b)the fitting data residual is given;each recovery lines and proportion of three energy categories(the cold,warm,and hot)in HFS and LFS are given in panels(c)and(d),respectively.
In Fig.1(b), The plasma was operated in lower single null (LSN) divertor configuration and heated by LHCD(4.6 GH, 2.2 MW). The toroidal magnetic field strength B0was −2.45 T at the major radius of R0=1.84 m (magnetic axis), plasma current Ipwas 400 kA, the core electron temperature Tewas 2 keV and the line-averaged electron density newas 3.0×10¹⁹m−3. The instrument broadening was about 0.0104 nm for the 7th viewing chord. The Dαspectra was fitted and the results were shown in Fig.4. According to the fitting results, the viewing angle θ was 75.42◦. BHFSand BLFSwere about 3.25 T and 1.88 T,respectively. The spectra from the HFS and LFS regions accounted for 90%and 10%of the total spectra. The proportion of three energy categories of the spectra from HFS were 0.98 eV(39%),3.67 eV(37.1%),and 103.45 eV (13.9%), respectively. For the spectra from LFS,they were 0.58 eV(4.3%),1.86 eV(4.1%),and 35.53 eV(1.6%), respectively. The relative flow velocity of three energy categories were estimated at about 2.4 km/s(cold),4 km/s(warm),11.1 km/s(hot).
In Fig.1(c), The plasma operated conditions were the same as in Fig.1(b). The instrument broadening was about 0.0139 nm for the 14th viewing chord. The Dαspectra was fitted and the results were shown in Fig.5. This fitting results were totally different from the fitting in Ref. [23] and the reason would be discussed below. According to the fitting results,the viewing angle θ was 42.92◦. BHFSand BLFSwere about 2.89 T and 2.05 T,respectively. The spectra from the HFS and LFS regions accounted for 78.8%and 21.2%,respectively. The proportion of three energy categories of the spectra from HFS were 0.96 eV (30.9%), 9.96 eV (27.3%)and 124.83 eV (20.6%), respectively. For the spectra from LFS,they were 0.29 eV(8.3%),1.25 eV(7.3%)and 95.57 eV(5.6%),respectively.The relative flow velocity of three energy categories were estimated at about 0.2 km/s (cold), 2.6 km/s(warm),5.4 km/s(hot).
According to the fitting results, the viewing angle θ did not equal 90 degrees which proved that the angle needed to be considered in the algorithm. From the figure, the asymmetry of the spectral lines were characterized by the asymmetry of two σ components. Compared the lineshape and the proportion of three energy categories of the emission spectra,the observed spectra in poloidal section (Figs. 1(a) and 1(b))were quite different from that in toroidal section (Fig.1(c)).In Figs.3 and 4,the lineshape of observed spectra in poloidal section was π component greater than two σ components and the asymmetry of the spectral line was+σ component greater than −σ component(Fig.3)or in turn(Fig.4). According to the fitting results,the emission spectra were dominated by the cold and warm energy categories and the contribution of the hot energy category to the emission spectra was smaller than the other two energy categories,which meant that the recombination and dissociation processes were dominated in boundary recycling. In Fig.5, the lineshape of observed spectra in toroidal section was π component less than two σ components which could be explained by the effect of the viewing angle θ in this work. It was totally different from the data analysis in Ref.[23],in which the viewing angle was not mentioned and the non-Maxwellian distribution of the atoms was accounted for the spectral lineshape. Compared with the fitting results of Figs. 3 and 4, the contribution of hot energy category to the whole spectra increased significantly and the proportion of three energy categories was the same,which meant the boundary recycling in this observed region was completely different from that in Figs.3 and 4. It well illustrated that the boundary recycling was localized. In the algorithm, the neutral atoms were followed the Maxwell distribution and I+σ/=I−σwas assumed in plasma spectra,so the asymmetry of the emission spectra was mainly caused by the viewing angle θ, the magnetic field B,and Doppler shift of wavelength of each energy category, which were considered in the algorithm could well satisfy the fitting and analysis of spectral data in the present work.
The time dependence of the Dαemission spectra (channel 8, #55937) were fitted by the algorithm from t =2.35 s to 8.45 s in which the plasma was in flattop and the emission spectra had a good signal-to-noise to reduce the fitting error.Based on the algorithm, the time dependence of the viewing angle θ,the proportion of the Dαspectra with the corresponding magnetic filed B (HFS and LFS) and the proportion of three energy categories of the emission spectra(HFS and LFS)in plasma discharge were acquired and shown in Figs. 6(a),6(b),and 6(c),respectively. From the figure,it could be found that these parameters did not change significantly over the time when t <4.5 s that meant the boundary recycling was remained stable and the plasma was under good control. After that(t>4.5 s),the parameters started to fluctuate slightly that meant the boundary recycling started to change, the plasma control become unstable and then the plasma was disrupted in the end. In Fig.6(c), it could be found that the proportion of three energy categories of the emission spectra in LFS did not change too much, and the main change came from the spectra in HFS.For the spectra in HFS,the proportion of the warm category fluctuated greatly compared with that of the other two energy categories and the change of the warm category was contrary to that of the cold and hot categories, which meant dissociation process was dominated in boundary recycling in HFS and might be the main reason for the plasma instability after t >4.5 s. According to the above analyses, it could be found that the line-averaged Dαemission spectra were dominated by the spectra in HFS and the boundary recycling in HFS was more active than that in LFS.At meanwhile, the left and right far wings of the spectral line were only from HFS and this conclusion was similar with the hypothesis in Ref.[13].Based on the spectroscopic methodology, the proposed algorithm in this work could be used as a tool to analyze the spectra under the Zeeman effect to study the boundary recycling on EAST.
In the process of spectral data fitting analysis, we also found that the ratio of the spectral line intensity in HFS and LFS (IHFS/ILFS) had a relationship with the ratio of the corresponding magnetic field the intensity (BHFS/BLFS). So, a simple statistics of the fitting results was done in this work which was fitted by a polynomial fitting and shown in Fig.7.In the figure,the fitting result was good and the error bars for x and y axes were also given. A conclusion could be acquired from the fit that the (IHFS/ILFS) was roughly proportional to(BHFS/BLFS)4which would be useful for us to deal with the line-averaged emission spectra under the effect of an external magnetic field because of the increasing intensity of magnetic field on EAST,even for the CFETR in the future.
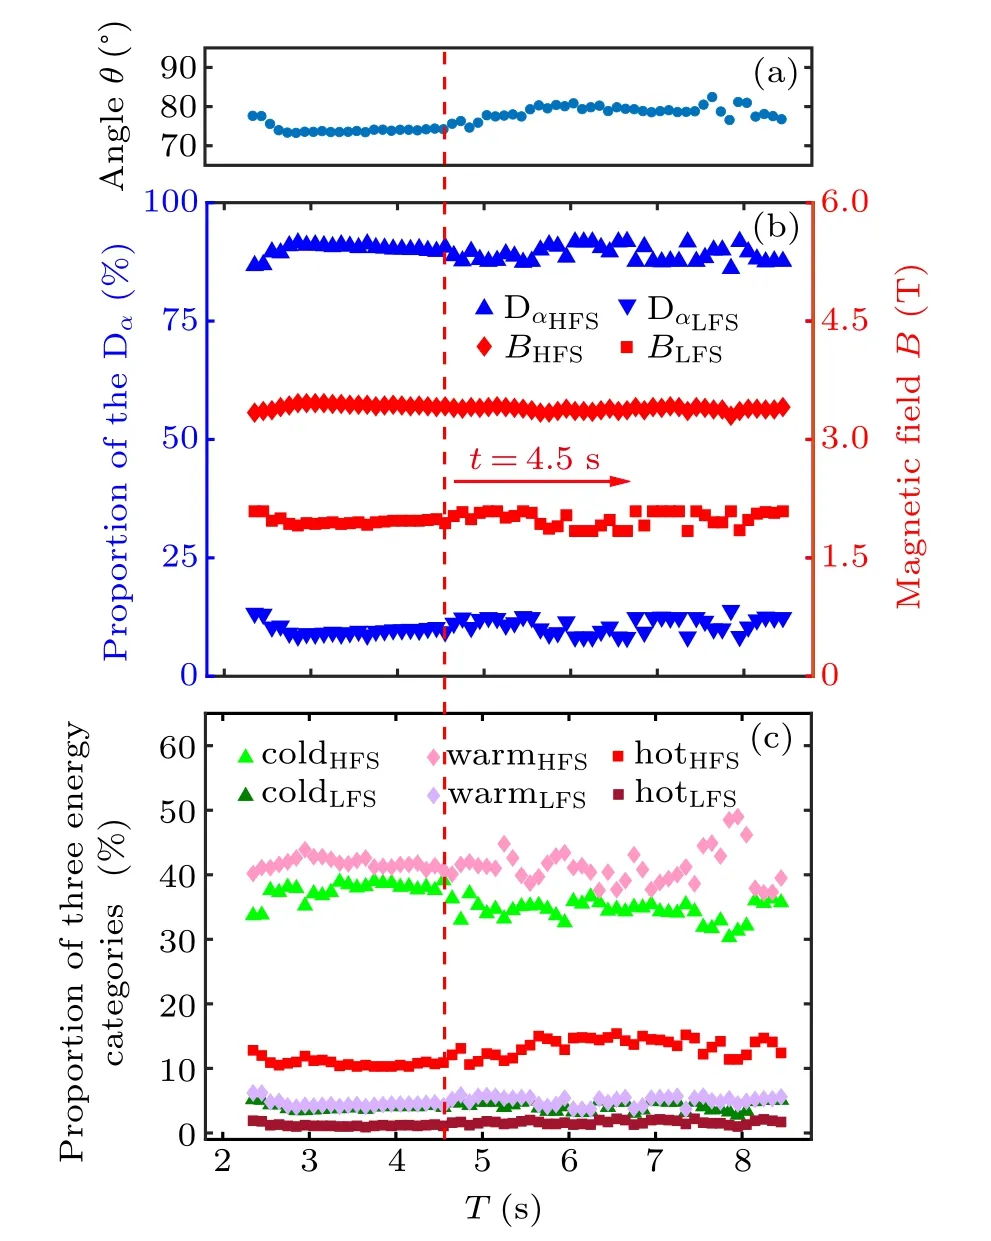
Fig.6. The time dependence of the viewing angle θ, the proportion of the Dα spectra with the corresponding magnetic field B (HFS and LFS), and the proportion of three energy categories in shot #55937 (channel 8) were shown in panels(a),(b),and(c).
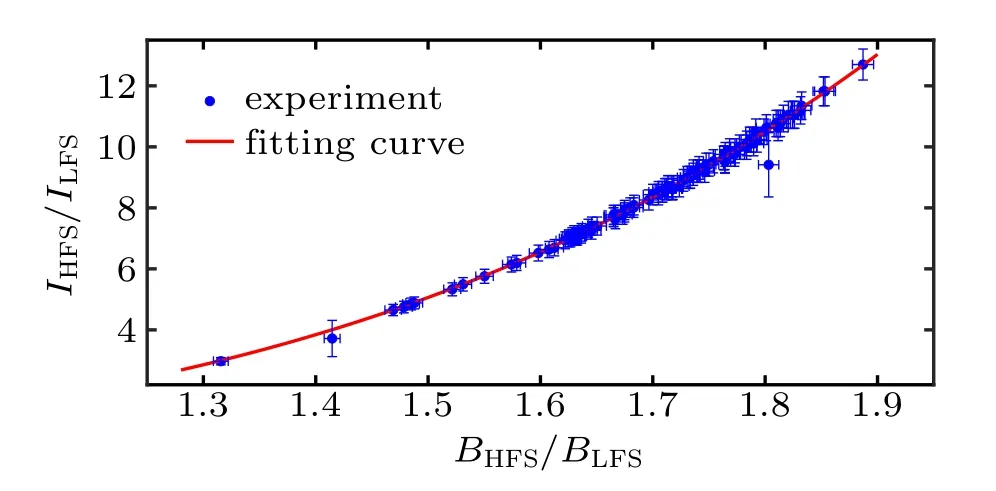
Fig.7. The relationship between the ratio of the Dα emission spectra intensity and the ratio of the magnetic field intensity at two emission positions.
4. Conclusion
The asymmetry of Dαemission spectra under the Zeeman effect with all polarization components(π and±σ)were observed in diverted configuration on EAST tokamak. To understand the asymmetric phenomena of the emission spectra and acquire the local plasma information, an algorithm was proposed and used to fit the spectra. In the algorithm,the neutral atoms were considered to follow the Maxwell distribution,and I+σ/=I−σwas assured and used. Based on the built algorithm, the viewing angle θ, the intensity magnetic field at two different emission positions, the proportion and the relative flow velocity of each energy category of the Dαspectra in HFS and LFS were acquired in boundary region. According to the algorithm, the reason of the asymmetry of the emission spectra was caused by the viewing angle, the magnetic field and Doppler shift of the spectral lines. A simple statistics of the fitting results was also done and a conclusion was obtained that the ratio of the Dαemission spectra intensity(I)in HFS and LFS has a relationship with that of the corresponding magnetic filed intensity(B)at two emission positions,which was useful for us to deal with the emission spectra under the Zeeman effect on EAST.In the future,this technique would be extend to the hydrogen-like plasma discharge(i.e.,He plasma)with the increasing intensity of magnetic field on EAST.
Acknowledgments
The authors would like to acknowledge the support and contributions from the rest of the EAST team and collaborators.
杂志排行

Chinese Physics B的其它文章
- Novel traveling wave solutions and stability analysis of perturbed Kaup–Newell Schr¨odinger dynamical model and its applications∗
- A local refinement purely meshless scheme for time fractional nonlinear Schr¨odinger equation in irregular geometry region∗
- Coherent-driving-assisted quantum speedup in Markovian channels∗
- Quantifying entanglement in terms of an operational way∗
- Tunable ponderomotive squeezing in an optomechanical system with two coupled resonators∗
- State transfer on two-fold Cayley trees via quantum walks∗