[C3mim][NTf2]/DEC/[Li][NTf2]体系的基础性质
2020-12-25惠淑荣赵丽薇刘青山宋大勇
惠淑荣,赵丽薇,刘青山,宋大勇
1沈阳农业大学理学院,沈阳 110866
2湖州师范学院生命科学学院,浙江 湖州 313000
1 Introduction
Ionic liquids (ILs) as salt have shown completely of ions and existed as liquid at room temperature. They have shown exceptional physical and chemical performances (low melting point, negligible volatility, excellent solubility, prominent thermal stability, good conductivity)1-5. These properties can be tuned by regulation and controlling their chemical structureetc.,which can be made their use particularly attractive in industrial and scientific communities. Compared with the traditional organic solvents, ILs has many outstanding advantages and have often been used for many special fields as green solvents.
Until now, many papers have also published information on the properties of ILs mixture systems, such as density, refractive index, viscosity, and conductivity6-8. These properties have provided valuable information about the combination of ILs with solvents, such as ion-ion, ion-solvent and solvent-solvent interactions. The above results are fundamental for understanding reaction rates or equilibria. Furthermore, these studies are helpful in analyzing, designing, predicting, and characterizing new ILs structures and properties.
As the hydrophobic and stable IL, 1-propyl-3-methylimidazolium bis[(trifluoromethyl)sulfonyl]imide ([C3mim][NTf2]) have been used for liquid-liquid separating of ethanol from ethanol and hexane solution9, extraction of ethanol from heptane10, corrosion inhibition of mild steel11, separating of benzene and hexane mixture system12. The surface tension and density of [C3mim][NTf2] were measured at different temperature13. The basic physical properties of the[C3mim][NTf2] HIL have been studied for itself and binary systems with traditional solvents, like monohydric alcohol,dihydric avie.lcohol, and ternary alcohol,etc.14. The basic properties of [C3mim][NTf2] + γ-butyrolactone system have also been measured and studied at given temperature at one bar pressure15. Esperançaet al.have studied the influence of pressure and cation’s length on several properties on [C3mim][NTf2] IL16.
As the environmentally benign chemical and safe substitute for hazardous chemicals, diethyl carbonate (DEC) solvent can be used in a great many fields17-20, for example, lithium battery technology, chemicals synthesis, and dissolution reagentetc.Lithium bis[(trifluoromethyl)sulfonyl]imide have been applied in battery of lithium ion as the stable salt. The battery has shown the excellent performances in the light of cycle times and retention capacity21,22.
Due to the good properties and wide application fields of chemicals (IL, DEC, and [Li][NTf2]) and the insufficiency of knowledge of mixtures properties, the discussion of the basic solution properties is very necessary. This work has discussed the density, viscosity, conductivity, and other thermodynamics(melting, glass, and semi-stable temperatures) for binary and ternary systems of IL, DEC, and [Li][NTf2]. The aim is to increase the amount of data available for binary and ternary systems in the given temperature to better understand the basic property changing.
Based on the above, the eight systems of [C3mim][NTf2],DEC, and [Li][NTf2] were prepared. The glass temperature,semi-stable temperature, lithium ion self-diffusion coefficient,density, viscosity, and conductivity of the eight systems have also been studied. The thermal expansion coefficients of solution were also gained on the basis of measured density. The influence of DEC on the microstructure of the system was discussed by molecular dynamics simulation. This work helps to expand the absence database of studied solution in order to optimize the group contribution models including the structural and interaction parameters.
2 Experimental
2.1 Materials
1-propyl-3-methylimidazolium cloride ([C3mim][Cl])structure was determined by1H-NMR spectrogram and shown in Fig. S1 (Supporting Information). The salt [C3mim][Cl] was used for synthesis of 1-propyl-3-methylimidazolium bis[(trifluoromethyl)sulfonyl]imide ([C3mim][NTf2]).[C3mim][NTf2], lithium bis[(trifluoromethyl)sulfonyl]imide([Li][NTf2]), and diethyl carbonate (DEC) were used for solution preparation. The quality and source of [C3mim][Cl],[C3mim][NTf2], [Li][NTf2], and DEC have been determined and shown in Table 1.
2.2 [C3mim][NTf2] Preparation
The synthesis process of IL [C3mim][NTf2] referred to the ion exchange method from literatures23-26. About 60 g of[C3mim][Cl] and 50 mL dichloromethane (CH2Cl2≥ 99.9%,Aladdin Industrial Inc., Shanghai, China) was mixed and poured into the distilled water (about 25 mL) with 250 mL flask. After no solid in the flask, the [Li][NTf2] salt was also dissolved in distilled water (about 25 mL) and poured into the flask. The double layer solution was strongly stirred for 1 h. The viscous bottom layer liquid was washed about 10 times by employing distilled water. The chloride ion (Cl-) cannot be found after adding AgNO3(≥99%, Aladdin Industrial Inc., Shanghai, China)+ HNO3(≥99%, Aladdin Industrial Inc., Shanghai, China) + H2O solution (the Cl-content ≤ 50 × 10-6). The synthesized HIL[C3mim][NTf2] were colorless and clear liquid after finally drying in high vacuum for 48 h at 353 K. [C3mim][NTf2]structure was determined by1H-NMR spectrogram and shown in Fig. S2 (Supporting Information). The water content was characterized by C20S Karl Fischer Coulometric Titrator(Mettler Toledo, Switzerland) in [C3mim][NTf2]. The water content is less than 10-4by mass. The structures of[C3mim][NTf2], [Li][NTf2] and DEC are shown in Fig. 1.
2.3 Solution preparation
The four systems of [C3mim][NTf2] + DEC were prepared bythe volume amounts and the volume ratios are 1 : 0, 1 : 1, 3 : 2 and 2 : 1 for IL to DEC. The [Li][NTf2] salt were added to about 1.0000 mol·kg-1molality in the above four systems, the mole fraction uncertainties are less than ±0.0002. The weight was determined by electronic digital balance (G&G America, model:JJ224BC, ±10-4g). The 8 mL volume solution was prepared and used for accurate property determination. The final solution number are eight systems and listed in Table 2.

Table 1 The purity (by mass), molecular weight (MW), and company name (Source) of the materials and products ILs [C3MIM][NTf2].

Fig. 1 The structures of [C3mim][NTf2], [C3mim][Cl],[Li][NTf2], and DEC.
2.4 DSC measurement
The thermodynamic properties were determined by Discovery DSC (differential scanning calorimetry) 25 TA precision Instrument equipped (TA Instruments Company, USA). The scanning rate is 5 K·min-1by using nitrogen protection from 153 to 373 K. The DSC curve lines are shown in Fig. 2.
2.5 Lithium ion self-diffusion coefficient measurement
The7Li-NMR spectrogram were measured at temperature 298 K by Bruker Avance III 600 MHz spectrometer instrument(Bruker Corporation, Germany) with a 5 mm BBO probe, a7Li frequency of 233.23 MHz according to following equation and literature27:

whereIis the observed intensity,I0the reference intensity(unattenuated signal intensity),Dthe diffusion coefficient,γthe gyromagnetic ratio of the observed nucleus,gthe gradient strength,δthe length of the gradient, andΔthe diffusion time.To simplify this equation some parameters are often combined.The lithium ion self-diffusion coefficients are also listed in Table 2.
2.6 Density, viscosity, and conductivity measurement
The density, viscosity, and conductivity of the eight systems were measured and carried according to our previous papers23-26.The detailed process has been given in Supporting Information.The measurement values are shown in Table 3 for density, Table 4 for viscosity, and Table 5 for conductivity, respectively.
According to the literature28, the standard uncertainty of the density is 0.001200 g·cm-3at 0.68 confidence level. The relativestandard uncertainties are better than 0.01 for viscosity and 0.015 for conductivity at 0.95 confidence level, respectively.
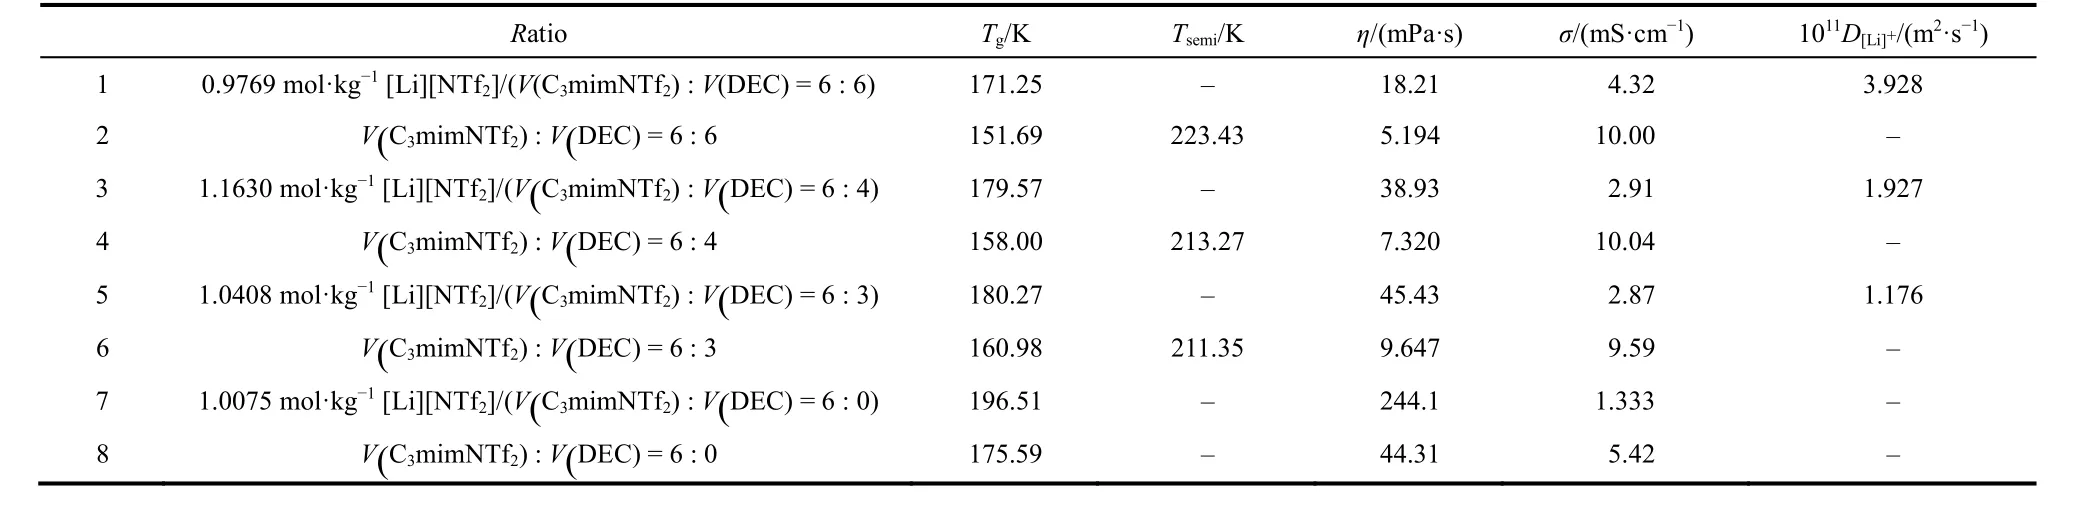
Table 2 The glass temperature, T/K, and lithium ion self-diffusion coefficient, D[Li]+ of the eight systems at 298 K.

Fig. 2 Plot of DSC vs T of ILs at temperature from -150 to 100 °C.■: 1; □: 2; ●: 3; ○: 4; ▲: 5; Δ: 6; ▼: 7; ▽: 8. Color online.
The density, viscosity, and conductivity values of the pure IL[C3mim][NTf2] are also compared and shown in Table 6 with literature9,10,14-16.
2.7 Computational details
MD simulations were carried out by Gromacs 2018.429.OPLS-AA forcefield30was used for [Li][NTf2], [C3mim][NTf2]and DEC. The force field parameterizations are reported in Table S1 (Supporting Information). Van der Waals interactions were handled with a cutoff distance of 1.4 nm and Ewald method was used for treating coulombic interactions. Simulation procedure was developed in three stages: i) the initial structure of the simulation was randomly placed [C3mim]+, [Li]+, DEC,[NTf2]-in the box by Packmol software31. Energy minimization to relax the strained contacts in initial configuration was performed with the steepest descent minimization algorithm. ii) all systems were heated at 500 K for 2 ns and subsequently cooled from 500 to 298 K within 2 ns.Afterward, NPT equilibration was done for 10 ns with 2 fs time step at 298 K. iii) another NPT simulation for 30 ns was performed to obtain the structural properties from the generated trajectory.
3 Results and discussion
In Table 6, the values of the density, viscosity, and conductivity are compared with literature9,10,14-16at measurement temperature range. For density, most of the deviations are less than 0.07% except some data from literature 16 (21 data are less than 0.07% and 5 data are in the range of 0.07% to 0.15%). For viscosity, all of the deviations are less than 6.10% (10 data are less than 2.00% and 7 data are in the range of 2.00% to 6.10%). For conductivity, all of the deviations areabout 20% and all of the values are higher than the literature 15.

Table 3 Experimental density (ρ) for the eight systems from 288.15 to 348.15 K at atmosphere pressure (p = 101.3 kPa).
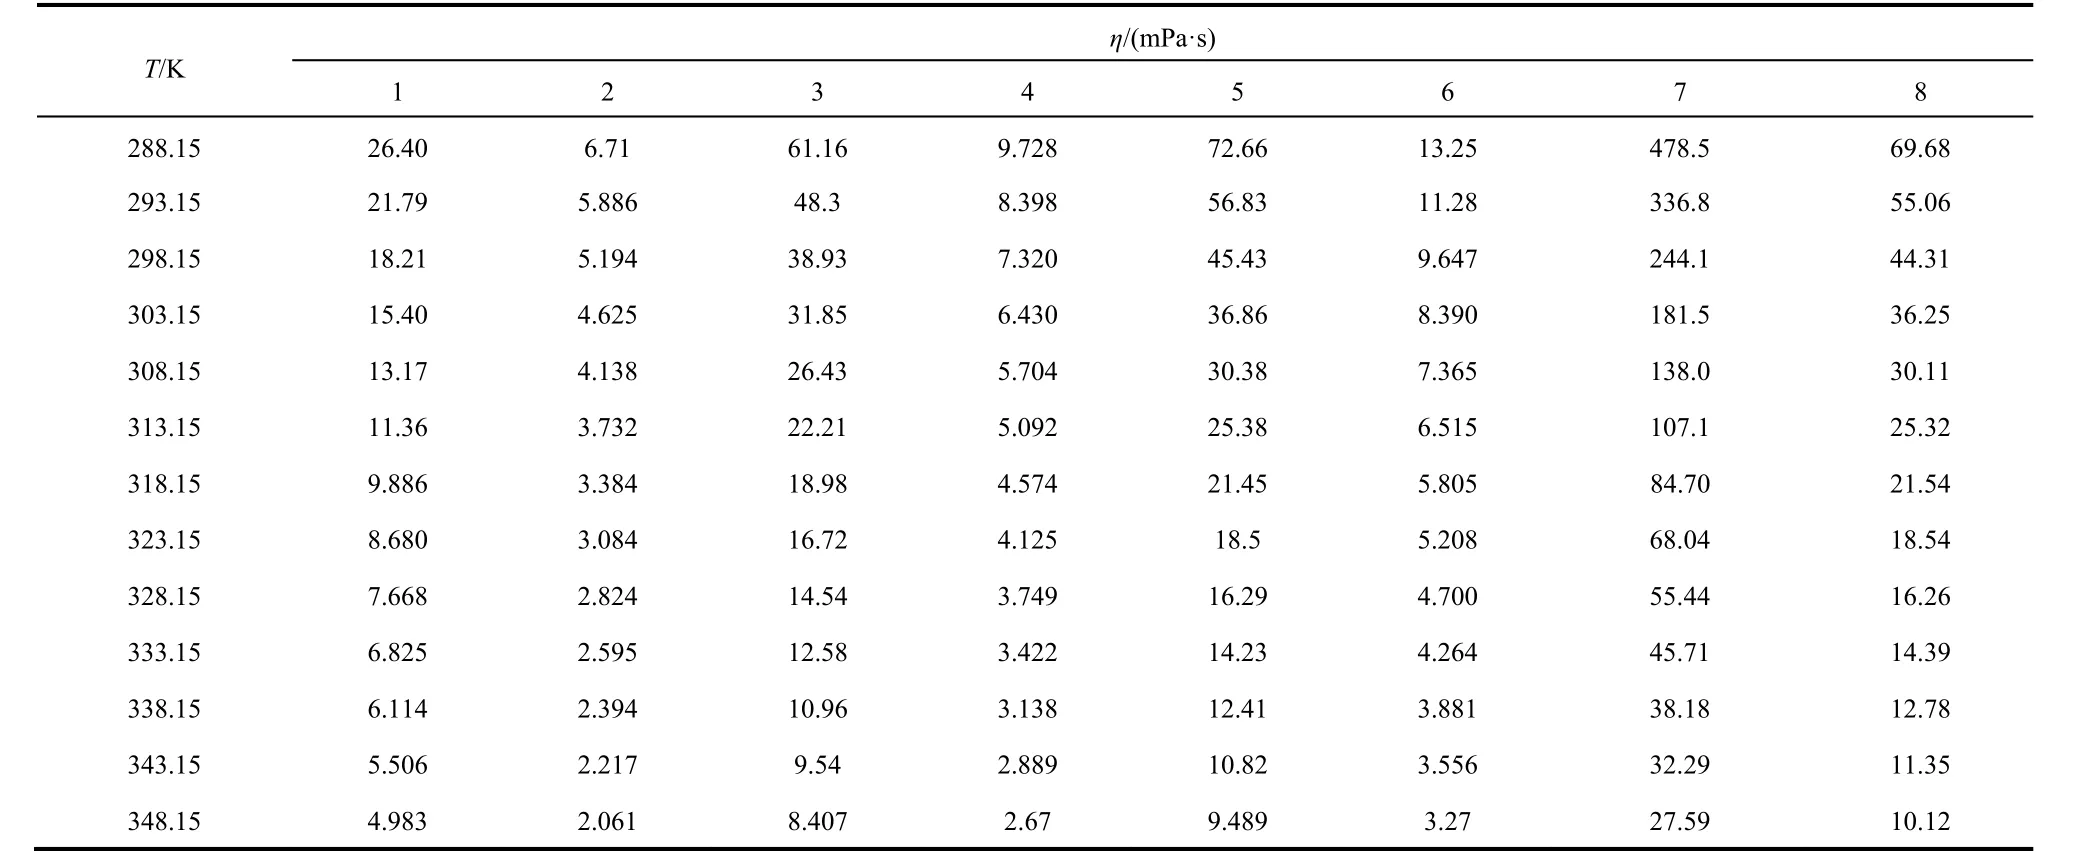
Table 4 Experimental values of dynamic viscosity (η) of the eight systems from 288.15 to 348.15 K at atmosphere pressure (p = 101.3 kPa).

Table 5 Experimental values of electrical conductivity (σ) of the eight systems from 288.15 to 348.15 K at atmosphere pressure (p = 101.3 kPa).
3.1 DSC and lithium ion self-diffusion coefficients
From the Fig. 2, All of the systems have not the melting temperature from the DSC curves. However, the glass temperatures and semi-stable temperatures can be found from the DSC curves. From the Table 2, the glass temperatures are 171.25 K for system 1, 151.69 K for system 2, 179.57 K for system 3, 158.00 K for system 4, 180.27 K for system 5, 160.98 K for system 6, 196.51 K for system 7, and 175.57 K for system 8, respectively. The tendency is 1 < 3 < 5 < 7 for lithium salt systems and 2 < 4 < 6 < 8 for non-lithium salt systems. The DSC curves shown that the glass temperatures increase with the IL concentration increasing. The glass temperatures of the lithium salt system are higher than non-lithium salt systems.
The semi-stable temperatures can be observed for systems 2,4, and 6. And the values are 223.43 K for system 2, 213.21 K for system 4, and 211.35 K for system 6. The DSC curves shown that the semi-stable temperatures decrease with the IL concentration increasing in non-lithium salt systems. The semistable temperatures of the lithium salt and pure IL cannot be found in the DSC curves. According to the glass temperatures and semi-stable temperatures, the eight systems can be existed as liquid at lower temperature.
From the Table 2, the lithium ion self-diffusion coefficients decrease following the IL concentration increasing. The lithium ion self-diffusion coefficient of the system 7 was not obtained according to the instrument.
3.2 Density
From the Table 3 and Fig. 3, the density of the eight systems decrease with temperature increasing. The density of the lithium salt systems has shown the higher value than non-lithium salt systems. The tendencies of the density are 1 < 3 < 5 < 7 for lithium salt systems and 2 < 4 < 6 < 8 for non-lithium salt systems.
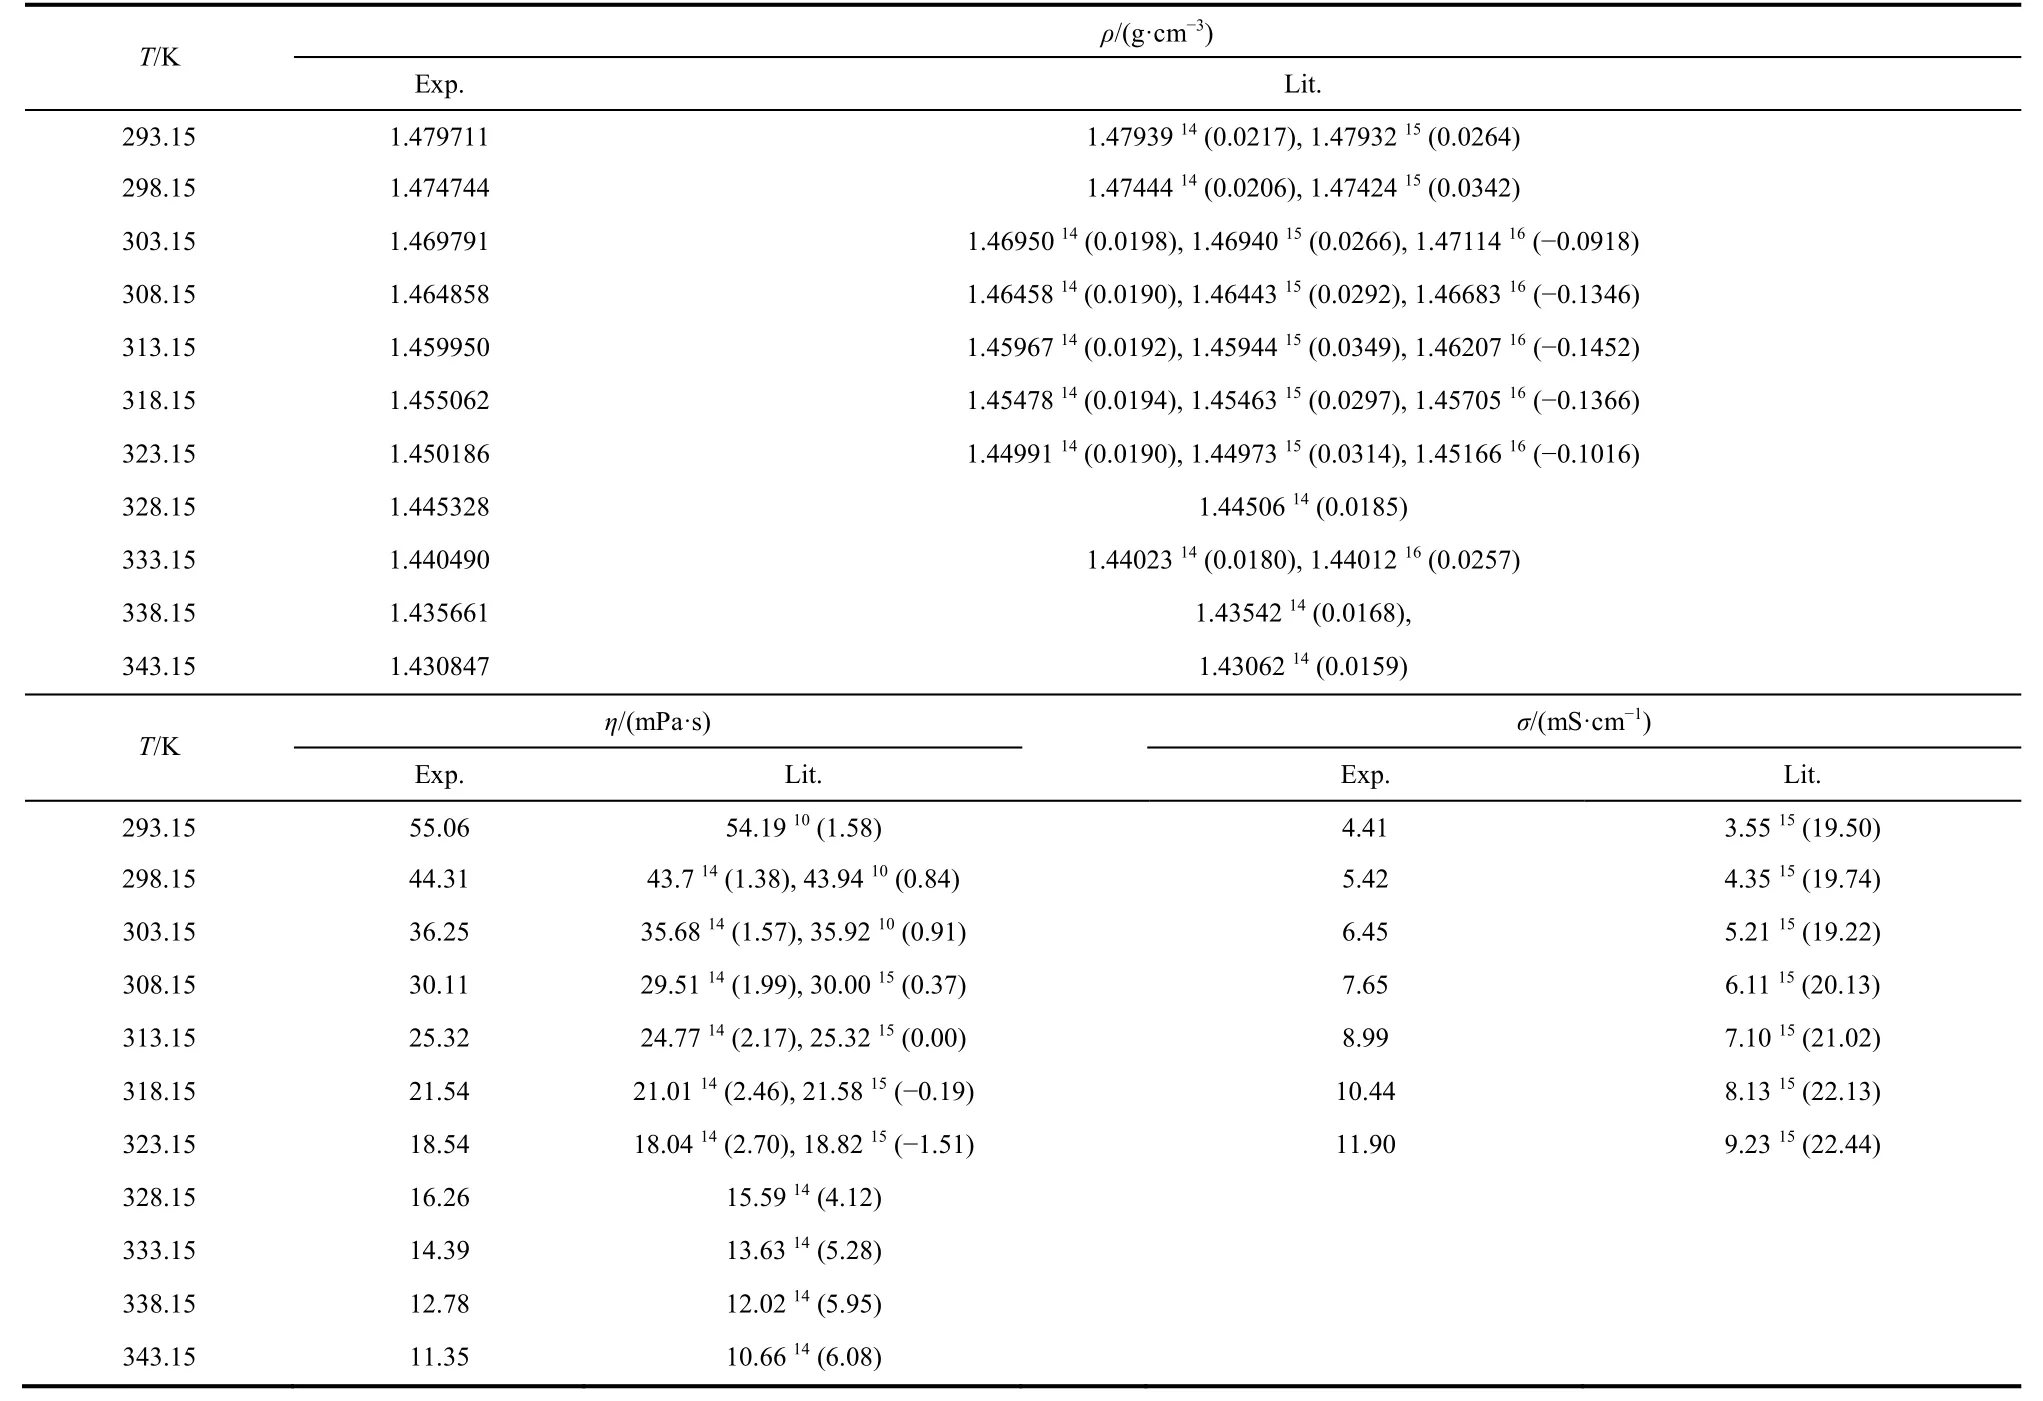
Table 6 The comparison of density (ρ), viscosity (η), and conductivity (σ) of IL [C3mim][NTf2] with the literature values at T = 293.15 to 343.15 K at atmosphere pressure (p = 101.3 kPa).
According to the following equation, the eight straight lines of the systems can be fitted and obtained according to plot density,ρ/(g·cm-3), against measured temperature,T/K.
ρ=A+BT(1)herein,AandB, fitted constants,T, the measurement temperature.AandBvalues are shown in Table 7. As shown in Table 7, the correlation coefficient values are better than 0.99994, it indicates that the above equation can be applied for fitting very well for the eight systems density.
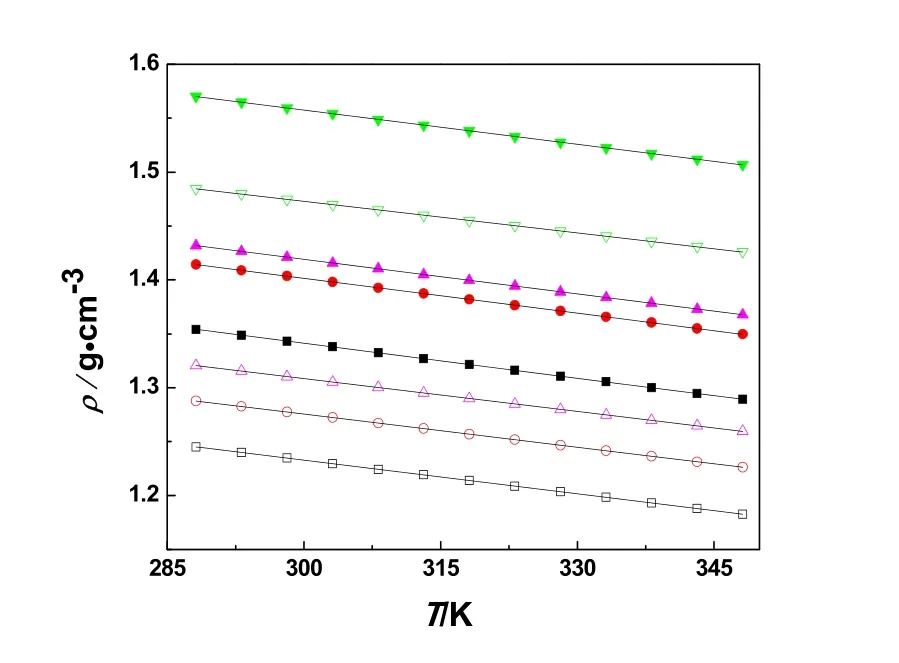
Fig. 3 Plot of ρ vs T systems at temperature from 288.15 to 348.15 K.■: 1; □: 2; ●: 3; ○: 4; ▲: 5; Δ: 6; ▼: 7; ▽: 8.
According to the following empirical equation, the thermal expansion coefficient,α/K-1, can be fitted and obtained of the eight systems:

whereαis the thermal expansion coefficient. The obtained values are listed in Table 8. From the Table 8, the values of the thermal expansion coefficient decrease with the increasing temperature and are in the range of 6.50 ×10⁻⁴to 8.40 ×10⁻⁴K-1.
3.3 Viscosity
From the Table 4 and Fig. 4, the viscosity of the eight systems decrease with temperature increase like the density.
The VFT equation can usually be used for the fitting of temperature dependence on the viscosity. The equation is below:

whereη/(mPa·s) is the viscosity;η0/(mPa·s),B/K, andT0/K are the fitting parameters. The best fitting parameters ofη0,B,T0,and the corresponding correlation coefficient,R, of the eight systems are also listed in Table 7. From Table 7, the obtained values of the correlation coefficient,R, are higher than 0.99993 except system 3 (the value is 0.99985), which indicates that the VFT equation can be used for fitting the experimental viscosity.
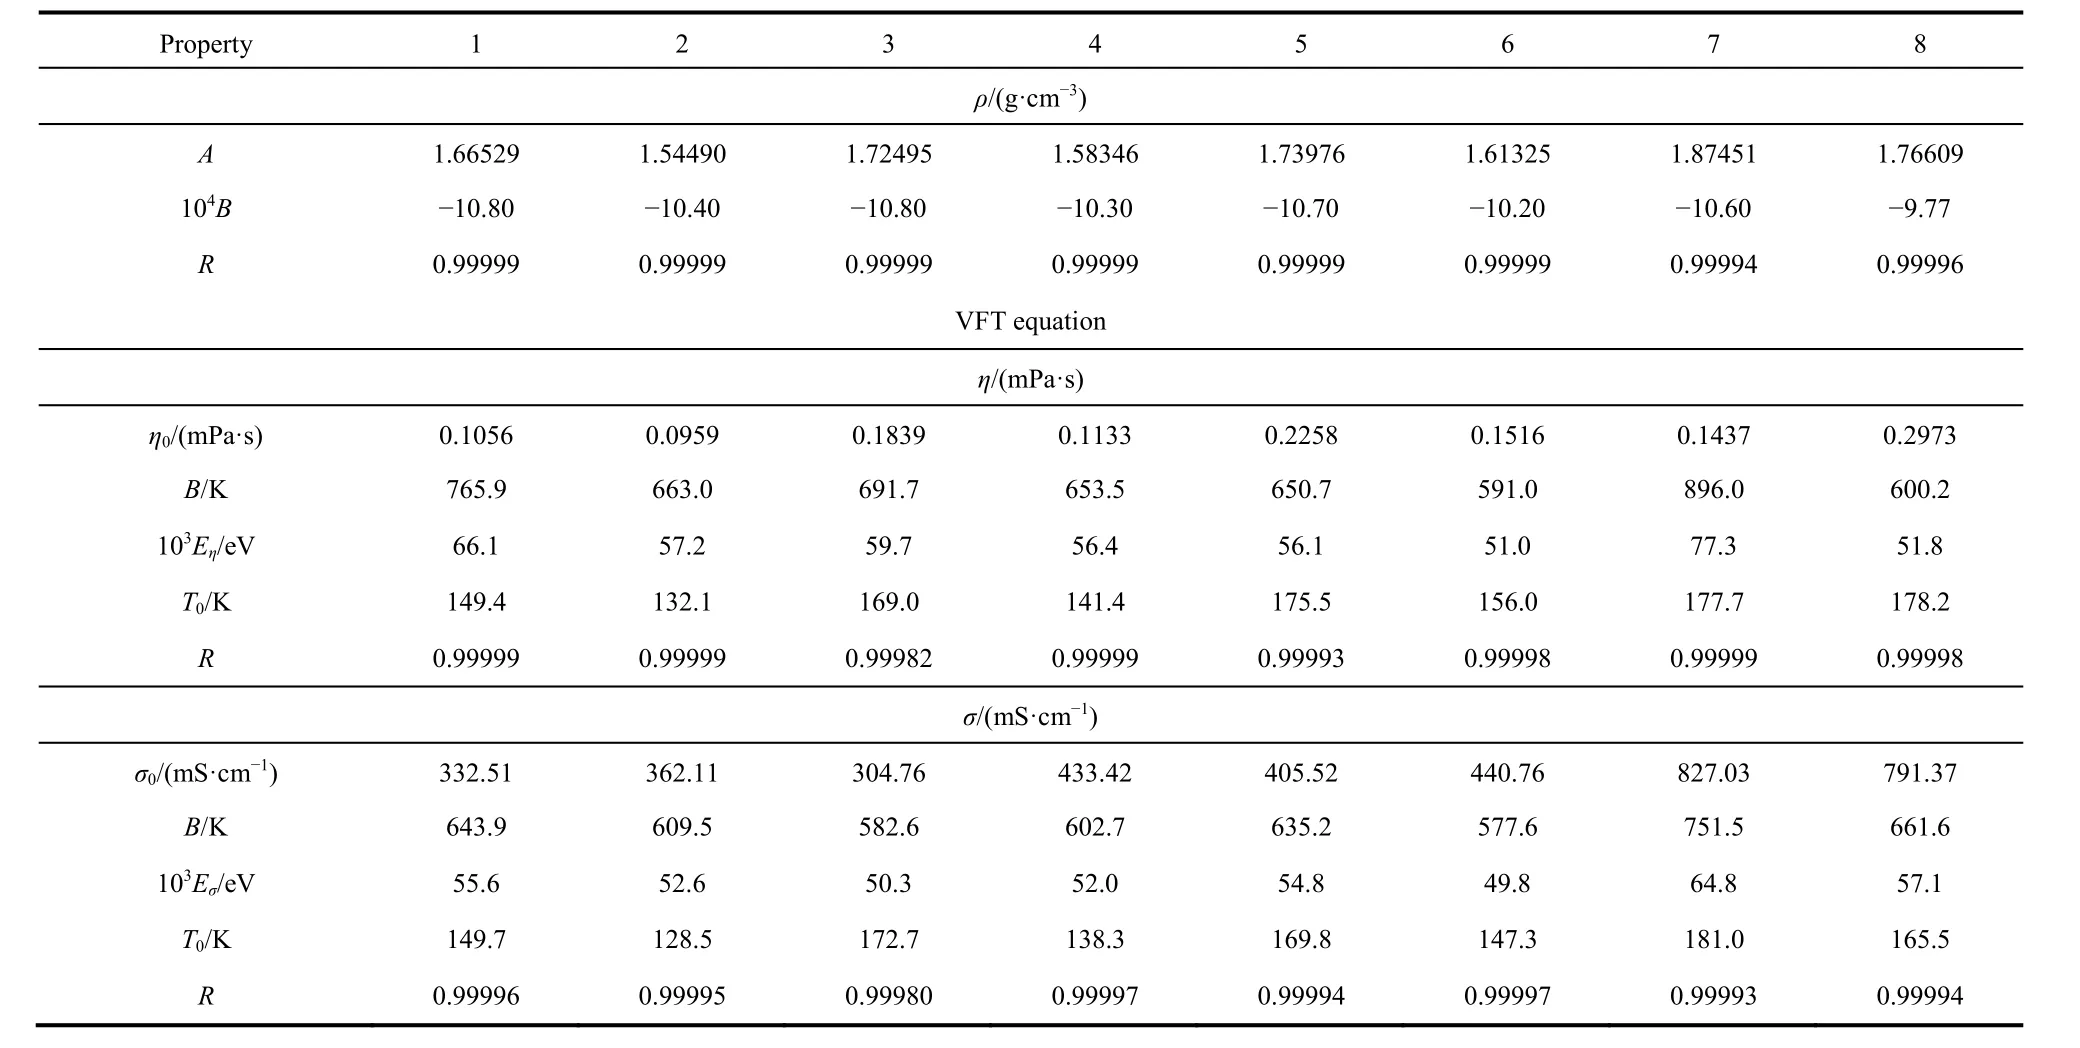
Table 7 The fitting parameters values vs temperature for the eight systems by line equation, VFT and modified VFT equations.
Arrhenius equation can also be used to fit the viscosity:

whereEη/eV is the activation energy for viscosity,η∞/(mPa·s) is the maximum viscosity. According to the Eq. (4), the 1000T-1/K-1dependence on lnηwas plotted for the eight systems (see Fig.5). The Eq. (4) can also be changed to the following equation:

The 1000T-1and lnηof the eight systems are listed in Table 9 and plotted in Fig. 5.
In Fig. 5, the 1000T-1dependence on lnηof the eight systems were also fitted by the straight line in the temperature range. The values of the correlation coefficient,R, are from 0.995 to 0.998 which obtained from the Arrhenius equation. The values arelower than the values (All of the values are higher than 0.99993 except system 3, the correlation coefficient is 0.99982) which obtained from the VFT equation. In Fig. 5, it can also be obviously observed that the tendency of the experimental points is far away from the red straight fitted lines for the eight systems.The same results were obtained by our previous reports25,26,32-34.So, the experimental viscosity can be fitted better by the VFT equation than the Arrhenius equation.

Table 8 The thermal expansion coefficient, 104α/K-1, of the eight systems from 288.15 to 348.15 K at atmosphere pressure (p = 101.3 kPa).
According to the discussion of Vilaet al.35, the original VFT equation can be related to the Arrhenius equation for viscosity.The activation energy of viscosity can also be introduced in the final version VFT equation. The final version of the VFT equation can be expressed as follows:


Fig. 4 Plot of η vs T of systems at temperature from 288.15 to 348.15 K.■: 1; □: 2; ●: 3; ○: 4; ▲: 5; Δ: 6; ▼: 7; ▽: 8.
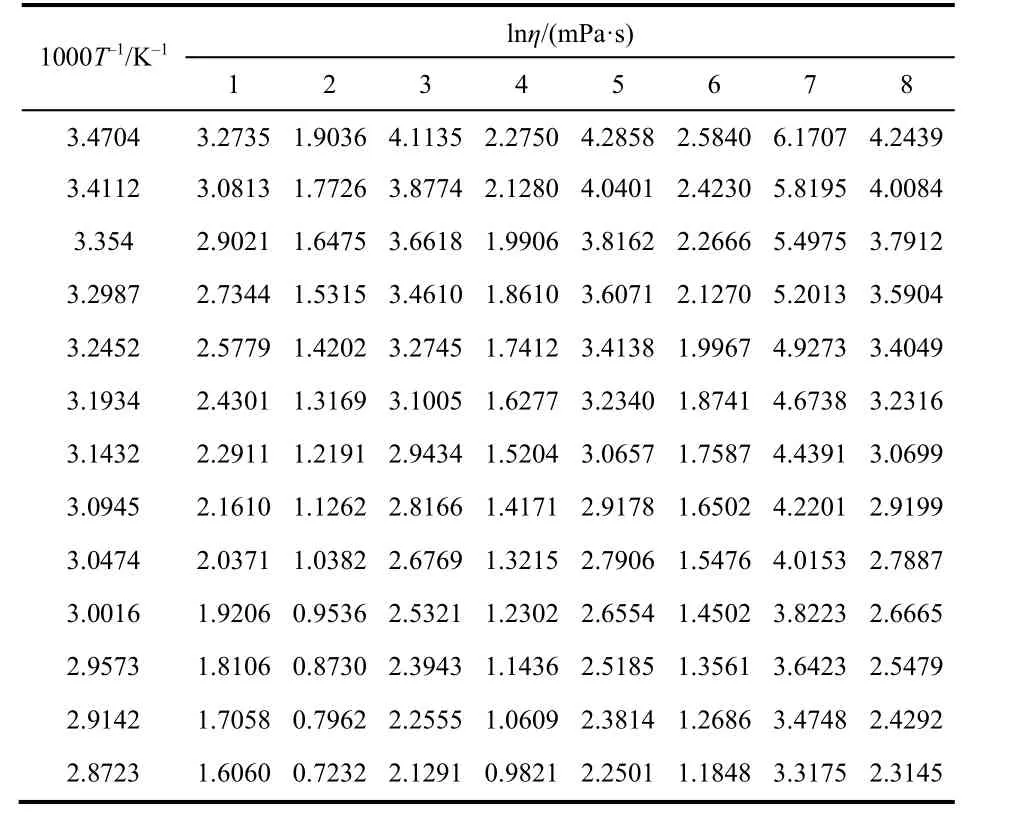
Table 9 The values of 1000T-1 and lnη/(mPa·s) of the eight systems from 288.15 to 348.15 K.
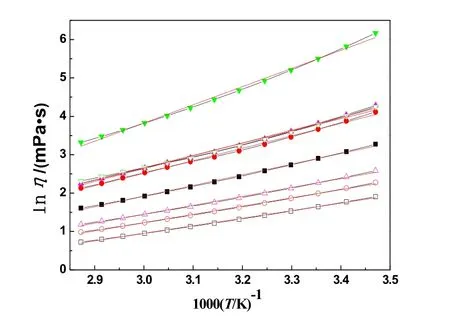
Fig. 5 Plot of lnη vs 1000T-1 of systems at temperature from 288.15 to 348.15 K.■: 1; □: 2; ●: 3; ○: 4; ▲: 5; Δ: 6;▼: 7; ▽: 8. The red lines are the straight fitted lines.
The activation energies of viscosity for the eight systems were calculated and listed in Table 7. From Table 7, the values (η0,B,Eη, andT0) of the lithium salt systems are higher than nonlithium salt systems exceptη0, andT0of the systems 7 and 8. In Table 7, the values (η0andT0) increase with the IL concentration increasing (exceptη0of the system 7) and the values (BandEη)decrease with the IL concentration increasing (except the systems 7 and 8).
3.4 Conductivity
From the Table 5 and Fig. 6, the conductivity of the eight systems increase with temperature increase. However, the systems have shown the more complex trends than density and viscosity from Table 5 and Fig. 6. The values of the non-lithium salt systems have shown the higher conductivity than the lithium salt systems at the experimental temperature range.
For the non-lithium salt systems, the values are nearly the same at the ratios 6 : 4 and 6 : 3 forV(C3mimNTf2) :V(DEC).The tendencies are 2 > 4 > 6 > 8 at lower experimental temperature range and 6 > 4 > 2 > 8 at higher temperature experimental range. The systems of non-DEC have shown the lowest values than DEC systems.
For the lithium salt systems, the values are nearly the same at the ratios 6 : 6, 6 : 4 and 6 : 3 forV(C3mimNTf2) :V(DEC). The tendencies are 1 > 3 > 5 > 7 at the relative low experimental temperature range and 1 > 5 > 3 > 7 at the relative high experimental temperature range. The systems of non-DEC have shown the lowest values than DEC systems.

Fig. 6 Plot of σ vs T of systems at temperature from 288.15 to 348.15 K.■: 1; □: 2; ●: 3; ○: 4; ▲: 5; Δ: 6;▼:7; ▽: 8.
Like the viscosity, the VFT equation and Arrhenius equation are usually used for the fitting of temperature dependence on conductivity. The equations are below:
VFT equation:

hereσ/(mS·cm-1) is the conductivity;σ0/(mS·cm-1),B/K, andT0/K are fitting parameters.
Arrhenius equation:

whereEσ/eV is the activation energy, which indicates the energy needed for the ion to hop into a free hole,σ∞/(mS·cm-1) is the maximum conductivity.
According to the Eq. (7), the fitted parameters ofσ0,B,T0, and the corresponding correlation coefficient,R, are also obtained and listed in Table 7. From the Table 7, the values of the correlation coefficient,R, are more than 0.99993, which indicates that the VFT equation has a well performance fitting of the temperature dependence on the experimental conductivity.
According to the Eq. (8), the 1000T-1dependence on lnσ/(mS·cm-1) was plotted for the eight systems (see Fig. 7). The Eq. (8) can also be changed to the following equation:

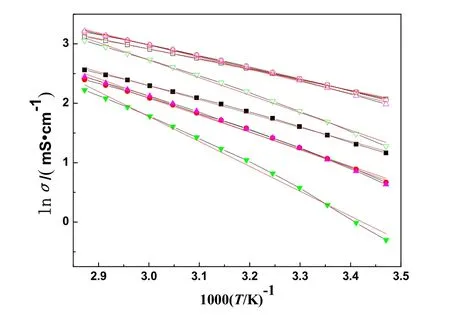
Fig. 7 Plot of lnσ vs 1000T-1 of systems at temperature from 288.15 to 348.15 K.
The 1000T-1and lnσof the eight systems are listed in Table 10 and plotted in Fig. 7. In Fig. 7, the 1000T-1dependence on lnσof the eight systems were also fitted by the straight line in the temperature range. The values of the correlation coefficient,R, are from 0.994 to 0.998 which obtained from the Arrhenius equation. The values are lower than the values (All of the values are higher than 0.99993) which obtained from the VFT equation.In Fig. 7, it can also be obviously observed that the tendency of the experimental points isfar away from the red straight fitted lines for the eight systems. The same results were also obtained by our previous reports25,26,32-34. So, the experimental conductivity can be fitted better by the VFT equation than the Arrhenius equation.
Like the viscosity, the activation energies of conductivity for the eight systems were calculated and listed in Table 7. Vilaet al.35have introduced the activation energy of conductivity in the VFT equation by establishing the fitting parameters of VFT equation with Arrhenius equation:σ0=σ∞andB=Eσ/kB. The final version of the VFT equation can be expressed as follows:

The activation energies of conductivity for the eight systems were calculated and listed in Table 7. From Table 7, not like the viscosity, the values (σ0,B,Eσ, andT0) of the systems do not shown the regular tendency. It can be explained by the irregular experimental values changing.
3.5 Molecular dynamics simulations analysis
The basic macroscopic behaviors were measured in the front part of the paper. It is found that many properties of the system of [C3mim][NTf2]/[Li][NTf2] have changed significantly after mixing DEC, which indicated that there is evident interaction between DEC and ions. In this part, molecular dynamics (MD)simulations were carried out to obtain a microscopic view of mixtures structuring and intermolecular forces, and their relationship with macroscopic behavior. The number of cations and anions and the DEC molecules comprising the systems withcalculated densities are mentioned in Table 11. The agreement between the calculated density and the experimental density shows that the force field used in the simulation can be well applied to the studied system.

Table 10 The values of 1000T-1 and lnσ/(mS·cm-1) of the eight systems from 288.15 to 348.15 K.
For microscopic structures, we examined the structural snapshots from simulations of systems firstly. The model of the possible nearest molecules/ions within a distance of 0.5 nm around the [Li]+cation was shown in the Fig. 8. In the[Li][NTf2]/[C3mim][NTf2] system, three [NTf2]-anions coordinated to [Li]+cation through O atom, but not N atom. The addition of DEC did not influence the coordination number of[NTf2]-anion around [Li]+cation, although carbonyl O atom of DEC could coordinate to [Li]+cation.
To get more information about statistically averaged structural properties, the radial distribution functions (RDFs) for selected relevant molecular pairs was analyzed (Fig. 9). We focus on the distribution of [NTf2]-anion and DEC around the [Li]+cation.In Fig. 9, the RDF of [Li]+cation with the O atom of [NTf2]-anion (Li-OB) shows two peaks with maxima at 0.21 nm and 0.44 nm, corresponding to two solvation shells around each [Li]+cation. Their position of peak does not change with dilution ofDEC, which confirm that the coordination structures between Li and O atom of [NTf2]-anion have no dramatic change. In the RDF of Li-NB, the first solvation shell should appear at 0.36 nm although a small peak appears at 0.22 nm in system 5 and 7.From the comparison of peak position of Li-OB, it is shown that the O atom in [NTf2]-anion is more close to [Li]+cation. These conclusions are consistent with the previous snapshot analysis.

Table 11 Number of ion pairs/DEC and calculated density of the investigated systems.
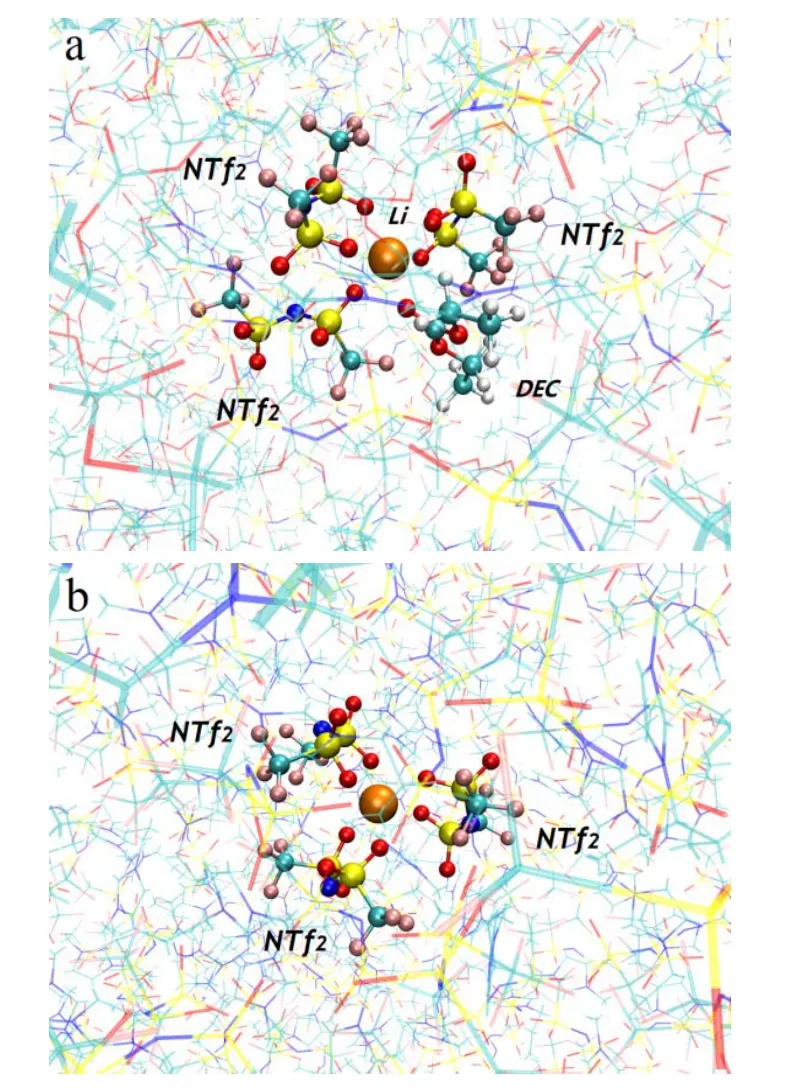
Fig. 8 Snapshots of (a) [Li]([NTf2])3(DEC) from system 1,(b) [Li]([NTf2])3 from system 7.
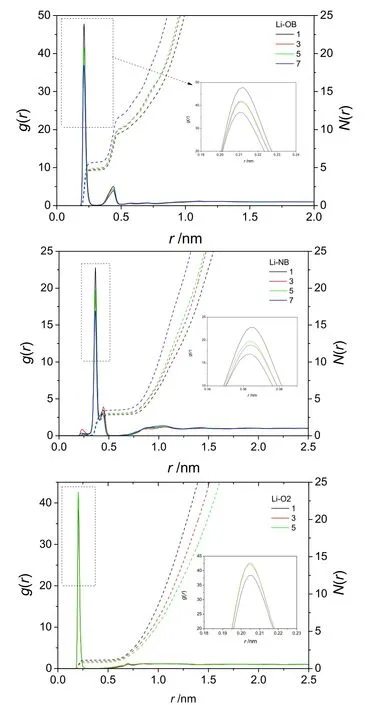
Fig. 9 RDFs (solid lines) and corresponding number integrals(dashed lines) of systems 1, 3, 5, 7.NB is N atom in [NTf2] -, OB is O atom in [NTf2]-, and O2 is carbonyl O atom of DEC.
With the increase of DEC content, the peaks of Li-OB and Li-NB in the first solvation shell decreased, indicating that the introduction of DEC weakens the interaction between [Li]+cation and [NTf2]-anion. Nevertheless, it is stronger than the interaction between [Li]+cation and DEC still, according to lower peak in RDF of Li-O2. There is about 5.6 O atoms around[Li]+cation in system 7, namely 3 [NTf2]-anion around [Li]+cation by analyzing the coordination number of the first solvent shell. However, the coordination number of O atom in [NTf2]-anion decreases to 4.6 in system 1, while the coordination number of carbonyl O atom in DEC increases to 1.1. These indicated that the saturated coordination number of O atom around Li is 5 or 6 and the DEC will compete with [NTf2]-anion in the first solvent shell.
4 Conclusions
The density, viscosity, and conductivity of the eight systems were measured in temperature range (288.15 to 348.15) K. The eight systems have been prepared by the adding of the diethyl carbonate (DEC) and lithium bis[(trifluoromethyl)sulfonyl]imide([Li][NTf2]) in the 1-propyl-3-methylimidazolium bis[(trifluoromethyl)sulfonyl]imide ([C3mim][NTf2]) ionic liquid (IL). The glass transition temperature and semi-stable temperature can be found, but the melting temperature cannot be found according to the DSC curves. The self-diffusion coefficients of the studied system lithium ion decrease following the IL concentration increasing. The viscosity and conductivity can be fitted better by using the Vogel-Fulcher-Tamman (VFT)equation than Arrhenius equation. MD results show that [NTf2]-anion coordinated to [Li]+cation through O atom and the saturated coordination number of O atom is 5 or 6. With the increase of DEC content, the DEC will compete with [NTf2]-anion in the first solvent shell, leading to the weaker interaction between [Li]+cation and [NTf2]-anion.
Acknowledgment:We gratefully acknowledge the computing resources and time on the Supercomputing Center of Cold and Arid Region Environment and Engineering Research Institute of Chinese Academy of Sciences.
Supporting Information:The1H NMR spectrums, density,viscosity, and conductivity measurement and the force field parameterizations have been included. This information is available free of chargeviathe internet at http://www.whxb.pku.edu.cn.
