Experimental investigation on the plasma morphology of ablative pulsed plasma thruster with tongue-shaped and flared electrodes
2020-09-14JianjunWU吴建军YuZHANG张宇YangOU欧阳andHuaZHANG张华
Jianjun WU (吴建军),Yu ZHANG (张宇),Yang OU (欧阳) and Hua ZHANG (张华)
1 College of Aerospace Science and Engineering,National University of Defense Technology,Changsha 410073,People’s Republic of China
2 Jiuquan Satellite Launch Centre,Jiuquan 735000,People’s Republic of China
3 Authors to whom any correspondence should be addressed.
Abstract
Keywords:pulsed plasma thruster,high-speed camera,optical emission spectrum,plume distribution
1.Introduction
Satellites have been widely used in remote sensing,communication,navigation and other fields in modern society.The satellite needs a propulsion system for station-keeping and orbit control [1].Carrying propellant results in an increased satellite mass,therefore,yields higher costs for the manufacturing and launch of the spacecraft.Compared with chemical propulsion,electric propulsion thrusters (EPTs) have the advantages of low-cost,low-mass,and high specific impulse[2].Recently,an increasing number of satellites have adopted EPTs for spacecraft orientation and propulsion[3,4].As a member of EPTs,the ablative pulsed plasma thruster(APPT) is considered as an attractive propulsion option for satellites with limited mass and power because of its low power requirements,simple design,robustness,and high specific impulse (∼1000 s) [5-7].However,the drawback of low efficiency significantly limits its application [8].Recently,an APPT with tongue-shaped and flared electrodes has been proposed,which owned better performance [9].
Figure 1 presents the schematic of APPT with tongueshaped and flared electrodes.In this APPT,the capacitor is fully charged before the spark plug ignites.After the ignition signal is sent,the voltage between the anode and cathode of the spark plug begins to increase.When the voltage exceeds the breakdown voltage of the spark plug,breakdown occurs and an initial plasma is generated.The discharge of the spark plug will trigger a breakdown between the APPT electrodes and generate a discharge arc.The discharge arc across the surface of the propellant will ablate a portion of the propellant,ionize it,and then accelerate it to generate thrust electromagnetically[7,10].The APPT’s propellant PTFE is a polymer containing several elements,hence the APPT plasmas have a complex composition with multiple species (CI,CII,CIII,FI,FII,FIII,etc).Otherwise,the working duration of APPT is about ten microseconds,and the internal physical mechanisms and interactions of APPT are very challenging to study.

Figure 1.Schematic of the APPT with tongue-shaped and flared electrodes.(a) Front view,and (b) top view.

Figure 2.Schematic of the experimental set-up.
Many investigations have been carried out on the mechanisms of APPT.The effect of the propellant and electrodes on the performance of APPT has been studied by several researchers [10-12].Antropov et al [13]studied the effect of shape and angle of electrodes on APPT’s performance,and proposed that the efficiency of the APPT with tongue-shaped electrodes can increase about 10% compared with rectangular electrodes.Schonherr’s study further confirmed Antropov’s conclusion,and then proposed that the flared angle can also affect the APPT’s performance [14].Otherwise,several measuring methods have been proposed and used to investigate the plasma characteristics in the plume.The optical emission spectroscopy and Mach-Zehnder interferometry were applied to investigate the plasma properties of APPT,the velocity and temperature of plasmas were obtained [15,16].The ultra-high-speed camera and magnetic probe were used to obtain the plasma distribution and density[3,17-19].
Most of these researches focused on the performance of APPTs and the characteristics of plumes.However,efforts about the plasma morphology between electrodes are somewhat limited.The variation of plasma morphology can present the arc forming process between electrodes,and then reveal the working process of APPT.Due to the short discharge time of a single pulse of APPT,the residence time of plasma between electrodes is very short,it is difficult to record the development of plasma morphology between electroplates.Therefore,this paper adopts a high-speed camera and optical emission spectrum (OES) to investigate the plasma morphology between the electrodes of the APPT.The plasma characteristics including the spatial distribution and composition evolution are experimentally studied,which is helpful to understand the physical mechanism of an APPT with tongue-shaped and flared electrodes.
2.Experiment
2.1.Experimental set-up
The APPT used in experiments is shown in figure 1.The APPT contains a capacitor (capacitance of 10 μF,peak charged voltage of 2000 V),a couple of tongue-shaped electrodes (flared angle of 28°,inter-electrode space of 20 mm,length of 40 mm),and a solid propellant (PTFE).In our experiments,nine uniformly distributed positions between electrodes are chosen for measurement by the OES.With the center of PTFE surface as the origin of the coordinate,the corresponding coordinates of the nine positions are characterized as position 1 (5 mm,10 mm),position 2 (15 mm,10 mm),position 3 (25 mm,10 mm),position 4(5 mm,0),position 5(15 mm,0),position 6(25 mm,0),position 7 (5 mm,−10 mm),position 8 (15 mm,−10 mm),and position 9 (25 mm,−10 mm) respectively,as presented in figure 1.
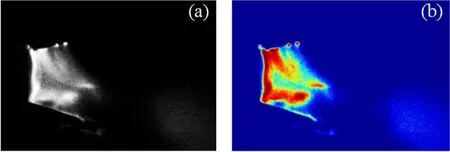
Figure 3.Comparison of plume images before and after pseudo-color processing.(a) Before,and (b) after.

Figure 4.Discharge curves and shutter timings of the high-speed camera.
In order to experimentally investigate the plasma morphology of APPT,both the high-speed camera and OES are simultaneously adopted in the experiments,as shown in figure 2.The high-speed camera (Model:XXRapidFrame) is produced by Stanford Computer Optics company,with 1360×1024 pixels,minimum shutter time of 0.2 ns,minimum exposure time of 1.2 ns.In these experiments,the exposure time was set to 50 ns which was short enough to freeze the motion of plume during imaging.The OES system consists of the following instruments:(1) the optical fiber(QP600-2-SR),which was used to transmit the optical signals emitted by the discharge between the electrodes to the spectrometer;(2) the spectrometer (Acton SP2300i),which was used to disperse and diffract optical signals;(3)the ICCD camera (PI-MAX2),which was used to collect and enhance the optical signals transmitted from the spectrometer;(4) the controller(ST-133),which was used to control the rotation of the grating and the shutting time of the camera.
The APPT experiments were carried out in a vacuum chamber with a diameter of 2.4 m and a length of 3 m.The chamber is equipped with a booster pump (Z-300),two oil diffusion pumps (K-900C) and three oil-free claw pumps(4ZBWS-30).The base pressure was less than 5×10⁻³Pa before the experiments.It is noticeable that the size of the vacuum chamber in the experiments is much larger than the thruster,hence the change of base pressure caused by the thruster working can be ignored.
2.2.Image processing method
In our experiments,the images taken by the high-speed camera were gray.In order to improve the visibility of the images and reveal more details of the plasma distribution,the pseudo-color processing method was utilized to transform the gray images to color images.As one of the traditional image enhancement techniques,the pseudo-color processing method has been widely used to convert black-and-white images into color images.The mapping relationships between red,green,blue and gray can be expressed as Figure 3 shows the plume images before and after pseudocolor processing.It can be obviously observed that,the processed images which have better visibility can clearly display the plume morphology and the distribution characteristics of plasmas.

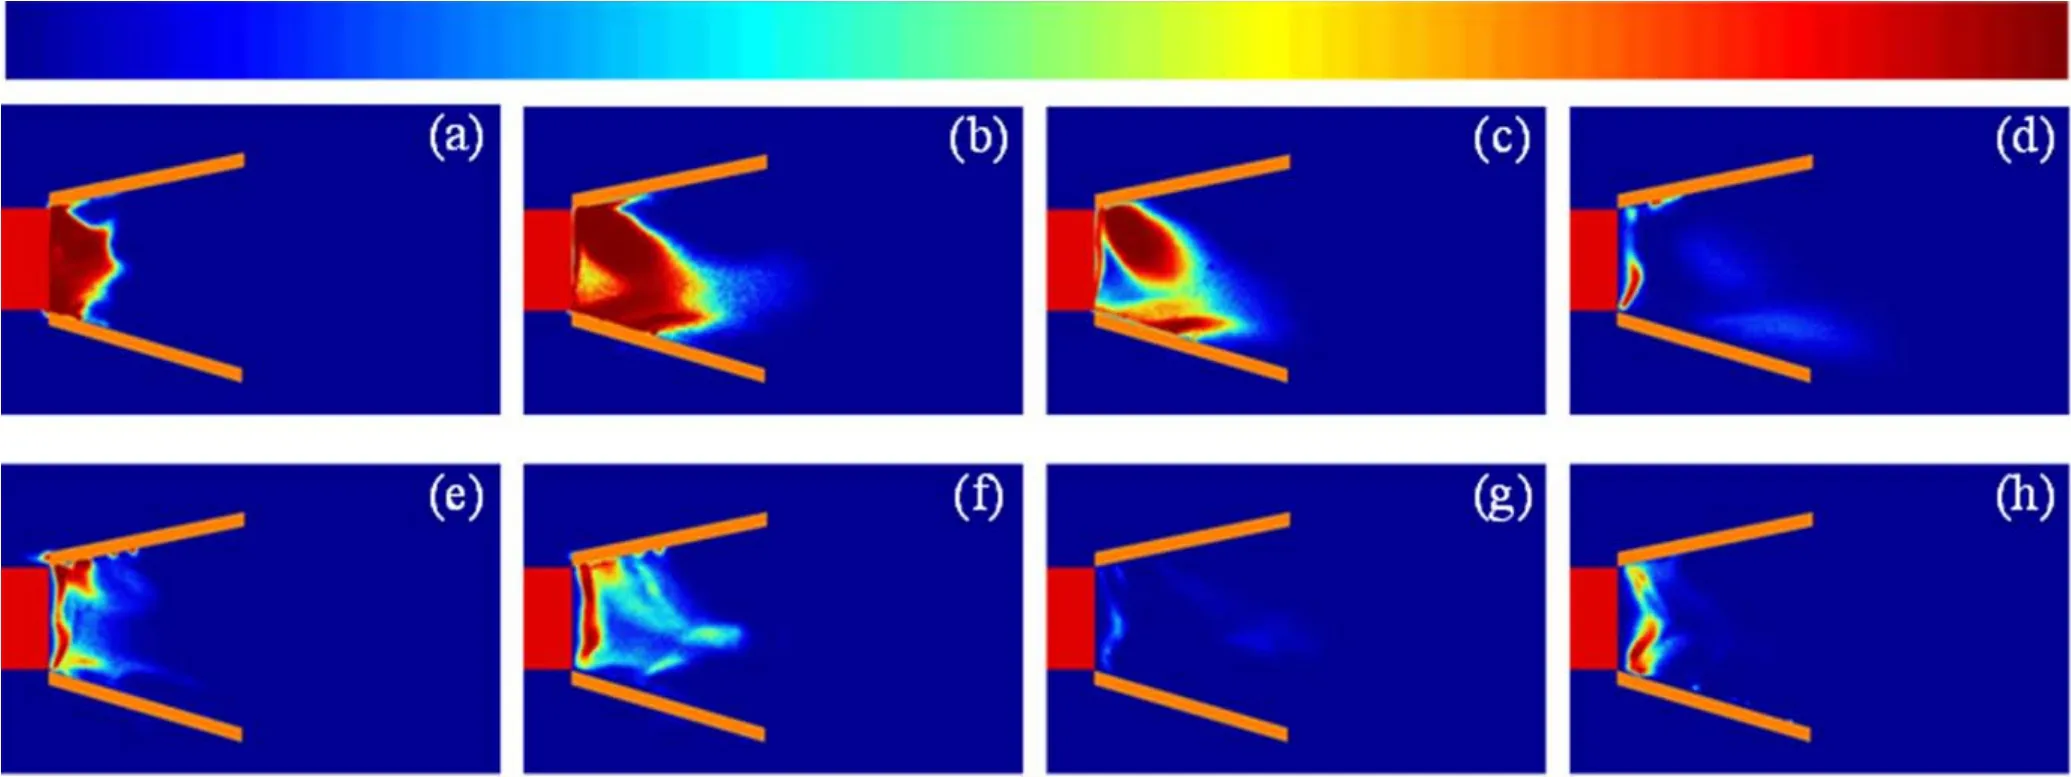
Figure 5.Variation of plume images with time.(a)0.6 μs,(b)1.6 μs,(c)2.6 μs,(d)3.6 μs,(e)4.6 μs,(f)5.6 μs,(g)6.6 μs,and(h)7.6 μs.
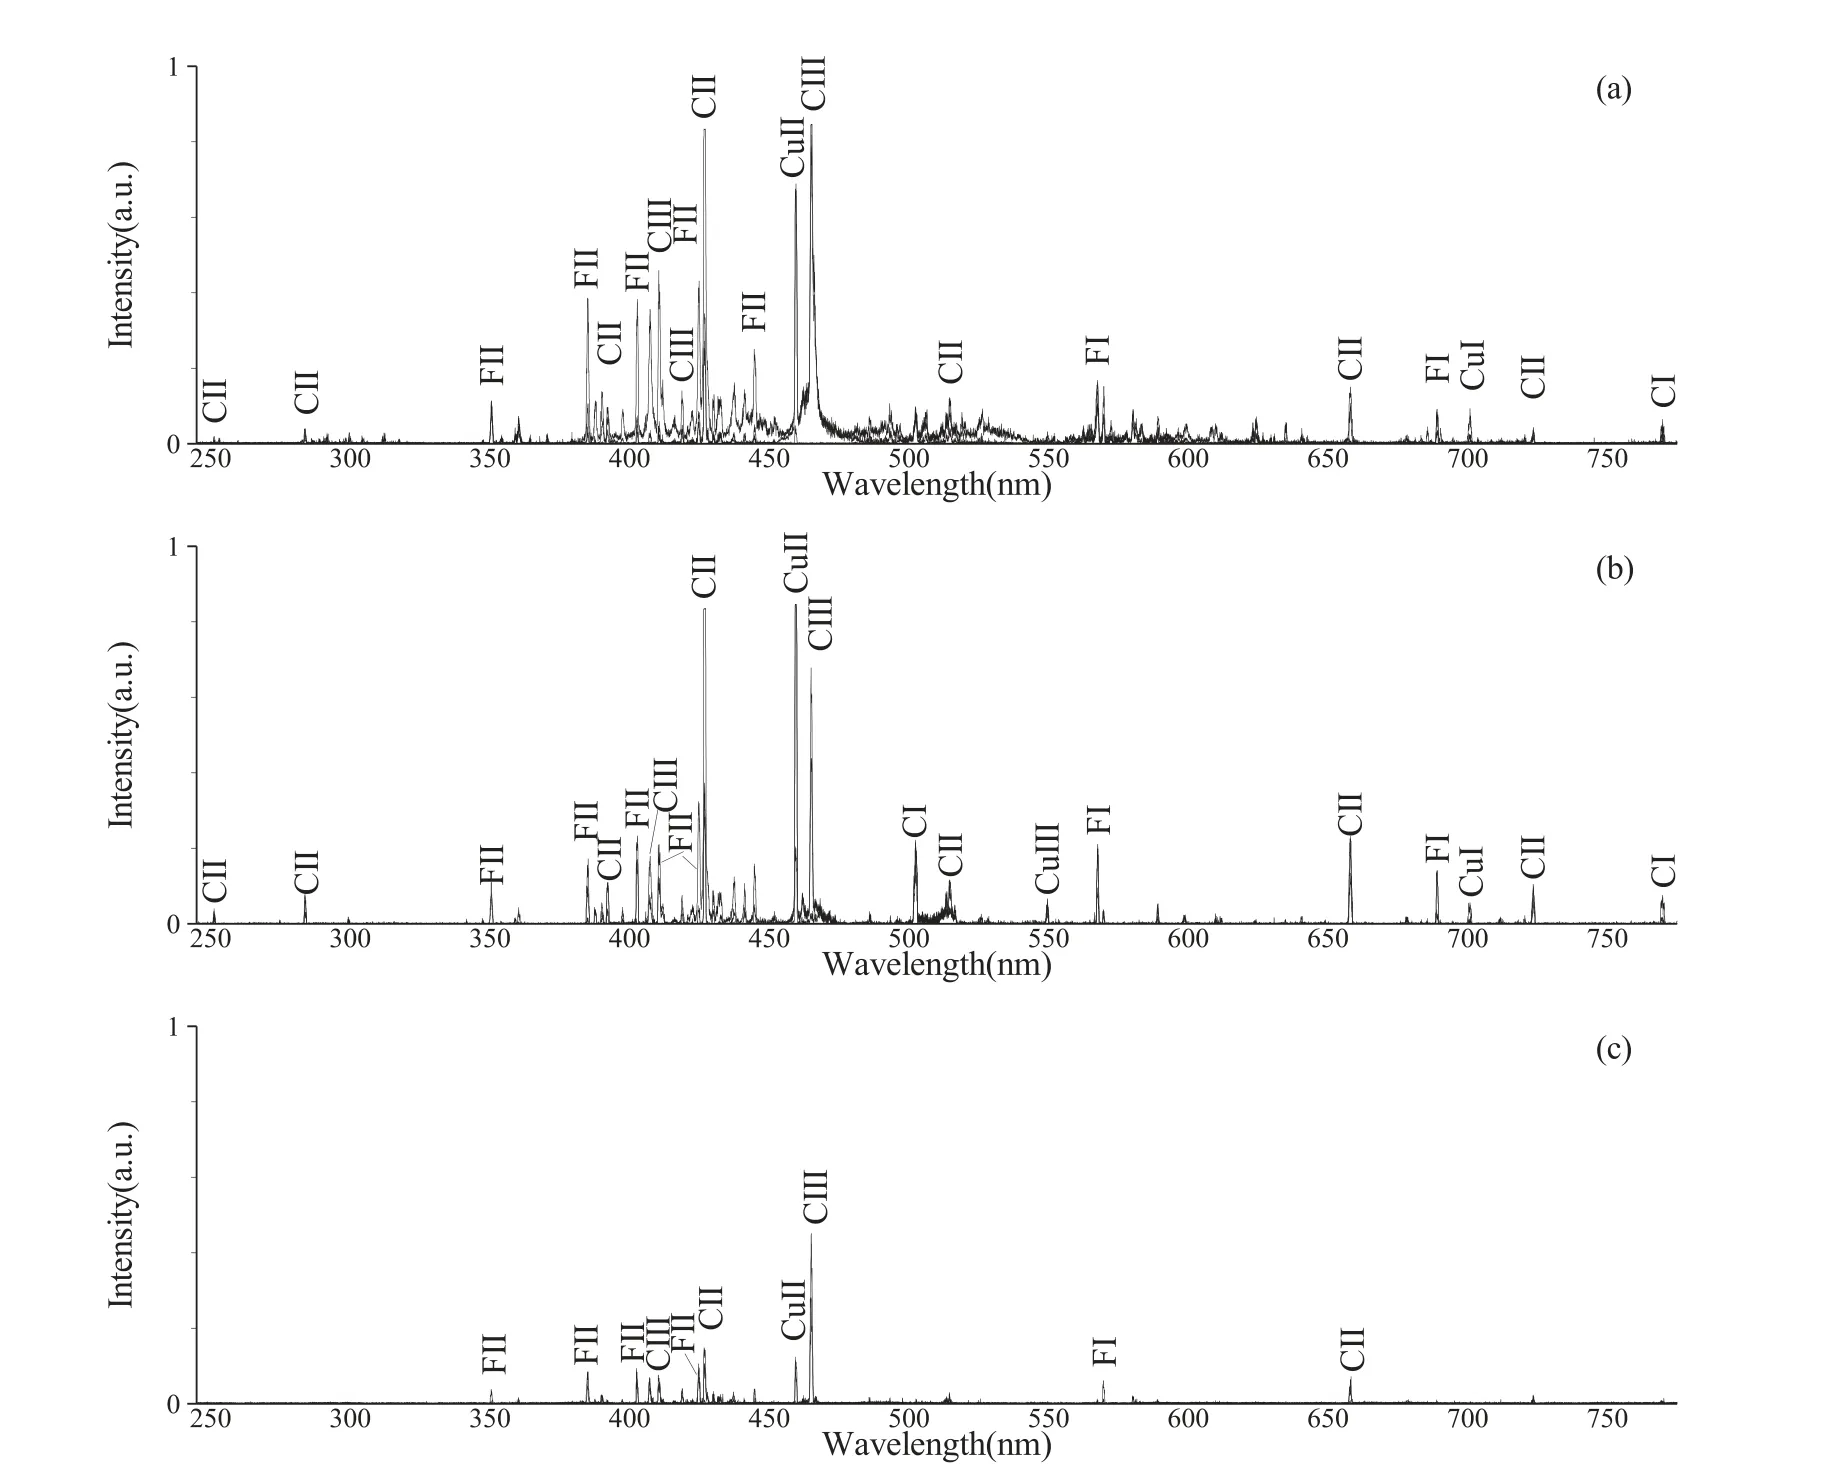
Figure 6.Spectrograms at positions 5 mm away from the ablation surface.(a) Position 1,(b) position 4,and (c) position 7.
3.Results and discussion
3.1.Spatial distribution of plasmas
The discharge waveforms (voltage and current) and shutter timings are shown in figure 4.The discharge current is monitored with a current monitor(PEARSON Current Sensor 4997),and the discharge voltage is measured using a standard high-voltage probe (Tektronix P5100).The APPT can be assumed to be an RLC circuit,and the discharge waveform is an underdamped oscillation with a period of about 7 μs.During the discharge cycle,the discharge current increased to the maximum value of 12 000 A at 2 μs,and then decreased to 0 at 3.7 μs,afterward,the current increased to 8000 A in the reverse direction.

Figure 7.Spectrograms at positions 15 mm away from the ablation surface.(a) Position 2,(b) position 5,and (c) position 8.
In order to record the variation of plume images with time,the plume images between the electrodes of APPT are shown in figure 5,and the time interval between adjacent images is 1 μs.It can be seen in figure 5,the plasmas between the electrodes change periodically,and the plasmas generated at different positions experience different trajectories and states of motion.Once the discharge starts,a layer of plasmas with uniform thickness is formed nearby the ablation surface of the propellant,as shown in figure 5(a).Under the action of the discharge arc,the number of plasmas increases gradually,and the plasmas accelerate and expand with the interaction of the electromagnetic field and aerodynamic force.After that,the thickness of the plasma layer becomes uneven,and two clusters of plasmas are formed near the anode and cathode,meanwhile,the two clusters of plasmas present different velocities and directions,as shown in figure 5(b).The cluster of plasmas near the anode moves towards the cathode with an angle (α) from the horizontal direction,and the cluster of plasmas near the cathode moves towards the anode with an angle (β) from the horizontal direction.The angle α is obviously greater than β,hence the two clusters meet downstream,and the intersection is closer to the cathode,then a cavity is formed near the ablation surface of the propellant and the center of the discharge channel,as shown in figure 5(c).
In addition,at each measuring position of figure 1,the spectral images are collected every 0.5 μs,and then all the spectral curves are superimposed together to obtain the spectral information of the whole period of each measuring position.Compared with the spectral lines of neutral molecules,the spectral lines of atoms and ions are thinner,and the intensities are higher [20].The spectral lines of atoms and ions can be distinguished more accurately,hence only the spectral lines of atoms and ions are obtained in this experiment.Figure 6 presents the spectra of the discharge width at positions 1,4,and 7 which are 5 mm away from the ablation surface of PTFE.According to the spectral database of the National Institute of Standards and Technology in America,it is found that the plume consists mainly of CI,CII,CII,FI,FII,CuII,and CuIII particles.CI,CII,CII,FI,and FII are generated by the ablation of PTFE,while CuII and CuIII are caused by the ablation of electrodes.By comparing the spectra of positions 1,4,and 7,it can be found that both the plasma species and density at position 1 are the largest,followed by position 4.It means that the plasmas are mainly concentrated on the anode side,and the average density gradually decreases from the anode to the cathode side.Meanwhile,there are many wideband spectral lines near the abode (position 1),which is caused by neutral molecules.This means the ablation of PTFE has mainly occurred near the anode side,which is confirmed by observing the ablation morphology of PTFE.However,there are also differences in the density distribution for different particles,for example,CIII is mainly distributed near the anode,while CII is concentrated in the middle area between the electrodes,and CuII is mainly distributed near the anode.Therefore,in order to improve the life of APPT,the anode needs to be anti-ablation treated.

Figure 8.Spectrograms at positions 25 mm away from the ablation surface.(a) Position 3,(b) position 6,and (c) position 9.
Figure 7 shows the spectra of the discharge width at positions 2,5,and 8 which are 15 mm away from the ablation surface of PTFE.Compared with figure 6,it can be seen from figure 7 that the plasma species and density near the anode,the middle position,and the cathode tend to be more uniform.The area at the midpoint between electrodes experiences the largest number of particles and the highest density,followed by the area near the cathode,while the plasma species and average plasma density are lowest in the area near the anode.It has been observed from figure 5 that the plasmas near the anode move towards the cathode with an angle (α),and the plasmas near the cathode move towards the anode with an angle (β).The motion of plasmas results in the difference of plasma species and density at different positions away from the ablation surface of PTFE.Moreover,the plasma clusters gradually expand and diffuse as plasmas move,hence the farther away from the ablation surface,the more uniform the plasmas distribute.
The spectra of the discharge width at positions 3,6,and 9 which are 25 mm away from the ablation surface of PTFE are given in figure 8.The largest number of plasma species is concentrated at the area of the midpoint between electrodes,next to the cathode side,and the least near the anode.Compared with figures 6 and 7,the average density of plasma tends to be more uniform at the plane 25 mm away from the ablation surface.The average density of plasma at the midpoint between electrodes is slightly larger,and that near the anode and cathode is almost the same.In a word,with the increasing distance from the ablation surface of PTFE,the species of particles tend to be similar,and the average density of plasmas tends to be uniform.
3.2.Time course of spectra

Figure 9.Spectral variations at different positions.(a) Position 1,(b) position 2,(c) position 3,(d) position 4,(e) position 5,(f) position 6,(g) position 7,(h) position 8,(i) position 9,and (j) the trajectory of CuII.
Figure 9 shows the time course of the spectra at different positions,meanwhile,the wavelength of the spectral line of CuII is also presented in the figure.It is found that the variation of spectral intensity at each position shows a certain periodicity,and the change cycles at different positions are approximately the same.However,the occurrence of spectral intensity and the time maximum spectral intensity at different positions is quite different,which is mainly caused by the uneven distribution and the diffusion of plasmas in the discharge channel.Otherwise,the maximum emission spectrum wavelengths are different at different positions,indicating that the compositions of plasma plume are also different at different positions.It can be seen from figure 9 that the ionization is mainly concentrated in the first discharge cycle.At the end of the discharge,both the intensity and the number of the spectral lines decrease significantly,which means the density of atoms and ions decreases.The composition of the plume and the proportion of each component are quite different at different stages of discharge,which is mainly due to the different ionization energy and time required by different particles in the discharge process.By comparing the spectrum evolution processes at different positions with the same distance from the ablation surface,it can be found that the time of occurrences of the spectrum and maximum spectral intensity is different,and the changing law of spectral lines of different wavelengths is also different.These results show that,in the discharge channel,the velocity distribution of plasma is not uniform,and different kinds of plasma particles have different velocities and distributions.
In addition,during the working process of APPT,the ablation of electrodes is inevitable,which will reduce the life of thruster.Therefore,it is necessary to investigate the generation and distribution of Cu element to reduce the ablation of electrodes.The wavelength of the spectral line of CuII is presented in figure 9.The ablation of electrodes can be obtained by measuring the spectral strength at the intersection of the curve and the spectral lines at each time.At points 1,2 and 4,the CuII occurs at 2.6 μs.At point position 5,the CuII can be observed at both 2.6 μs and 3.6 μs.At point positions 6,8 and 9,the CuII can only be observed at 3.6 μs.At point positions 3 and 7,the CuII has not been observed.Therefore,it can be concluded that the CuII is caused by the ablation of the anode,and then it moves to the downstream of the thruster.Its trajectory can be drawn as shown in figure 9(j).
4.Conclusions
In this paper,we use the high-speed camera and optical emission spectroscopy to investigate the composition and spatial distribution of plasmas between the electrodes of APPT.According to the experimental results,the main conclusions are drawn.
(1) The plasma density changes periodically in the discharge channel of the thruster,and the plasma generated at different positions experiences different trajectories and states of motion.At the beginning of discharge,a uniform plasma layer is formed near the surface of PTFE.As the discharge processing,the thickness of the plasma layer gradually becomes uneven,and two clusters of plasmas near the anode and cathode are formed,then the two clusters meet at a certain distance from the ablation surface.
(2) The plume between the electrodes is mainly composed of CI,CII,CIII,FI,FII,CuI,CuII,and CuIII.In the plane 5 mm from the ablation surface,the plume near the anode has the largest average plasma density and most types of plasma particles.In the plane 15 mm from the ablation surface,the midpoint between electroplates experiences the largest average plasma density and most types of plasma particles.In the plane 25 mm from the ablation surface,the plasma species and average density are distributed uniform except for the slightly larger density at the midpoint.With the increase of the distance from the ablation surface,the differences of the kinds of particles in the plume become smaller,and the distribution of plasma density tends to be more uniform.
The study of this paper gives a deeper understanding of the plasma characteristics between the electrodes of APPT,and the conclusion can be used to improve the design of APPT.However,further quantitative data such as the ionization rate,electron temperature,and various component densities are needed.These will possibly be obtained combining with other measuring means.
Acknowledgments
The authors would like to thank National Natural Science Foundation of China (No.11772354) for the financial assistance provided for this work.
猜你喜欢
杂志排行
Plasma Science and Technology的其它文章
- Impact of exterior electron emission on the self-sustaining margin of hollow cathode discharge
- Research on the neutralization control of the RF ion micropropulsion system for the‘Taiji-1’ satellite mission
- On the heating mechanism of electron cyclotron resonance thruster immerged in a non-uniform magnetic field
- Study on the influence of the discharge voltage on the ignition process of Hall thrusters
- The plume diagnostics of 30 cm ion thruster with an advanced plasma diagnostics system
- Performance of a 4 cm iodine-fueled radio frequency ion thruster