An integrated spectroscopic strategy to trace the geographical origins of emblic medicines:Application for the quality assessment of natural medicines
2020-09-04LumingQiFurongZhongYangChenShengnanMaoZhuyunYanYuntongMa
Luming Qi,Furong Zhong,Yang Chen,Shengnan Mao,Zhuyun Yan,*,Yuntong Ma,**
aState Key Laboratory of Characteristic Chinese Medicine Resources in Southwest China,Chengdu University of Traditional Chinese Medicine,Chengdu,611137,China
bSchool of Pharmacy,Chengdu University of Traditional Chinese Medicine,Chengdu,611137,China
Keywords:
Emblic medicine
Quality assessment
Geographical traceability
Spectroscopic analysis process
ABSTRACT
Emblic medicine is a popular natural source in the world due to its outstanding healthcare and therapeutic functions.Our preliminary results indicated that the quality of emblic medicines might have an apparent regional variation.A rapid and effective geographical traceability system has not been designed yet.To trace the geographical origins so that their quality can be controlled,an integrated spectroscopic strategy including spectral pretreatment,outlier diagnosis,feature selection,data fusion,and machine learning algorithm was proposed.A featured data matrix(245×220)was successfully generated,and a carefully adjusted RF machine learning algorithm was utilized to develop the geographical traceability model.The results demonstrate that the proposed strategy is effective and can be generalized.Sensitivity(SEN),specificity(SPE)and accuracy(ACC)of 97.65% ,99.85% and 97.63% for the calibrated set,as well as 100.00% predictive efficiency,were obtained using this spectroscopic analysis strategy.Our study has created an integrated analysis process for multiple spectral data,which can achieve a rapid,nondestructive and green quality detection for emblic medicines originating from seventeen geographical origins.
1.Introduction
The development of a generalized geographical traceability system for natural medicines remains a significant challenge because the growing environment always has a noticeable influence on their quality[1].This interference is multidimensional and unpredictable.Primary and secondary metabolite compounds,which are mainly responsible for the healthcare and therapeutic functions of natural medicines,always vary significantly because of their different geographical origins[2,3].Effective analytical methods and instruments for obtaining more insights into the metabolic characterizations and regional variation of natural medicines are essential because these variations affect both producers and consumers.The well-identified to geographical origin for a natural product is a prerequisite to its optimal application.
At present,many strategies such as molecular,chromatographic and spectroscopic methods have been applied to identify the origins of natural products based on their respective advantages[4—8].Especially,spectroscopic analyticalinstruments have attracted more and more attention to characterizing natural products originating from different geographical origins.These techniques are worth to be recommending because they are rapid,simple and environment-friendly.These advantages can further promote the efficiency and safety of the quality control process for natural medicines.However,natural products are always an especially complex mixture with diversified metabolic ingredients.The descriptive information generated from different spectroscopic sensors is always sizable,so there are still a large number of irrelevant and redundant attributes.A large number of data optimization algorithms have been developed to enhance the availability of spectral data.
For example,feature selection is one of these requisite algorithms regarding a geographical traceability task.It can produce a clean and informative sub-dataset,which is necessary to improve the accuracy of analysis and to decrease the computation cost.Generally,feature selection algorithms can be classified into three types of filter,wrapper and embedded models,which have different efficiency for feature selection with respective criteria[9].Another effective strategy for measuring geographical traceability is data fusion.It is utilized to integrate multi-source descriptive information when two or more instruments are implemented simultaneously[10].It can provide a complementary approach to constructing a more effective geographical traceability model regarding the regional variation of natural products.These data optimization algorithms further enlarge the application of spectroscopic techniques.
Generally,a complete spectral analysis process for a geographical traceability model should contain several key steps,including spectral pretreatment,outlier diagnosis,feature selection,and machine learning algorithm.Each step needs to be strictly optimized.So far,many spectroscopic geographical traceability studies of natural medicines have been conducted[11—16].A limited number of studies can use a complete spectroscopic analysis process for geographical traceability,and the universality of developed models is insufficient especially for the quality assessment of natural medicines.
The fruit of emblic(Phyllanthus Emblica L.)belonging to Euphorbiaceae is a popular natural medicine for treating cough and indigestion in China.It has been recorded in“Chinese Pharmacopoeia”.The World Health Organization has designated this species as a plant worth of extensive cultivation in the world because of its outstanding healthcare and medicinal functions.Phytochemical and pharmacological researchers have demonstrated that this product has a broad range of metabolic ingredients such as phenolic,flavonoids and terpenoids.These compounds are capable of producing many biological benefits such as antidiabetic,antioxidant,anticancer,and other additional benefits[17—21].This fruit,especially rich in vitamin C,has greater than 100 times the vitamin C contained in an apple.To the best of our knowledge,it is extensively distributed in many countries,including China,India and the American Continent.There is a considerable variance in the quality of embolic medicines that comes from these different regions.A rapid and effective spectroscopic quality aseessment strategy concerning different geographical origins is still lacking.Such a quality control strategy is required for the consistent supply of top-quality original materials.

Fig.2.The visualization of regional variation of emblic products constructed by the levels of six metabolites in these medicines.

Table 1 The levels of active compositions of emblic materials from different geographical origins.
With these ideas in mind,this study aimed to design a rapid and effective spectroscopic geographical traceability model for natural emblic medicines.Our research team collected different emblic materials(cultivated and wild)from seventeen geographical origins in six provinces of China during 2017.The main bioactive compounds(gallic acid,corilagin,chebulagic acid,ellagic acid,quercetin,and vitamin C)were first determined using a highperformance liquid chromatography-ultraviolet detection(HPLCUV)method.These ingredients largely determine the healthcare and medicinal properties of these materials so that the result can revealthequalityvariationsofthem abouttheir different geographical origins.An integrated spectroscopic analysis process was proposed using two high-throughput spectroscopic techniques of Fourier transform near-infrared(FT-NIR)and Fourier transform mid-infrared(FT-MIR).This work flow included spectral pretreatment,outlier diagnosis,feature selection,data fusion,and machine learning algorithm.Especially,twelve feature selection models including filter,wrapper and embedded were applied to collect informative spectral variables comparatively.Data fusion theory was further used to combine the information learned from two spectroscopic techniques.We hope this study can provide a universal geographical traceability strategy for emblic medicines and also promote the application of spectroscopic techniques for the quality assessment of multi-source natural medication.
2.Materials and methods
2.1.Reagents
Methanol(chromatographicgrade)waspurchased from Thermo Fisher Scientific(Shanghai,China).Deionized water used for chromatographic analysis was produced using an ultrapure water system(Millipore,USA).Chemical standards of gallic acid,corilagin,chebulagic acid,ellagic acid,quercetin,and vitamin C were provided by Chroma-Biotechnology Co.,Ltd.(Chengdu,China).Other analytical grade reagents were supplied by Chron Chemicals Co.,Ltd.(Chengdu,China).
2.2.Sample preparation
The detailed information of collected emblic materials from seventeen geographical origins in six provinces of Chinais shownin Table S1.Their fresh fruits and medicinal materials are shown in Fig.S1.The fruits of these plants were collected from September to December 2017.After removing the dirt from the surface,these samples were put into a drying oven for 24 h at 60°C.Then they were labelled according to their geographical origins and smashed using a powder machine.Power filtered with an 80 mesh sieve was used for final chromatographic and spectral analysis.Professor Yuntong Ma of Chengdu University of Traditional Chinese Medicine authenticated all the plants of P.emblica.
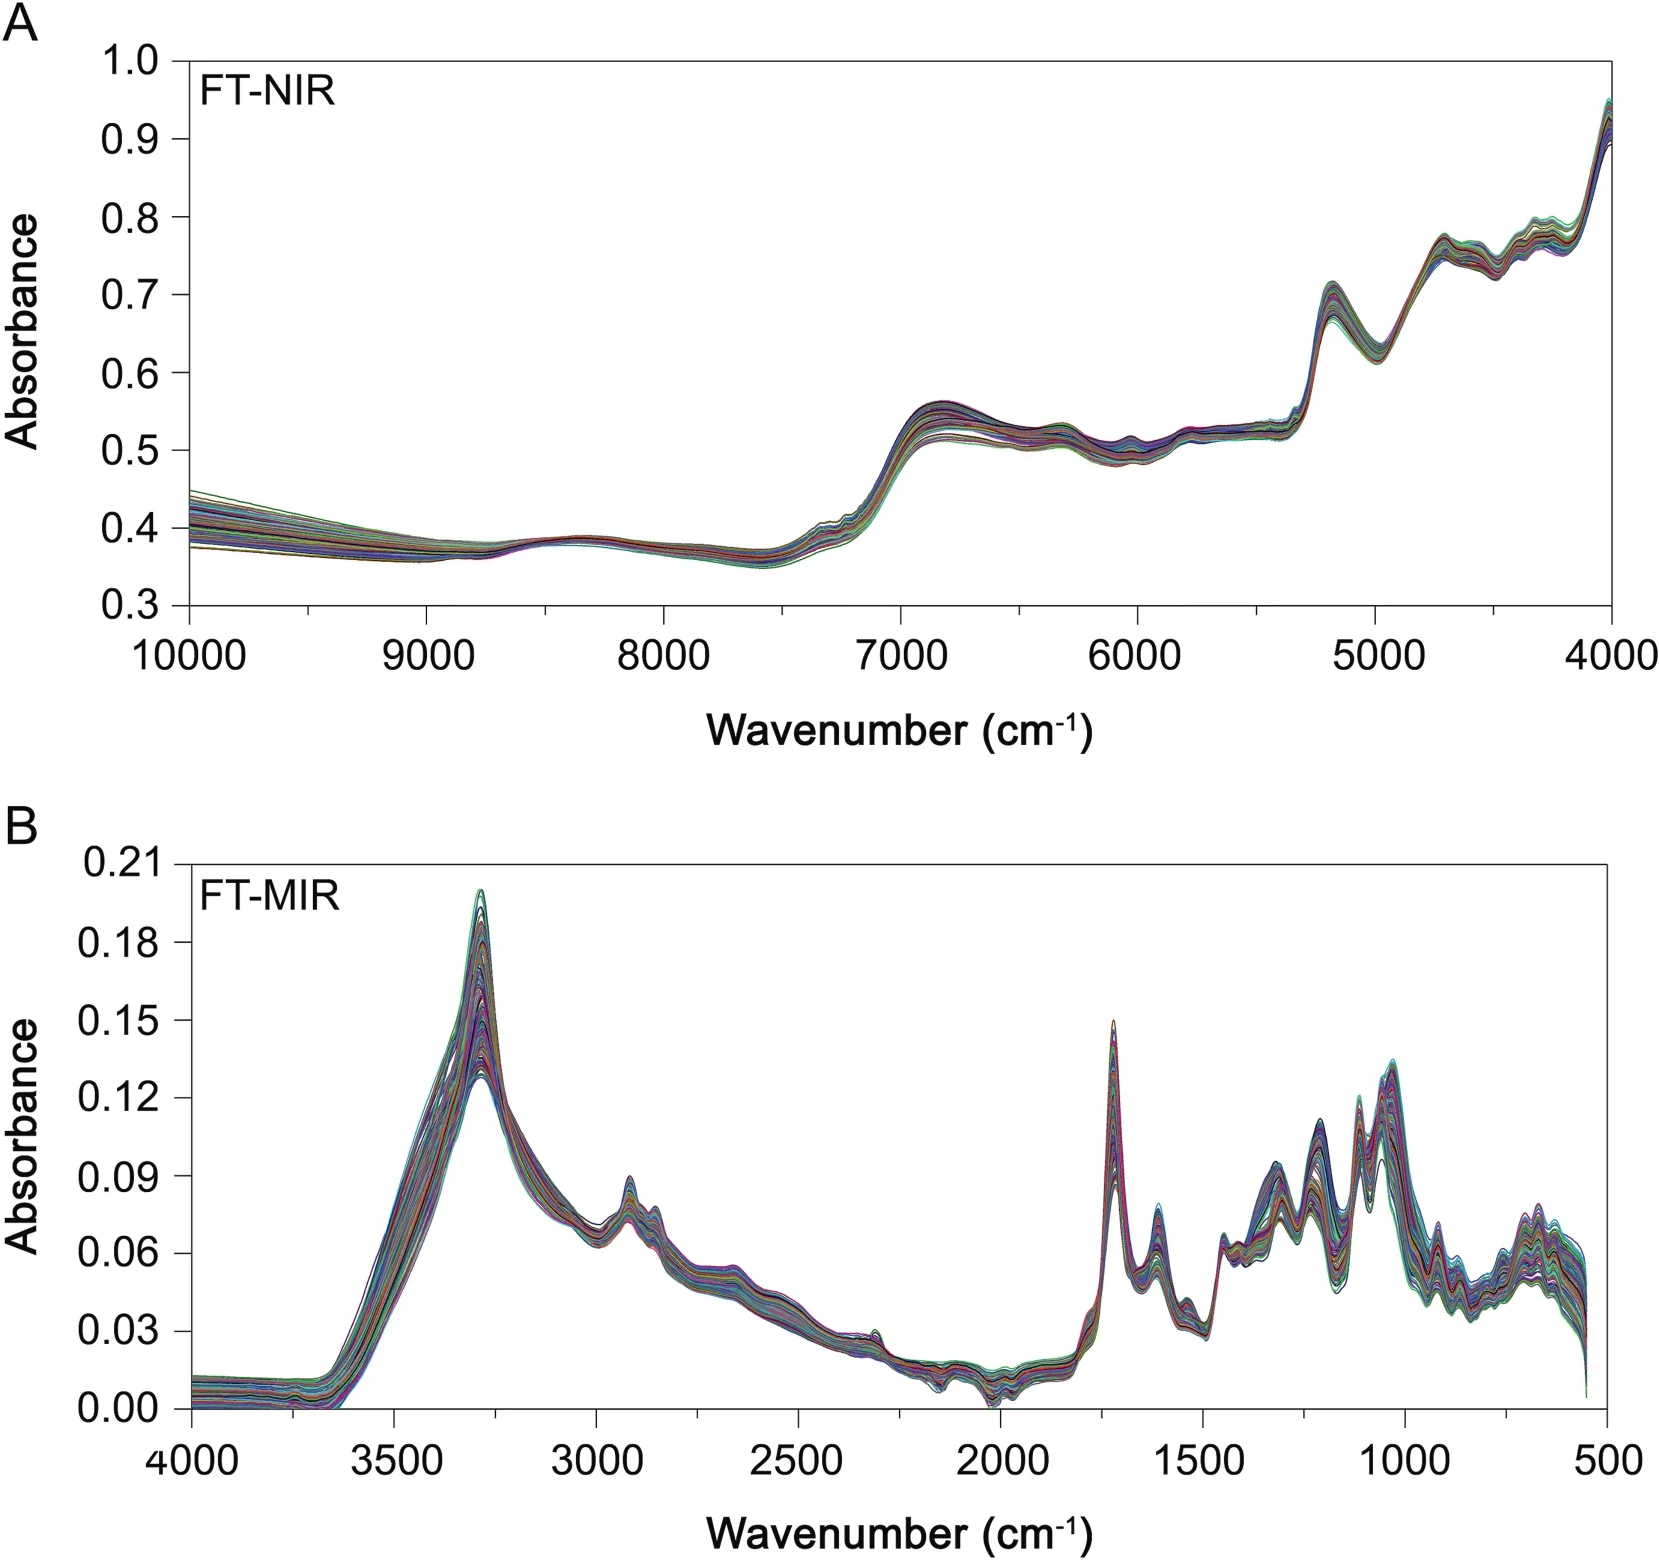
Fig.3.FT-NIR and FT-MIR spectra after spectral pretreatment optimization.
2.3.Chromatographic and spectral analysis
A Shimadzu system(Shimadzu,Japan)equipped with an LC-20AT quaternary pump,a SIL-20A XR autosampler,a CTO-20AC column oven,and an SPD-20A UV/Vis detector was utilized to determine bioactive compounds of emblic fruits.An Agilent ZORBAX Eclipse XDB-C18(4.6 mm × 250 mm,5μm)column was applied to separate objective compounds.
For the determination of gallic acid,corilagin,chebulagic acid,ellagic acid and quercetin,each sample of 0.100 g was first weighed.The powder was ultrasonically extracted in 10 mL methanol solution for 60 min.Other HPLC-UV conditions arelistedbelow:column temperature:30°C;mobile phase:methanol(A)and 0.1% phosphoric acid(B); flow rate:1 mL/min;elution gradient:0—15 min,5% A;15—35 min,5% —37% A;35—39 min,37% —47% A;39—60 min,47% —60% A;injection volume:5μL;detection wavelength:273 nm.
For the determination of vitamin C,each sample of 0.100 g was exactly weighed and then ultrasonically extracted in 10 mL of 0.5% oxalic acid for 30 min.Other HPLC-UV conditions are as follows:column temperature:30°C;mobile phase:0.1% phosphoric acid;flow rate:1 mL/min;isocratic elution:15 min;injection volume:10μL;detection wavelength:254 nm.All test solutions were filtered using a 0.45μm membrane before HPLC-UV analysis.
Two spectroscopic sensors of FT-NIR and FT-MIR spectrometers(PerkinElmer,USA)were used to directly record the spectral signals of sample powder without an extraction pretreatment.Their scan ranges were set as 10000—4000 and 4000—500 cm-1,respectively.The accumulated scans and resolution of two sensors were defined as 64 and 4 cm-1,respectively.Before the sample introduction,a blank control was scanned in order to remove any air interference.
For each sample,approximately 0.5 g powder was weighed using an electronic balance(Sartorius,Germany)and put into a sample cell of FT-NIR and FT-MIR instruments.For FT-MIR,an additional attenuated total reflection accessory was connected to enable sample powder to be directly detected without complicated preparation.Each spectrum was scanned in triplicate,and the average spectrum was used for final analysis.
3.Geographical traceability strategy
3.1.Spectral pretreatments
The spectral quality is susceptible to environmental factors.Many interference factors,including baseline drift and light scattering,decrease the analytic accuracy.Several pretreatments were conducted to optimize spectral data.Baseline correction was applied to produce a stable spectral baseline,and a smoothing algorithm(15 points)was used to remove the tinysignals which were useless for the next analysis.Multiplicative scatter correction eliminated the effect of light scattering caused by the particle size of powder[22].

Fig.4.Comparison of twelve feature selection models based on the KAP coefficient displaying the different efficiency of various feature selection models.

Fig.5.The first 100 important variables of FT-NIR and FT-MIR spectra,respectively,based on different models.
3.2.Outlier diagnosis
Anomaly samples can negatively impact model accuracy of geographical traceability.Therefore,two outlier detection tools were jointly used to ensure that the analyzed samples were free from abnormal points.
The first such tool can be regarded as a conventional clustering method based on Hotelling's T2distribution[23].Based on the principal component analysis,Hotelling's T2displays a confidence ellipse 95% confidence limit.Samples outside of this ellipse were generally regarded as outliers in our study.
The second method used to accomplish this goal was also an unsupervised algorithm called isolation forests(iForest),which is a state-of-the-art technique for handling high-dimensional data[24].It is an ensemble method utilized to combine many isolation trees.In brief,this method randomly selectedψpoints as sub-sampling size.For each tree,these partition points were recursively partitioned by randomly chosen attributes.The process was complete when all the samples were divided into single isolated subspaces.The average path length over selected trees was then recorded as iForest score for each sample.A sample with a low iForest score was classified as an outlier.In this study,two parameters of subsampling sizeψand tree number were set as 256 and 100,respectively.
3.3.Feature selection
Different types of feature selection techniques always perform various levels of efficiency for simplifying spectral data of natural medicines.Three feature selection theories(filter,wrapper,and embedded models)were utilized in our study to pick out the informative spectral variables according to their importance comparatively.
Filter models evaluate each variable according to their criteria instead of a specific machine learning classifier.Two unsupervised feature selection techniques of Laplacian Score(LS)[25]and Unsupervised Multi-Cluster Feature Selection(U-MCFS)[26]were first applied.The other two were supervised feature selection techniques which were called Supervised Multi-Cluster Feature Selection(S-MCFS)[26]and Infinite Latent Feature Selection(ILFS)[27].
Embedded models combine the superiorities of filter and wrapper models.This type of model always performs a high ef ficiency for feature selection.Least Absolute Shrinkage and Selection Operator(LASSO)[32]and Variable Importance in Projection(VIP)[33]were used as two linear embedded models because they were embedded into linear classifies.Additionally,Permutation importance(PIMP)[34]and Gini coefficient(Gini)[35]based on decision tree theory were also used to propose the best one.
3.4.Evaluation of feature selection model
The evaluation of feature selection models was an essential step in selecting the most useful spectral information to reflect the regional variation of emblic medicines.A repeated 10 fold crossvalidation procedure[36](three times)was used to evaluate the performance of each feature selection model.Because superabundant variables always enlarge the size of search space and lead toan over fitting model,we only used the first 400 variables according to their score ranking.These variables were circularly evaluated with an interval of 10.The best feature selection models were confirmed according to the accuracy of cross-validation regarding FT-NIR and FT-MIR datasets,respectively.

Fig.6.mtryoptimization process for an RF model according to the lowest OOB estimate.
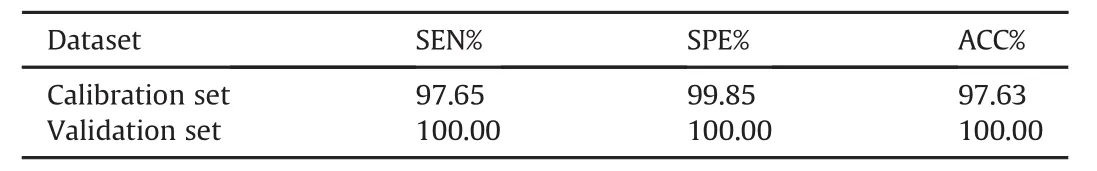
Table 2 The performance of the geographical traceability model of emblic fruits.
3.5.Data fusion and RF model
Data fusion was conducted on the feature level,because the feature selection models have been performed to select the informative variables from two spectral datasets,respectively.Based on data fusion theory,a combined data matrix related to regional variation of emblic medicines was generated.
RF algorithm is an ensemble learning algorithm combined by a certain number of tree classifiers(ntree),which are mutually independent of each other.It also has excellent performance against over fitting and noise resistance because the training process is random.First,the bootstrap sampling method is used to select a random number of samples for each tree classifier.Besides,a random subspace of variables(mtry)of each sample is applied for each tree classifier.The results of all tree classifiers are exported,and a majority vote is performed for a final decision.ntreeand mtryare determined according to the out-of-bag(OOB)estimate ntreein advance[37].
Four parameters of kappa(KAP),accuracy(ACC),sensitivity(SEN)and specificity(SPE)were together used for a balanced evaluation of our geographical traceability model.Overall,the model has several primary advantages over previous studies:(1)interferential and redundant signals were removed as much as possible;(2)multi-source descriptive data were well-utilized;(3)our proposed strategy is complete and can be effectively generalized.A simple data flow diagram for feature selection,data fusion,and the RF model is shown in Fig.1.
4.Results and discussion
4.1.Quality variation of emblic materials
Primary and secondary metabolites are the basis of natural medicines exerting their healthcare and medicinal functions.Some phenolics in emblic fruits are mainly responsible for their antioxidant activities and natural vitamin C source displays an important function on the prevention of cancers[38,39].
Nowadays,chromatographic analysis is the most fundamental technique for the quality assessment of medicinal plants because it can quantifymultiplebioactivecomponentssimultaneously[40,41].We first determined the six main metabolites(gallic acid,corilagin,chebulagic acid,ellagic acid,quercetin,and vitamin C)to investigate the quality variation of emblic materials originating from seventeen geographical origins.Chromatographic plots are exhibited in Fig.S2.Each calibration curve was established by plotting its peak area against the standard concentration(Table S2).Methodological examination, including precision, stability,repeatability and recovery,was conducted(Table S3).These results demonstrated that the HPLC-UV method could be applied to determine the quality variation of emblic medicines.
The levels of determined active compositions are shown in Table 1.The concentrations of gallic acid,corilagin,chebulagic acid,ellagic acid,quercetin and vitamin C of emblic materials originated from different geographicalorigins are 4.48—61.00 mg/g,0.77—9.82 mg/g, 4.82—32.31 mg/g, 0.90—13.00 mg/g,0.34—3.60 mg/g and 0.47—14.56 mg/g,respectively.Gallic acid in this product from CX origin is almost 14 times that from ST origin,and the vitamin C concentration from MY origin is 30 times more than that from HZ origin.This result shows an obvious quality variation of these fruits from different growing environments.
从Langmuir模型拟合参数中可得,花生壳的理论最大吸附量为 136.064 mg/g,碳纤维的最大吸附量为 487.363 mg/g。在Freundlich模型拟合参数中,花生壳试验值的拟合k值为 14.030,n值在 0.1 与 0.5 之间,说明花生壳对Cd2+的吸附能力强、易于发生吸附。
A PLS-DA model was developed to visualize their quality variation.The regional variation of these products is apparent because they are divided into several groups obviously(Fig.2).According to the loading plot,these six compounds play an essential role in this classification model(Fig.S3).The conclusion can be determined that geographical origins have a significant influence on the quality of emblic products.Because these species are extensively distributed in the world,an effective geographical traceability strategy is very essential for their quality assessment.Chromatographic techniques are always time-consuming,pollution producing and inaccurate to deal with this problem.Hence,two spectroscopic techniques were applied for a better solution for a geographical traceability model of emblic medicines.
4.2.Spectral pretreatment and outlier diagnosis
The raw FT-NIR and FT-MIR spectra of emblic products are visualized in Fig.S4.These original spectral signals are sensitive to the operating environment.The optimized spectra based on baseline correction,smoothing and multiplicative scatter correction are displayed in Fig.3.Comparatively,these approaches are effective in improving the spectral quality not only for the visualization of metabolic characterization but also for the subsequent data analysis.Many typical absorption peaks were raised,indicating that their metabolic characterizations are similar.Hence,the metabolic variation of emblic medicines from different geographical origins mainly reflects on the level of metabolic products,which can be partly explained by chromatographic results.
Two methods were together used for the outlier diagnostic.The result of Hotelling's T2distribution is shown in Fig.S5.Six observations of FT-NIR spectra and three observations of FT-MIR spectra are out of the 95% confidence limit.The result of iForest indicates that the scores of six FT-NIR observations are lower than 2.86 and three FT-MIR observations are smaller than 2.65,respectively(Table S4).Using 2.86 and 2.65 as the threshold scores regarding FTNIR and FT-MIR spectra,four outliers were additionally detected by this algorithm.Summary,a total of ten samples were identified as abnormal individuals and thus they were not used for the subsequent analysis.
4.3.The results of feature selection
After spectral pretreatment and outlier diagnosis,two preliminary data matrixes concerning FT-NIR(245×1556)and FT-MIR(245×1789)have been produced.They were too sizable to analyze directly.Twelve feature selection models( filter,wrapper and embedded)were comparatively used to simplify these data structures.
Fig.S6 shows the performance of four filter models.U-MCFS model performs the highest accuracy for FT-NIR with the ACC and KAP of 92.68% and 92.19% ,respectively,using the first 200 features.Regarding FT-MIR spectra,95.03% and 94.68% of ACC and KAP are calculated using the S-MCFS model with the first 100 features.
For wrapper models(Fig.S7),the first 120 FT-NIR features perform the best accuracy using the Boruta model,with ACC and KAP of 96.10% and 95.82% ,respectively.For FT-MIR spectra,the intelligence optimization algorithm of GA shows the best accuracy based on the first 40 features.The ACC and KAP are 94.82% and 94.46% ,respectively.
The results of embedded feature selections are presented in Fig.S8.Compared with two linear models of LASSO and VIP,nonlinear models of PIMP and Gini perform better results.The former performs 92.86% ACC and 92.36% KAP for FT-MIR spectra using the first 120 features.The latter technique performs 95.84% ACC and 95.55% KAP regarding FT-NIR spectra using the first 150 features.
4.4.The comparison of feature selection
We applied twelve different feature models,including filter,wrapper,and embedded models.A 3 times cross-validation procedure was performed to propose the best one for the optimization of sizable spectral datasets.They were well evaluated because a total of 30 random samplings were performed.The comparison of their KAP accuracy is displayed in Fig.4.
Feature selection models exhibit different performance for different datasets.Filter models have a weaker performance than other methods with a significant variation(P<0.05)for the FT-NIR dataset.The variation between the wrapper and embedded models was not significant.Considering feature number,validation accuracy and cost time together,we chose Boruta as the best method to simplify the FT-NIR dataset.
For the FT-MIR dataset,the variation among different types of feature selections is not significant.LS is the worst algorithmwith a significant variation to others(P<0.05).Comparatively,the S-MCFS model was selected as the optimized method to simplify this dataset.
The first 100 important variables of FT-NIR and FT-MIR spectra are visualized,respectively,in order to further compare the performance of feather selection models.As seen in Fig.5,LS and ILFS mostly focus on the local region of spectral data.This can explain why they performed a bad result.A local search strategy may be powerless regarding sizable spectral data.Conversely,SA and GA are the randomly global optimization algorithms.Their performances were acceptable,but too much time is needed to achieve these algorithms.For several excellent feature selections such as Boruta and S-MCFS,the features selected by them are mainly distributed on the informative spectral region of 7000-4000 cm-1for the FT-NIR dataset and 2000-500 cm-1for FT-MIR dataset.
Different feature selection models had different efficiencies when they were used to simplify spectral data.Multiple models need to be together applied to propose the best one for the spectral data optimization of natural medicines.Eventually,120 FT-NIR features and 100 FT-MIR features were selected using Boruta and S-MCFS models,respectively.This is the first time that filter,wrapper,and embedded feature selections were together used for spectral datasets of natural medicines.
4.5.Development of the geographical traceability model
An optimized data matrix was successfully generated via spectral pretreatment,outlier diagnosis,feature selection,and data fusion in turn.It contained 245 rows and 220 columns,which was simple,representative and informative.Such a data matrix could contribute to constructing an accurate and robust geographical traceability model of emblic medicines.
The OOB estimate is based on a bootstrap sampling procedure,which is an unbiased measurement.This parameter was closely related to a model fitting degree,and it can effectively enhance the generalization ability of the model.So it was used to adjust the parameters of an RF model.94 treeshad the best performance,with the lowest averagederrorof 0.029(Fig.S9).Then,a roughset from1 to 100 was designed to select the best mtry.As seen in Fig.6,mtry=65 has the best performance with an error of 0.023.Via the parameter adjustment process,the calibrated geographical traceability model was successfully developed with the OOB error reduced from 0.036 to 0.023.
A well-chosen external validation set based on Kennard-Stone sampling was imported into the calibrated model to evaluate its generalization performance[42].The confusion matrixes were produced in Table S5 and Table S6.Four samples from QXN,DL and CX groups are misclassified in the calibrated model.The SEN,SPE,and ACC are 97.65% ,99.85% ,and 97.63% ,respectively.All samples in the external validation set are correctlyclassified,with 100% of SEN,SPE,and ACC,respectively(Table 2).
5.Conclusion
Natural products are always the complex mixtures that consist of diversified chemical constitutes.Their metabolize characterizations are difficult to illustrate completely.Spectroscopic techniques have many advantages because they can contribute to a rapid and green quality detection for natural medicines.The time for collecting the FT-NIR and FT-MIR spectra of an emblic sample is less than 1 min without sample loss.
However,spectral data need to be carefully optimized before their application.When the feature subset is well prepared,spectroscopic techniques show a huge potential for the quality assessment of natural medicines on both qualitative and quantitative levels.These techniques should play a more important role in the field of quality assessment for Chinese medicine.
In this study,we presented an integrated analysis process of two spectral datasets to develop an effective geographical traceability model for emblic medicines.This model performed a 100.00% predicted accuracy for these medicines originating from seventeen geographical origins.These optimization steps included spectral pretreatment,outlier diagnosis,feature selection,data fusion,and machine learning algorithm.This analysis strategy also can be used in quantitative respect and is worth to generalize for the quality assessment of other natural multi-source medicines.
Conflicts of interest
The authors declare that there are no conflicts of interest.
Acknowledgments
This work is financially supported by the National Wild Plant Germplasm Resources Infrastructure which is the follow-up work of a project called Standardization and Community for the Collection and Preservation of Important Wild Plant Germplasm Resources(2005DKA21006).
Appendix A.Supplementary data
Supplementary data to this article can be found online at https://doi.org/10.1016/j.jpha.2019.12.004.
猜你喜欢
杂志排行
Journal of Pharmaceutical Analysis的其它文章
- Plant-derived secondary metabolites as the main source of efflux pump inhibitors and methods for identification
- Polysaccharide-based chromatographic adsorbents for virus purification and viral clearance
- Structural basis of SARS-CoV-2 3CLpro and anti-COVID-19 drug discovery from medicinal plants
- Structural elucidation of SARS-CoV-2 vital proteins:Computational methods reveal potential drug candidates against main protease,Nsp12 polymerase and Nsp13 helicase
- Rapid detection of high-risk HPV16 and HPV18 based on microchip electrophoresis
- Solid and liquid state characterization of tetrahydrocurcumin using XRPD,FT-IR,DSC,TGA,LC-MS,GC-MS,and NMR and its biological activities