Type I and type II Helicobacter pylori infection status and their impact on gastrin and pepsinogen level in a gastric cancer prevalent area
2020-08-18LinYuanJunBoZhaoYingLeiZhouYaBinQiQiongYaGuoHaiHuiZhangMuhammadNomanKhanLingLanChangHeJiaYanRuiZhangSongZeDing
Lin Yuan, Jun-Bo Zhao, Ying-Lei Zhou, Ya-Bin Qi Qiong-Ya Guo, Hai-Hui Zhang, Muhammad Noman Khan,Ling Lan, Chang-He Jia, Yan-Rui Zhang, Song-Ze Ding
Abstract
Key words: Helicobacter pylori; Chronic gastric diseases; Gastrin-17; Pepsinogen; Gastric cancer
INTRODUCTION
Helicobacter pylori(H. pylori) infection is the major cause of chronic gastritis, peptic ulcers, gastric cancer and mucosa-associated lymphoid tissue lymphoma, it is also associated with many extra gastrointestinal diseases[1-3].H. pyloricytotoxin CagA and VacA are major virulence factors and molecular basis for disease pathogenesis.H. pyloristrains that carrycagPAI with CagA-, VacA-positive cause severe gastric inflammation, which contributes to either tissue damage or neoplastic transformation, are high-risk strains of gastric cancer, and the role of CagA protein is critical in these processes[4]. Studies have shown that there is both genotypic and geographic diversity ofH. pyloriinfection, which can trigger different inflammatory processes and result in various degrees of pathological consequences[4-6].
Type IH. pyloriexpresses CagA and VacA protein; type II strain does not express CagA and VacA[7]. CagA-, VacA-positive strains are the major forms ofH. pyloriinfection in many areas globally, corresponding to their high prevalence in precancerous lesions and gastric cancer incidences[4]. However, their infection status and roles in the stepwise gastric disease progression in this high gastric cancer prevalent area has not been studied[8].
Serological detection of pepsinogen (PG) I, II, PG I/PG II ratio and gastrin-17 (G-17) provide valuable information on the status of gastric mucosa, and they have been used as epidemiological markers for gastric cancer risk investigation[9-12]. Studies have indicated that low concentrations of PG I and PG I/PG II ratios are indicators of gastric atrophy, which are linked with elevated gastric cancer risk[9,10]. However, others have indicated that the results are not consistent and not sensitive enough to replace endoscopy[11,12]. PG I/PG II ratio also should not be used as a biomarker of gastric neoplasia as recommended[1]. It is therefore uncertain if they might be suitable to evaluate stepwise gastric disease progression and development of mucosal precancerous conditions in the presence or absence ofH. pyloriinfection in clinical practice.
In the present study, we investigated the prevalence of type I and type IIH. pyloriinfection in stepwise chronic gastric diseases and the clinical implications. Their impact on G-17 and PGs levels was also evaluated. The results indicated that there is a stepwise increase in type IH. pyloriinfection rate as disease progress from chronic gastritis to gastric cancer. Both types ofH. pyloriinduce an increase in G-17 level, while type IH. pyloriis the major strains that affects PG I, PG II levels and PG I/PG II ratio in chronic gastric diseases in this geographic region. The results provide insight on the subtypes ofH. pyloriinfection status and their impact on G-17 and PGs, which will be helpful to guideH. pylorieradication and application of G-17 and PGs assay in clinical practice.
MATERIALS AND METHODS
Study population
This cross-section study was conducted at the Department of Gastroenterology, People’s Hospital of Zhengzhou University, Zhengzhou, Henan, China. From March 2018 to March 2019, a total of 3572 consecutively ward admitted patients with upper gastrointestinal symptoms were examined. Exclusion criteria were as follows: (1) Taking proton pump inhibitors, bismuth salts, H2-receptor blockers or other medications that could affect test results over the past 2 wk, taking antibiotics over the past 1 mo; (2) Severe concomitant diseases such as liver, kidney, nervous system or cardiac dysfunction; (3) People with active upper gastrointestinal bleeding; (4) Patients with a history of gastrointestinal surgery for gastric cancer, esophageal cancer or gastric adenoma; and (5) People with mental illness or severe neurosis, affecting correct expression or study. The study finally enrolled 523 patients, the flow chart of patient screening is summarized in Figure 1.
All 523 enrolled patients were examined by upper-endoscopy to get pathological confirmation. Based on histopathologic types, subjects were categorized into five groups: Non-atrophic gastritis (NAG), non-atrophic gastritis with erosion (NAGE), chronic atrophic gastritis (CAG), peptic ulcers (PU) and gastric cancer (GC). Demographic data of patients including age and gender were recorded, andH. pyloriCagA, VacA status, G-17, PG I, II levels and PG I/PG II ratio were analyzed. The research protocol was approved by the Ethics Committee of People’s Hospital of Zhengzhou University (2019-KY-No. 10); informed consents were obtained from all participating patients.
Measurement of H. pylori infection
The status ofH. pyloriinfection was confirmed by both13C-urea breath test (UBT) and serologicalH. pyloriantibody test, patients were considered not infected when both tests were negative; when patients were either13C-UBT or serologicalH. pyloriantibody positive, but not both, they were not enrolled to avoid false-positive or -negative results.13C-UBT was performed after overnight fasting, a baseline breath sample was obtained by blowing gas into a bag container, and a powder capsule containing 50 mg of13C-urea was given to patients with 80-100 mL water. The second breath sample was collected after 30 min of meditation. Patients were consideredH. pyloripositive if the difference between baseline sample and 30-min sample exceeded 4.0 arbitrary units by13C-breath test (HY-IREXC 16 channel; Huayou Mingkang Photoelectric Technology Co., Ltd, Guangzhou, China).

Figure 1 Flowchart of enrolled patients–screening program.H. pylori: Helicobacter pylori.
Serological measurements of H. pylori antibody, G-17 and PGs
Five milliliters of fasting venous blood sample was collected from each participant. All samples were centrifuged at 1500 ×gfor 5 min and analyzed within 2 h of blood collection. Serum anti-H. pyloriantibody, G-17, PG I, PG II levels, and PG I/PG II ratio were measured by enzyme-linked immunosorbent assay (ELISA) kit (Helicobacter pyloriELISA kit, Blot Biotech Co., Ltd, Shenzhen, China; PG I, PG II, G-17 ELISA kits, Biohit Biotechnology Co., Ltd. Anhui, China). The procedure followed manufacturers’ instructions; quality control analysis showed that the coefficient of variation in intrabatch and inter-batch sample tests was less than 10%.
Determination ofH. pyloripositivity from blood samples: (1) Type IH. pyloriantibody positive: either or both CagA and VacA bands were present; (2) Type IIH. pyloriantibody positive: only one of urease (Ure) A and UreB bands or both appeared, no CagA, VacA bands were present; and (3)H. pyloriantibody negative: Only control band appeared in the color-developing zone, and no positive zone was observed. RepresentativeH. pyloriserological test blot pictures are provided in Supplementary Figure 1.
Endoscopic and histopathological evaluation
Histopathological diagnosis was available in all enrolled 523 patients. Two pieces of biopsy specimen were obtained from the lesion area, antrum and angulus during endoscopic examination. The biopsies were oriented, fixed in formalin, embedded in paraffin blocks and then sectioned and stained with hematoxylin and eosin for histopathological analysis. For histologic sections where there was initial disagreement on histopathologic interpretation, the final results were determined through adjudication among two pathologists and a third pathologist.
Statistical analysis
Data were analyzed using SPSS for Windows Version 22 (Armonk, NY, United States). Continuous variables were described as mean ± standard deviation, while categorical variables were described as percentages or frequencies. All data were tested for normal distribution by Kolmogorov-Smirnov test and homogeneity of variances by Levene’s test. Data of normal distribution and similar variances were tested by Student’s “t” test for two independent samples comparison, and analysis of variance for multiple comparisons among different groups. A comparison of ratios was made by theχ2test. APvalue less than 0.05 was considered statistically significant, which was derived from two-tailed tests. Receiver operating characteristic (ROC) curves were used to calculate the overall diagnostic performance of G-17, PG I, PG II, and PG I/PG II ratio in PU, CAG and GC patients to determine the best cutoff values, sensitivity and specificity.
RESULTS
Overall H. pylori infection status of patients
H. pyloriinfection status of 3572 patients is presented in Figure 1. Among which, 2714 (76.0%) patients were positive either by UBT test, serological test or both, and 858 (24.0%) patients were negative. AmongH. pylori-positive patients, 1226 were excluded due to either surgery, medication or bleeding reasons, and 1086 patients were excluded due to either only13C-BUT or serum antibody test positive but not both; the final enrolled patient number was 402 with both tests being positive. In 858H. pylorinegative patients, 737 patients were excluded either due to bleeding, surgery or severe organ diseases; this resulted in only 121 patients being enrolled with both tests being negative. Interestingly, we noticed almost identicalH. pyloriinfection rates when comparing the prior- and post-excluded non-enrolled patients. The infection rates of the final enrolled patients were 76.9% positive and 23.1% negative (Figure 1).
Patient clinical data and H. pylori infection status
Among the 523 enrolled patients, 305 were male and 218 were female, with an average age of 53.4 ± 11.6 years (range from 28 to 79). Their clinical characteristics andH. pyloriinfection status are presented in Table 1. Patients in 51-60 and 61-80 years age groups had the highestH. pyloriinfection rates of 78.5% (150/191) and 78.4% (116/148), respectively. The average age of patients in the GC group was significantly higher than that in NAG, NAGE and PU groups (P< 0.05). The mean age of the CAG group was higher than that in the NAG group (P< 0.001). There was no significant difference inH. pyloriinfection status between male and female gender.H. pyloriinfection in male and female genders were mainly type IH. pyloristrains (54.8%, 56.9% respectively), which were significantly higher than that of type II andH. pylorinegative patient groups (range from 20.2%-23.3%). There was a significant male dominance in CAG, PU and GC groups (P< 0.05). Among 77 CAG patients, 48 (62.3%) patients were antrum atrophic gastritis and 29 (33.8%) were corpus atrophic gastritis, and all 43 gastric cancer patients were intestinal type.
Prevalence of Type I and Type II H. pylori infection in stepwise chronic gastric diseases
TotalH. pyloriinfection rate of 523 patients was 76.9% (402/523), of which type IH. pyloriinfection rate was 72.4% (291/402), and type II infection rate was 27.6% (111/402). Overall, 88.4% of GC patients wereH. pyloripositive, and 84.2% of them were type I infection, only 11.6% of GC wereH. pylorinegative. As the disease progressed,H. pyloriinfection rate was gradually increased in NAG, NAGE, PU, CAG and GC groups; among whichH. pylori-positive rate reached the highest level in PU group, accounting for 90.4% (85/94) of the patients. Infection rates of type IH. pyloriin NAG, NAGE, PU, CAG and GC groups were 67.9%, 62.7%, 77.6%, 79.7%, 84.2%, respectively; and was significantly higher than the corresponding type IIH. pylorigroups; and type IH. pyloriinfection rates were also higher in PU, CAG, and GC groups when compared with the NAG group (Table 2).

Table 1 Patient clinical data and Helicobacter pylori infection status

Table 2 Infection rates of type I and type II Helicobacter pylori in stepwise chronic gastric diseases
Distribution of H. pylori CagA, VacA, UreA and UreB in stepwise chronic gastric diseases
Positive rates of CagA, VacA, UreA and UreB antibodies are described in Table 3. In 402 infected samples, the percentage of CagA, VacA, UreA and UreB were 70.1%, 61.9%, 70.6% and 98.8%, respectively. CagA antibody was detected in 63.3%, 60.0%, 76.5%, 79.7% and 84.2% in NAG, NAGE, PU, CAG and GC groups, respectively. The positive rates of CagA and VacA were highest in GC group and lowest in NAGE group. UreB antibodies were present in 98.8% of patients withH. pyloriinfection, and there was no statistical differences between disease groups (P> 0.05).
Effects of H. pylori infection on overall G-17, PG I, PG II levels and PG I/PG II ratio
Overall serum G-17, PG I, PG II values and PG I/PG II ratio at differentH. pyloriinfection status are shown in Table 4. G-17 and PG II values inH. pyloriinfectedgroups were significantly higher and PG I/PG II ratio were lower than those inH. pylori-negative patients(P< 0.05); while PG I level was not different betweenH. pyloripositive and -negative groups (P> 0.05). There was also no significant difference in PG I levels between type I and IIH. pylori-infected patients. G-17 and PG II levels were significantly increased and PG I/PG II ratio were decreased only in patients with type IH. pyloriinfection when compared with type II andH. pylori-negative patients (P< 0.05).
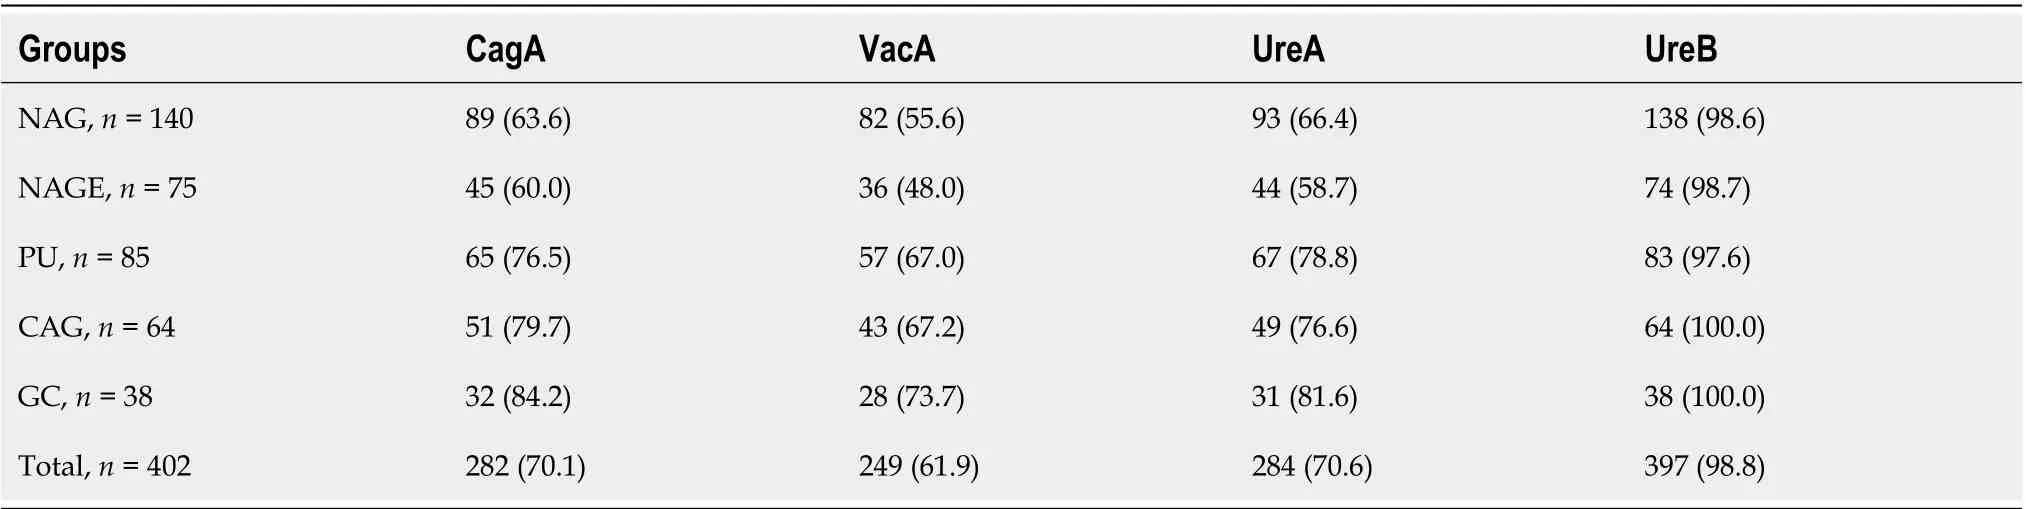
Table 3 Distribution of CagA, VacA, UreA and UreB serological antibodies in stepwise chronic gastric disease

Table 4 Effects of Helicobacter pylori infection on gastric gastrin-17, pepsinogen I, pepsinogen II levels and pepsinogen I/II ratios
Receiver operating characteristic curves for G-17, PG I, PG II and PG I / PG II in the prediction of CAG, PU and GC patients
Figure 2 shows ROC curves for G-17, PG I, PG II and PG I/PG II in the prediction of CAG, PU and GC patients. ROC curves for predicting PU based on G-17, PG I, PG II and PG I/PG II ratio are listed in Figure 2 a1-2. Area under the receiver operating characteristic curves (AUROC) were 0.579 (95%confidence interval (CI): 0.514-0.643), 0.663 (95%CI: 0.599-0.729) and 0.653 (95%CI: 0.593-0.713), and 0.529 (95%CI: 0.460-0.598); cut-off values of Youden index were 5.91 pmol/L, 146.20 µg/L, 13.31 µg/L and 9.49, respectively; the sensitivity was 45.7%, 52.1%, 62.8% and 55.3%, respectively; and specificity was 69.4%, 76.9%, 64.5% and 54.0%, respectively.
ROC curves for predicting CAG based on G-17, PG I, PG II and PG I/PG II ratio are listed in Figure 2 b1-2. AUROC were 0.550 (95%CI: 0.474-0.626), 0.531 (95%CI: 0.455-0.607), 0.610 (95%CI: 0.535-0.684) and 0.623 (95%CI: 0.552-0.694), respectively; the cutoff values of Youden index were 4.63 pmol/L, 110.7 µg/L, 7.41 µg/L and 9.37, respectively; the sensitivity was 71.4%, 68.8%, 50.5% and 68.8%, respectively; and specificity was 39.4%, 46.0%, 70.9% and 49.8%, respectively.
ROC curves for predicting GC based on G-17, PG I, PG II and PG I/PG II ratio are listed in Figure 2 c1-2, AUROC were 0.786 (95%CI: 0.737-0.834), 0.634 (95%CI: 0.533-0.735), 0.719 (95%CI: 0.646-0.792) and 0.760 (95%CI: 0.684-0.836), respectively; cut-off values of Youden index: 6.21pmol/L, 174.49 µg/L, 14.83 µg/L and 6.47, respectively; the sensitivity was 88.4%, 53.5%, 68.8% and 67.4%, respectively; and specificity was 68.3%, 81.0%, 64.4% and 72.7%, respectively.

Figure 2 Receiver operating characteristic curves for gastrin-17, pepsinogen I, pepsinogen II and pepsinogen I / pepsinogen II in prediction of chronic atrophic gastritis, peptic ulcers and gastric cancer patients. Receiver operating characteristic (ROC) curves of gastrin-17 (G-17), pepsinogen (PG) I, PG II level and PG I/PG II ratio in predicting chronic atrophic gastritis (CAG), peptic ulcers (PU) and gastric cancer (GC) patients. a1-2: ROC curves of PG I/PG II ratio, G-17, PG I and PG II values for predicting PU; b1-2: ROC of PG I/PG II ratio, G-17, PG I and PG II values for predicting CAG; c1-2: ROC of PG I/PG II ratio, G-17, PG I and PG II values for predicting GC. PG: Pepsinogen; PU: Peptic ulcers; AUROC: Area under receiver operating characteristic curve; CAG: Chronic atrophic gastritis; G-17: Gastrin-17; GC: Gastric cancer.
Effects of type I and type II H. pylori infection on G-17, PG I, PG II levels and PG I/PG II ratio in gastric diseases
Table 5 shows the stratified disease group analysis results. G-17 levels in NAG, NAGE and GC groups inH. pylori-infected patients were significantly higher than that ofH. pylori-negative patients (P< 0.05), and this effect was mostly from type I infection, as type IIH. pyloriinfection andH. pylori-negative group did not show a difference acrossdisease groups. In PU patients, the level of G-17 in type IH. pylori-positive patients was significantly higher than that in type IIH. pylori-infected patients (P<0.05). G-17 levels in the GC group were significantly higher when compared with NAG, NAGE and CAG groups in bothH. pylori- and type IH. pylori-infected patients.
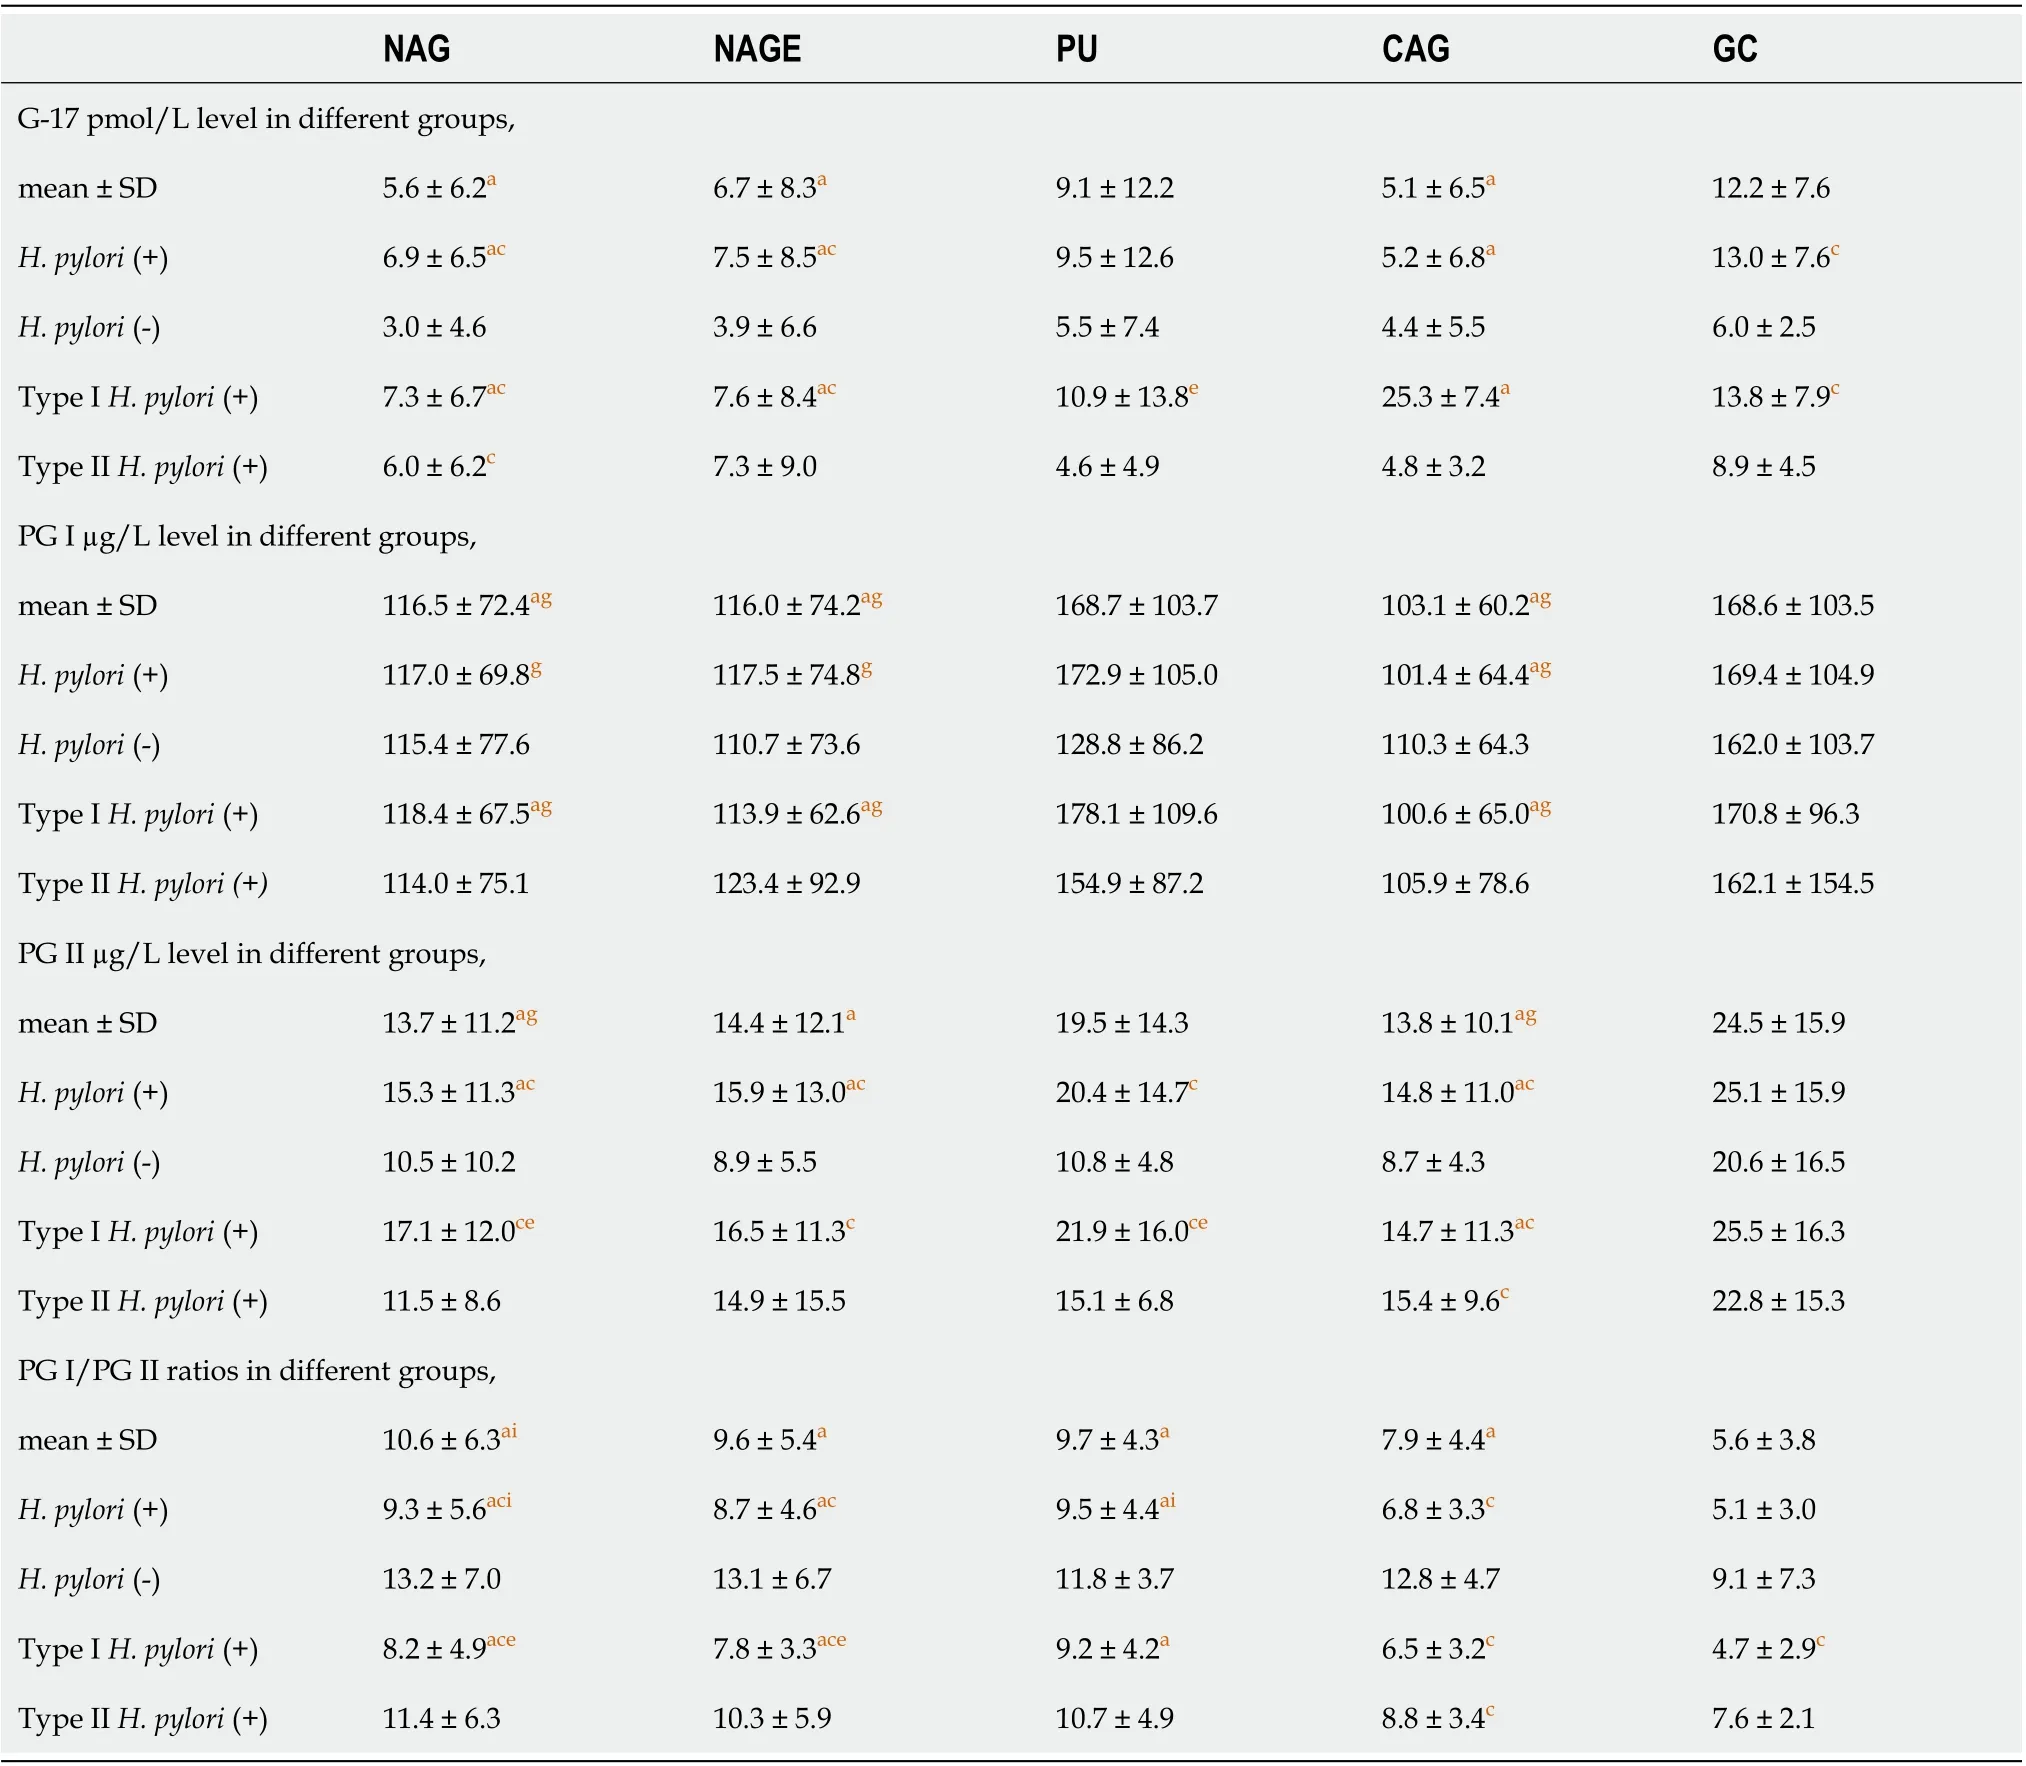
Table 5 Effects of Helicobacter pylori infection on gastric gastrin 17, pepsinogens levels in stepwise chronic gastric diseases
PG I levels in type IIH. pylori-positive andH. pylori-negative patients showed no difference among all disease groups, while PG I level in GC group was significantly higher when compared with NAG, NAGE and CAG groups only in both type I andH. pylori-positive patients (P<0.05).
PG II levels inH. pylori- and type IH. pylori-infected patients were significantly higher in NAG, NAGE, PU and CAG groups when compared withH. pylori-negative patients (P< 0.05) except in the GC group, which showed no difference. PG II levels inH. pylori-negative and type IIH. pylori-infected patients had no difference among all disease groups. InH. pylori-infected patients, PG II level was significantly higher in the GC group than that in NAG, NAGE and CAG groups. PG II level was also higher in the GC group over the CAG group in type IH. pylori-infected patients.
PG I/PG II ratios ofH. pylori- and type IH. pylori-positive patients were lower when compared withH. pylori-negative patients in NAG, NAGE and CAG groups (P< 0.05). Except for the CAG group, PG I/PG II ratios in type IIH. pylori-infected groups were not significantly different from those inH. pylori-negative groups (P> 0.05). In type II andH. pylori-negative patients, PG I/PG II ratios showed no difference across different disease groups (P> 0.05); while PG I/PG II ratio of bothH. pylori- and type IH. pyloripositive patients was significantly lower in the GC group when compared with the NAG, NAGE and PU groups (P< 0.05) (Table 5).
DISCUSSION
H. pyloricytotoxins CagA and VacA are major virulence factors and pathogenic mechanisms. Virulent strains are associated with increased risk of gastroduodenal disorders, but virulence varied among different strains ofH. pylori[4-6,13]. Clinical relevance of type IH. pyloriinfection in gastric disease and gastric cancer has been very well defined, but the mechanism of type IIH. pylori-induced gastric disease needs further exploration. The present results have demonstrated that type IH. pyloriis the major form of infection in stepwise gastric diseases in present region, which is a high gastric cancer risk area[8].
Meta-analyses[4,14]have shown that CagA seropositivity are correlated with the occurrence of gastric cancer amongH. pylori-infected patients. Sheikhet al[15]examined 201 patients infected byH. pyloriand found thatcagA gene was detected in 66.7% of the isolates; positive rates ofcagAgene in gastric cancer and peptic ulcer patients were 68.2% and 71%, respectively. Kimet al[16]found thatH. pyloriinfection in South Koreans was closely related to highly virulent strains [vacA s1/i1/m1, cagA(+),iceA1(+),and oipA(+)] and has an intimate association with the progression of peptic ulcer diseases. A recent survey of the high gastric cancer incidence area in Shandong Province, China showed[17]that seroprevalences of CagA, VacA antibodies in 573H. pylori-infected patients were 83.9%, 38.9%, respectively; suggesting that CagA-positive strains are the dominant form of infection in Chinese population and are associated with progression of gastric mucosal lesions.
Here, we noted a high infection rate ofH. pyloriin GC patients, where 88.4% of GC areH. pyloripositive, 84.2% of them are type I infection, and only 11.6% of GC areH. pylorinegative. Such a high rate ofH. pyloriinfection in GC patients has not been reported in this area previously. A Japanese study in 2011 indicated thatH. pylorinegative gastric cancers are rare in Japan[18], and both intestinal type and diffuse type of gastric cancer are closely related toH. pyloriinfection[19]. The current results are in line with these results, and indicate an important role of type IH. pyloriin the development of upper gastrointestinal diseases and gastric cancer. It is also worth exploring further the mechanism ofH. pylori-negative and type IIH. pylori-infected GC patients.
PG I is produced by chief cells and mucosal neck cells in the fundic glands, whereas PG II is produced in fundic glands, pyloric glands and Brunner’s glands. Gastric inflammation can lead to increased release of both pepsinogens into the bloodstream, with a greater increase in PG II than in PG I[20]. Other previous studies[8,9,21]have reported that low PG I levels and/or low PG I/PG II ratios are associated with increased risk of gastric cancer. PG I < 70 µg/L and PG I/PG II ratio < 3.0 have been frequently applied as the thresholds for defining population with high-risk of gastric cancer.H. pyloriinfection causes chronic inflammation of gastric mucosa[22]and affects the secretion of PGs and gastrin, but very few studies have explored the different effects of type I and type IIH. pylorion G-17 and PGs levels.
In this study,H. pylori-positive patients have high levels serum PG II and G-17 and lower levels of PG I/PG II ratio when compared withH. pylori-negative patients. The results are in agreement with previous reports[20,23]. Our study further found that type IH. pyloriinfection result in a significant increase in PG II levels and a marked decline of PG I/PG II ratios when compared with type IIH. pyloriinfection, which is an effect that has not been shown previously. We also noted that PG I levels have no difference inH. pylori-negative and type IIH. pylori-positive patients across different disease groups. PG I levels were significantly increased in GC and PU patients inH. pylori- and type IH. pylori-infected group over the NAG, NAGE and CAG group patients. The results differ from previous reports that found low PG I level is associated with GC risk[24], probably due to different analysis methods or patients population involved. Further research is needed to explore the effect ofH. pylorion PG I level in different gastric diseases.
Hypergastrinemia is more common in patients withH. pylori-infected gastroduodenal diseases, which may be one cause of precancerous lesions or gastric cancer[25,26]. Gastrin is synthesized and secreted from antral G-cells.H. pylori-associated gastritis tends to raise serum gastrin levels, which is possibly due to hyperplasia of antral G-cells and an acid-suppressive effect of chronic gastritis when the corpus mucosa is involved. Our study shows a significant increase in G-17 inH. pyloripositive patients, which is consistent with previous results[25,26], and we further find that the levels of G-17 in type IH. pyloriinfected patients are significantly higher than that in type IIH. pylori-infected patients (P< 0.05). The response of G-17 toH. pyloriappears to be disease stage dependent, as in PU and CAG patients; there is no difference when compared withH. pylori-negative controls. Further studies are required to elucidate its pathogenesis inH. pylori-induced carcinogenesis.
In the current study, as the disease progresses, the levels of G-17, PG I, PG II and PG I/PG II ratios do not show differences in allH. pylori-negative and type IIH. pyloripositive groups. In contrast, in type IH. pylori-positive groups, G-17, PG I and PG II levels are significantly higher and PG I/PG II ratios are lower in GC patients when compared with NAG, NAGE and CAG patients. The explanation of the results is probably due to the presence of CagA-, VacA-proteins, which are majorH. pylorivirulence factors that cause greater epithelial injury and mucosal inflammation, including the release of inflammatory mediators or cytokines that affect epithelial cell homeostasis, therefore resulting in disturbed secretion of PGs and gastrin[27,28].
Application of G-17, PG I, PG II levels and PG I/PG II ratios in gastric cancer epidemiology study have been reported extensively, although their predicative values in stepwise gastric disease in clinical studies have not been very well defined. Previous investigations have generated inconsistent conclusions[9-12], and our results using AUROC analysis (Figure 2) indicated relatively low predictive value range from 0.529-0.786 for PU, CAG and GC patients, and type IH. pyloriinfection is the major factor that affects their levels as the disease progresses. These data provide insight to evaluate their application during clinical practice and are helpful in explaining the results.
In CAG patients, we also noticed that our PGI level and PG I/PG II ratios are slightly higher when compared with other reports[9-12], and as all the CAG patients have histological confirmation, we therefore consider this effect could be due to patient population- or region-based variations, or might be due to variations from the degrees of atrophy itself. Future studies are required to explain these discrepancies.
Results of this study also show thatH. pyloriinfection rate in our hospitalized patients is 76.9%, which is higher than that in the general population[1,2]. This could be because all patients enrolled in this study have gastrointestinal symptoms, so the infection rate ofH. pyloriis reasonably higher. One important difference between the current investigation and previous studies is that screening criteria for patients withH. pyloriinfection is more strict, as patients with only both13C-BUT and serologicalH. pyloriantibody positive were enrolled. This selection makes our research results more accurate and reliable, allowing for the true status ofH. pyloriinfection and reducing the possibility of false-positives and -negatives. Moreover, the fact that the proportions ofH. pyloriinfection rates prior- and post-patient selections are almost identical indicates that the data analyses are reliable and not biased.
In conclusion, the present study evaluated type I and type IIH. pyloriinfection status in chronic gastric disease and their impact on commonly used gastric cancer risk markers, such as PG I and PG II levels and PG I/PG II ratio in this high gastric cancer risk area. We noted thatH. pyloriinfection rate is high in our gastric cancer patients, and only about 11.6% of gastric cancers wereH. pylorinegative. Type IH. pyloriwas the major form of infection. Our results also reveal that the effects ofH. pylorion PG I, PG II and PG I/PG II ratio are mostly from type I strain infection and not from type II strain infection. The data provide insight inH. pylori-induced carcinogenesis and will be helpful to guide clinical practice forH. pylorieradication, to explain G-17 and PGs clinical results and for disease prevention.
ARTICLE HIGHLIGHTS

Research objectives
We investigated the prevalence of type I and type IIH. pyloriinfection in stepwise gastric diseases and the clinical implications; their impact on G-17 and PGs levels during routine clinical practice were also evaluated.
Research methods
Five hundred and twenty-three hospital admitted patients were enrolled in this study.H. pyloriinfection was confirmed by both13C-urea breath test and serological assay. Their serological G-17, PG I, PG II values and PG I/PG II ratio were also measured. Receiver operating characteristic curves were used to calculate the overall diagnostic performance of G-17, PG I, PG II and PG I/PG II ratio in peptic ulcers (PU), chronic atrophic gastritis (CAG) and gastric cancer (GC) patients to determine the best cutoff values, sensitivity and specificity.
Research results
The infection rate of 523 enrolled patients was 76.9%, among which type IH. pyloriinfection accounted for 72.4%, and type II was 27.6%. Overall, 88.4% of GC patients wereH. pyloripositive, 84.2% of them were type I infection, and only 11.6% of GC patients wereH. pylorinegative.H. pyloriinfection resulted in significantly higher G-17 and PG II values and decreased PG I/PG II ratio. Both types ofH. pyloriinduced higher G-17 level, but type I strain infection resulted in an increased PG II level and decreased PG I/PG II ratio in NAG, NAGE and CAG patients. PG I levels showed no difference among disease groups, and only showed a difference in stratified analysis in GC and PU patients. The diagnostic performance of G-17, PG I, PG II and PG I/PG II ratio in PU, CAG and GC patients indicated relatively low predictive value.
Research conclusions
Type IH. pyloriinfection is the major form of infection in this geographic region, and a very low percentage (11.6%) of GC patients are not infected byH. pylori. Both types ofH. pyloriinduce an increased G-17 level, while type IH. pyloriis the major strain that affects PG I, PG II levels and PG I/PG II ratio in stepwise chronic gastric diseases.
Research perspectives
The results provide insight onH. pyloriinfection status in hospital admitted patients, and their impact on G-17 and PGs levels, which will be helpful to guideH. pylorieradication and explain G-17 and PGs assay results in clinical practice.
ACKNOWLEDGEMENTS
Authors are grateful to the staff of the Department of Gastroenterology and Hepatology, People’s Hospital of Zhengzhou University for their valuable assistance in this work.
杂志排行

World Journal of Gastroenterology的其它文章
- Chinese expert consensus and practice guideline of totally implantable access port for digestive tract carcinomas
- Monoacylglycerol lipase reprograms lipid precursors signaling in liver disease
- Retrievable puncture anchor traction method for endoscopic ultrasound-guided gastroenterostomy: A porcine study
- Predictors of irreversible intestinal resection in patients with acute mesenteric venous thrombosis
- Multiphase convolutional dense network for the classification of focal liver lesions on dynamic contrastenhanced computed tomography
- Chronic atrophic gastritis detection with a convolutional neural network considering stomach regions