Effects of carbon sources and temperature on the formation and structural characteristics of food-related Staphylococcus epidermidis biofilms
2020-05-26MingmingZouDonghongLiu
Mingming Zou, Donghong Liu,b,c,∗
aCollege of Biosystems Engineering and Food Science, National-Local Joint Engineering Laboratory of Intelligent Food Technology and Equipment, Zhejiang Key Laboratory for Agro-Food Processing, Zhejiang Engineering Laboratory of Food Technology and Equipment, Zhejiang University, Hangzhou 310058,China
bFuli Institute of Food Science, Zhejiang University, Hangzhou 310058, China
cNingbo Research Institute, Zhejiang University, Ningbo 315100, China
ABSTRACT
Biofilms are a constant concern in the food industry; understanding the effect of environmental conditions on biofilm formation is essential to develop effective control strategies. Therefore, this study was conducted to investigate biofilms formation by Staphylococcus epidermidis under various conditions.biofilms were cultured in nutrient broth containing different carbon source concentrations (0–10 mg/mL)on polystyrene surfaces for 32 h of incubation at 37 °C or 55 °C, with quantification and enumeration at 8,16, 24 and 32 h. S. epidermidis developed biofilms under all tested conditions; achieved the highest yield of biofilm biomass at 2.5 mg/mL for all carbon sources at 37°C. The highest efficiency of extracellular polymeric substance (EPS) molecule production occurred under glucose availability in the growth environment, with a higher yield of biomass and a significantly smaller number of metabolically active cells than under other tested conditions. A condensed ball-shaped structure was observed under the lactose condition. Meanwhile, biofilms in the presence of maltose showed mainly opaque thick rich colonies,while a compact multilayered-shaped structure was exhibited under both glucose and sucrose conditions. These results contribute to a better understanding of the biofilm formation by S. epidermidis in order to reduce contamination and recontamination in the food industry.
Keywords:
Staphylococcus epidermidis
Carbon sources
Temperature
Bacterial biofilm
Community structure
1. Introduction
Bacterial biofilms are the basic form of bacteria in the environment, as well as in human and animals. Organisms in biofilms are highly resistant to antimicrobials and sanitizers, causing serious public health problems; increasing attention has been paid to biofilm formation in medical, environmental and food microbiology [1]. The Gram-positive bacterium Staphylococcus epidermidis is not only an environmental microorganism but also a pathogen causing medical-device-related infections, even subsequent septicemia that primarily affects immunocompromised patients [2].Generally, S. epidermidis is an inhabitant of the skin and mucous membranes of humans and animals [3] and is also commonly isolated from environmental sources such as soil or natural water [4]and from a wide range of foodstuff such as meat products [5] or dairy products [6].
The presence of biofilms irreversibly attached to the surfaces of food processing equipment may reduce heat transfer efficacy,increase the production of secondary metabolites, quicken metal corrosion in pipelines and tanks, enhance resistance to antimicrobials, and cause post-processing contamination, resulted in less shelf-life of products and possible transmission of diseases [7]. The biofilm formed by S. epidermidis in the dairy industry is considered as a serious food safety concern because it possesses resistance to heat and CIP processes, acting as a potential source of contamination and recontamination of dairy products [8].
Bacterial biofilm formation is a complex and dynamic process involving attachment, maturation, and dispersal [7]. Several reports have demonstrated that adhesion was Influenced by the physico-chemical characteristics of the cell envelope, substratum surfaces and incubation media [9]. In the food industry, biofilm formation can be affected by several environmental factors such as food contact surfaces, nutrient availability, temperature, and maturation time [1]. For example, bacteria isolated from interior surfaces of the facilities in a milk powder processing factory showed higher biofilm-forming abilities on stainless steel compared to polystyrene surfaces under the same culture condition[8]. Meanwhile, these isolated strains were capable of growing and forming biofilm at both mesophilic and thermophilic temperatures (30–55°C) in nutrient broth and tryptic soy broth [8].Pilchová et al. [10] studied the effect of the nutrient condition(modified Welshimer’s broth, MWB; trypticase soy broth supplemented with yeast extract, TSBYE) on biofilm formation by Listeria monocytogenes. significant differences were observed with a lower biofilm formation in the higher nutrient condition. Accordingly,food-processing-related conditions have been considered essential for the prevention of biofilm formation in the food industry.However, the patterns of biofilm formation depending on a dairyindustry-related condition are presently insufficiently studied.
The objective of this study was to assess the Influence of dairyrelated environmental conditions, including temperature (e.g.,37°C or 55°C) and carbon sources (e.g. glucose, maltose, sucrose, or lactose) on the ability and the process of the biofilm formation by S.epidermidis isolated from a dairy factory. The incubation temperatures were selected for biofilm formation according to the ambient temperature in the dairy industry [8].
2. Methods
2.1. The biofilm-forming bacterial strain
The subject of investigation in this study was an opportunistic pathogen S. epidermidis, representing a medical risk if it entered the host tissue through skin traumas barrier or implantation of medical devices. The strain was isolated from a milk powder manufacturing plant and processed a high ability to form biofilm on stainless steel AISI 304 coupons [8]. Bacteria were preserved in fresh sterile nutrient broth (NB, 10 g/L peptone, 3 g/L beef extract, 5 g/L NaCl, pH 7.2 ± 0.2, hopebio, Shandong, China) with 25% glycerol at −80°C.Working cultures were maintained on nutrient agar (NA, hopebio,Shandong, China) slants at 4°C for 30 days.
2.2. Bacterial biofilm formation assay cultured under various nutrient conditions in a conventional manner
2.2.1. Various growth conditions
Prior to each experiment, a loopful of S. epidermidis was grown in 100 mL of NB and incubated at 37°C for 20 h to achieve the stationary phase. Organisms were harvested by centrifugation at 2350× g, 4°C for 10 min (HC-3018R centrifuge; USTC Zonkia Scientific Instruments Co., Ltd, Anhui, China), and then washed twice by the sterile phosphate-buffered saline (PBS, pH 7.4) solution.
2.2.2. biofilm formation in a static microtiter plate assay
To compare biofilm formation by S. epidermidis under various nutrient conditions, various NB supplemented with different carbon sources, including glucose, maltose, lactose, and sucrose, were prepared. Next, organisms were re-suspended in these fresh broth media ( final concentration 106CFU/mL) and the seven final concentrations of each of these carbon sources were from 0 to 10.0 mg/mL(0, 0.5, 1.0, 2.5, 5.0, 7.5, 10.0 mg/mL).
The method to evaluate in vitro biofilm formation by S. epidermidis was adapted from Zou et al. [8]. Brie fly, 200 μL of each bacterial suspension obtained above was added to each well of a 96-well flat-bottomed plastic tissue culture plate (Costar®3599,Corning Life Science, USA) and statically incubated at 37°C for 24 h.
At the end of the incubation, the suspended organisms were removed, and the wells were rinsed thrice with 200 μL of sterile PBS. The remaining attached bacteria were fixed with 200 μL of 99% methanol per well, and after 15 min plates were emptied and left to dry. Then, each well was stained for 10 min with 200 μL of the 2% crystal violet solution (Beyotime, Jiangsu, China) at room temperature. Excess stain was rinsed off by placing the plate under running tap water and the microplates were dried at room temperature. The dye bound to the adherent cells was dissolved with 160 μL of 33%(V/V) glacial acetic acid per well. Then the optical density of each well was measured at 570 nm (OD570nm) in a microplate reader(1510, Thermo Fisher Scientific, USA).
2.2.3. Scanning electron microscopy (SEM) analysis
The biofilm formation assay was performed on 6-well flatbottomed plastic tissue culture plate (Costar®3516, Corning Life Science, USA). Uncoated coverslips were cut into coupons(0.5 cm × 0.5 cm) and sonicated (400 W, 40 kHz, YT0410, Yunyi,Shenzhen, China) in a 2.0% NaOH solution for 30 min at 60°C,rinsed with distilled water and sterilized in an autoclave at 121°C for 15 min.
First, organisms were re-suspended in fresh NB supplemented with the optimum concentration of glucose, maltose, lactose,or sucrose, respectively ( final concentration 106CFU/mL); The optimum concentration was depended on the bacterial biofilm assay in Section 2.2.2. Then, 6.0 mL of each bacterial suspension was added to each well with a coverslip and statically incubated at 37°C for 24 h.
At the end of the incubation, the coverslips were first washed with sterile PBS three times. Next, the washed coupons were fixed with 2.5% glutaraldehyde overnight and then dipped and washed in sterile PBS for 15 min thrice. The coupons were dehydrated by a graded ethanol series (30%, 50%, 70%, 80%, 90%, 95%, and 100%)at room temperature for 15 min, respectively. Then, the coupons were dried with critical point drier, coated with gold-palladium and stored under vacuum until the time of viewing. Finally, the coupons were examined in the Hitachi Model SU8010 SEM (JEOL,Japan).
2.3. Bacterial biofilm formation assay at the optimum carbon source concentration under different temperature regimes
2.3.1. biofilm formation assay
The method to evaluate in vitro biofilm formation by S. epidermidis at the optimum concentration of each of carbon sources at different temperatures was described in Section 2.2.2. Brie fly,biofilms were grown on 96-well polystyrene microtiter plates.Each well was filled with 200 μL of organisms re-suspended with the optimum concentration of each of the carbon sources which was obtained in Section 2.2.2 ( final concentration 106CFU/mL), respectively. Microtiter plates were statically incubated at 37°C or 55°C for up to 32 h to form biofilms. After every 8-h incubation, the biofilm was quantified as described in Section 2.2.2.
2.3.2. Bacterial enumeration
The enumeration of bacteria in biofilms was conducted as described previously [11] with some modifications. Brie fly, biofilms were grown on 96-well polystyrene microtiter plates, as described in Section 2.3.1. After every 8-h incubation, the planktonic cells of each well were removed carefully, and biofilms were washed twice with 200 μL of sterile PBS. Next, each well was thoroughly scraped by sterile cotton swabs. Then, each swab was placed in a 15-mL tube filled with 10 mL PBS. Next, tubes were vortexed for 2 min to detach the organisms from swabs. Finally, the viable cells were determined by the 10-fold serial microdilution method. Appropriate dilutions were pour-plated and well mixed with 15 mL of molten NA. Plates were then incubated for 24 h at 37°C.
2.3.3. biofilm metabolic activity assay
The metabolic activities of bacteria in biofilms were assessed using the WST-8 reduction assay (Beyotime, Jiangsu, China) as described previously [12] with some modifications. WST-8 is a tetrazolium salt that can be reduced to an orange and water-soluble formazan derivative by metabolically active cells. Brie fly, biofilms were grown on 96-well polystyrene microtiter plates and washed twice with 200 μL of sterile PBS as described in Section 2.3.2. Next,200 μL of sterile PBS and 20 μL of the WST-8 solution were added to each well. Then, these plates were incubated for 1 h, and the absorbance was measured spectrophotometrically at the wavelength of 450 nm by using a microplate reader (1510, Thermo Fisher Scientific, USA).
2.3.4. Light microscope analysis
Visualization of the biofilms formed by S. epidermidis in the tested conditions was carried out under an inverted microscope(IX 51, Olympus Corp., Japan) connected to a video camera. Brie fly,biofilms were grown on 96-well polystyrene microtiter plates and washed twice with 200 μL of sterile PBS as described in Section 2.3.2. Next, cells were fixed with 4% paraformaldehyde solution(Sangon biotech Co., Ltd., Shanghai, China) for 10 min. Finally,images of the biofilms were taken by the microscope.
2.4. Statistical analysis
All experiments were done in triplicate for three independent cultures and the means ± standard deviations were calculated. The data were analyzed using a one-way analysis of variance with Duncan’s multiple range test at P < 0.05 using SPSS Statistics 20 software(IBM, USA).
3. Results
3.1. Effects of carbon sources on biofilm formation ability
S. epidermidis is one of the most important potential pathogens carried by foodstuffs and food-contact surfaces. Indeed, this bacterium has aroused a major health concern in the dairy industry for its ability to survive pressures during processing [8]. In this work, NB complemented with sugars (glucose, maltose, lactose, and sucrose) were used to quantitively estimate the effects of the crucial food-related environmental factors on biofilm formation by S.epidermidis isolated from a milk powder-manufacturing plant.
S. epidermidis biofilms were incubated statically for 24 h at 37°C.After staining, the presence of additional carbon sources in the medium significantly enhanced the biofilm production compared to non-supplemented NB based on the OD570nmmeasurements of bound crystal violet (CV) (Fig. 1). Indeed, biofilm biomasses revealed different increments depending on the concentration of the supplements, ranging from 0.63 ± 0.13 to 1.78 ± 0.19 for glucose(Fig. 1A), from 0.92 ± 0.18 to 2.24 ± 0.25 for maltose (Fig. 1B), from 0.63 ± 0.11 to 2.01 ± 0.21 for lactose (Fig. 1C), and from 0.54 ± 0.08 to 2.23 ± 0.24 for sucrose (Fig. 1D). On the one hand, biofilm biomasses in NB supplemented with carbon sources increased as the concentration increased from 0 to 2.5 mg/mL. On the other hand, biofilm biomasses changed negligibly in NB supplemented with glucose or lactose as the concentration further increased to 10.0 mg/mL, whereas them in NB supplemented with maltose or sucrose decreased negligibly as the concentration increased to 7.5 mg/mL and reduced significantly as the concentration further increased to 10.0 mg/mL. In general, the optimum concentration of each carbon source was determined as 2.5 mg/mL added to NB for the biofilm formation enhancement.
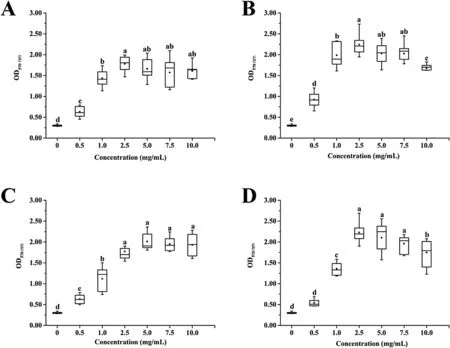
Fig. 1. The effect of different carbon sources on Staphylococcus epidermidis biofilm formation. A: Glucose. B: Maltose. C: Lactose. D: Sucrose. Organisms were grown at 37°C on 96-well polystyrene microtiter plates for 24 h, and biofilm formation was quantified by the CV assay. Groups with different letters are significantly different, P < 0.05.
3.2. Effects of carbon sources on 3-D biofilm structure by SEM
biofilms formed by S. epidermidis as shown by SEM after 24 h at 37°C revealed different morphological characteristics depending on the kinds of the additional carbon source with a concentration of 2.5 mg/mL (Fig. 2).
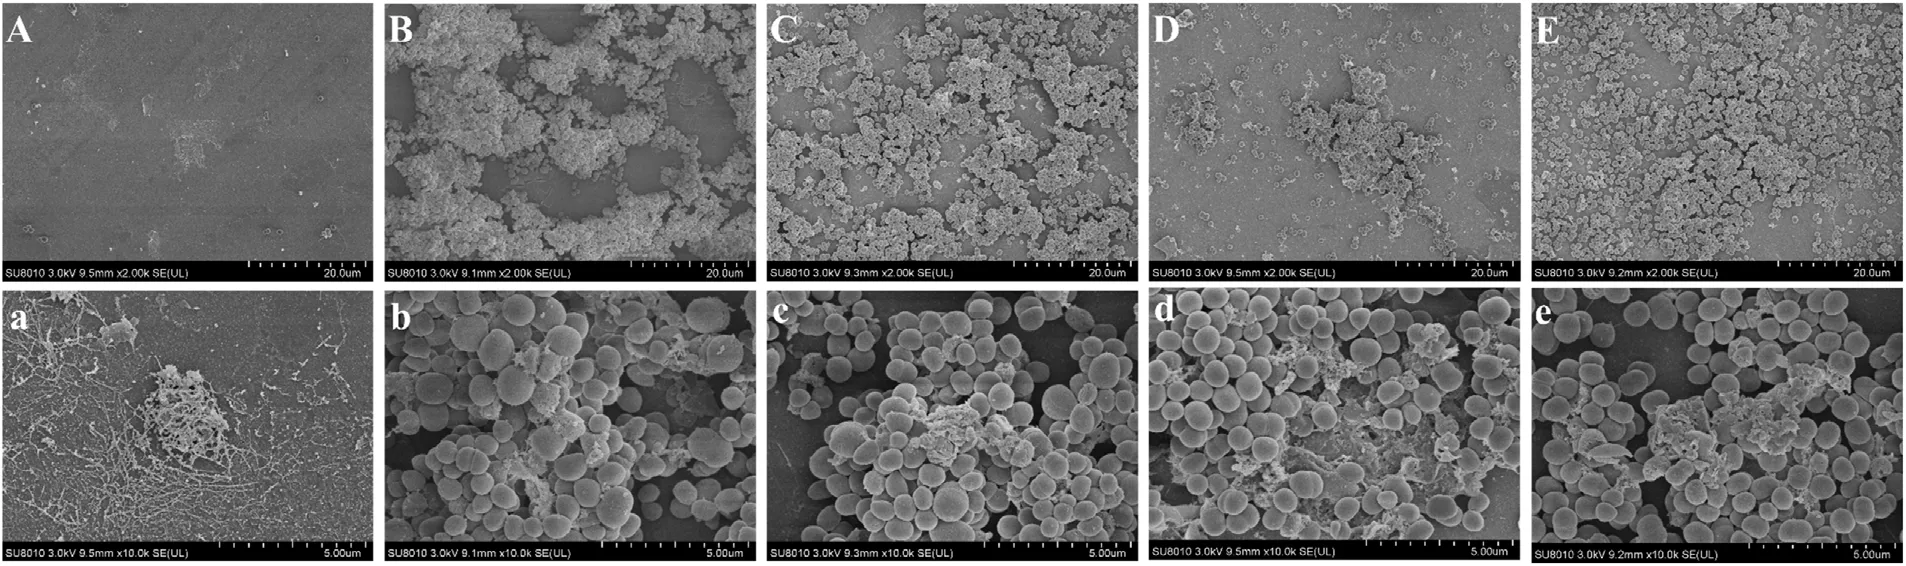
Fig. 2. SEM images of biofilm formed by S. epidermidis in nutrient broth (NB) supplemented with different carbon sources (2.5 mg/mL) at 37°C on coverslips for 24 h. A-a:NB. B-b: Glucose. C-c: Maltose. D-d: Lactose. E-e: Sucrose.
S. epidermidis biofilm, the moderate biofilm producer [8], consisted of aggregates of S. epidermidis that increased in thickness with the increase of the additional carbon source. After incubation with NB, the biofilm consisted mostly of single cells and clustering is not common (Fig. 2Aa). biofilms developed in NB complemented with sugars showed increments of microorganisms and EPS and more cell aggregations were observed (Fig. 2Bb, Cc, Dd, and Ee). Additionally, each of these biofilm communities was unique although some structural attributes can generally be considered universal. The biofilm community developed in NB complemented with glucose formed a compact and three-dimensional structure(Fig. 2Bb), whereas S. epidermidis cells cultivated in NB complemented with other three sugars (maltose, lactose and sucrose)formed loose and multilayered biofilms (Fig. 2Cc, Dd, and Ee). It is suggested glucose had a different effect on S. epidermidis biofilm architecture compared to the other three sugars.
3.3. biofilm formation at the optimum carbon source concentration
Characteristics of biofilm formation by S. epidermidis on polystyrene surfaces were investigated at the optimum carbon source concentration (2.5 mg/mL) under different temperatures up to 32 h. Figs. 3, 4 and 5 show biofilm maturation curves, cell populations and metabolic activity of biofilms formed by S. epidermidis at 37°C (A) and 55°C (B), respectively.

Fig. 3. Maturation curves of biofilm formed by S. epidermidis under different growth conditions. Organisms were grown in NB with or without different carbon sources(2.5 mg/mL) on 96-well polystyrene microtiter plates at 37°C (A) or 55 °C (B). Experiments were replicated three times. biofilm formation was quantified by the CV assay.
For S. epidermidis biofilm, there is a significant difference between 37°C and 55°C accordingly (Fig. 3). In general, biofilm biomass experienced a sharp increase since 8 h inoculation at 37°C comparing to the stable level at 55°C. As shown in Fig. 3A, the OD570nmmeasurements of bound CV displayed significantly higher biofilm production in the presence of additional carbon sources compared to non-supplemented NB at 37°C. What’s more, glucose and maltose conditions showed superior Influences on the biofilm formation by S. epidermidis than lactose and sucrose conditions. In the presence of glucose and maltose, three stages were observed accordingly. The biofilm biomass increased with a fast rate in a period of 16 h while increased slowly during 16–24 h and decreased by 32 h. However, the biofilm biomass reached its peak at 24 h, with a sharp decrease until 32 h in the presence of the lactose and sucrose conditions.
From the data in Fig. 4, it is apparent that live cell population levels of S. epidermidis biofilms varied depending on the content of the media as well as the incubation temperature. The number of live cells showed a highly similar trend and peak at 37°C except for the control and glucose samples (Fig. 4A). It increased with a fast rate after incubated to 8 h, followed by a slow rate until 32 h in the presence of maltose, lactose, and sucrose. However, a stable trend occurred to the other two samples until 24 h. When S. epidermidis generated biofilms at 55°C (Fig. 4B), its population levels were significantly higher in the presence of maltose than those of other media until 24 h.
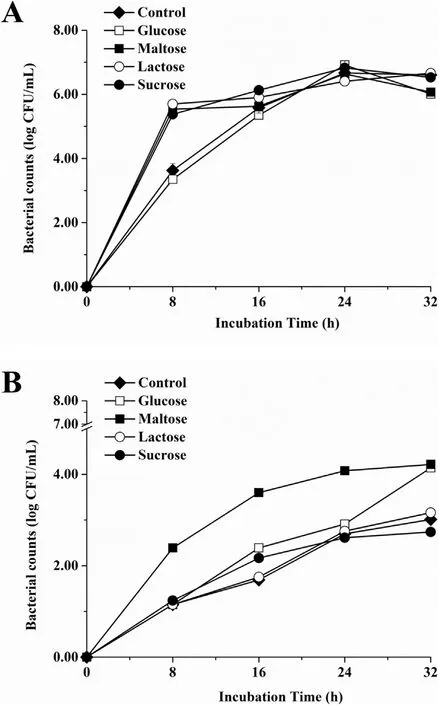
Fig. 4. Bacteria counts of S. epidermidis adhered on polystyrene surfaces in NB with or without different carbon sources (2.5 mg/mL) at 37°C (A) or 55°C (B). Experiments were replicated three times.
It can be seen from the data in Fig. 5 that a significant gap in the biofilm metabolic activity between the incubation temperature was observed. Interestingly, a highly similar trend of the metabolic activity in all conditions at 55°C (Fig. 5B) was observed while it differed depending on the content of the media at 37°C (Fig. 5A).A stable trend occurred in the control and glucose samples at 37°C until 32 h. Besides, the biofilm metabolic activity reached its peak at 8 h, with sharp decrease until 24 h in the presence of sucrose, while it reached its peak at 16 h in the presence of maltose and lactose.
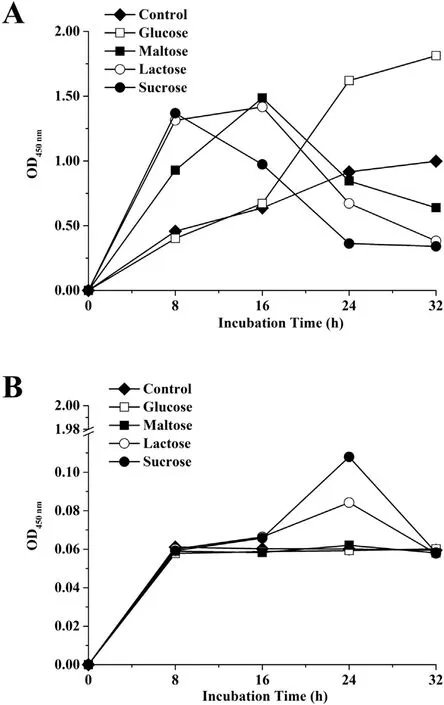
Fig. 5. Metabolic activity in biofilms of S. epidermidis as measured by WST-8 reduction assay in NB with or without different carbon sources (2.5 mg/mL) at 37°C (A)or 55°C (B). Experiments were replicated three times.
3.4. Colony observation at the optimum carbon source concentration
Fig. 6 shows light microscopic photographs of biofilms formed by S. epidermidis grown on 96-well polystyrene microplates under different conditions. There were considerable differences in biofilm biomass and adhesion cell population levels among the different media between 37°C and 55°C. In general, S. epidermidis poorly formed biofilms under all media conditions at 55°C (Fig. 6B). Light microscopic visualization revealed small cell aggregates after 8 h in the presence of lactose, while adhesion of individual cells was observed under the other media conditions for the same period.
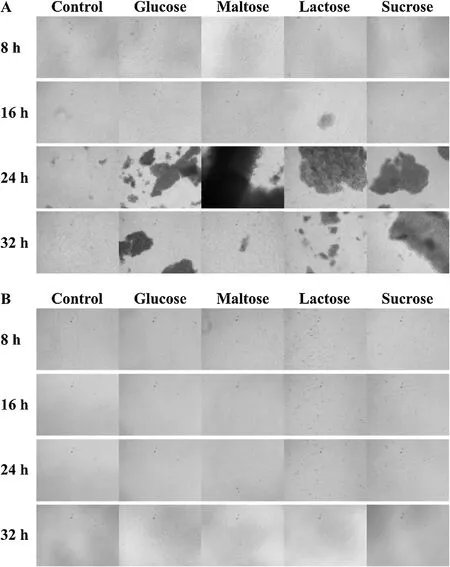
Fig. 6. Light microscopic photographs of biofilm formed by S. epidermidis grown in nutrient broth (NB) supplemented with different carbon sources (2.5 mg/mL) at 37°C (A)or 55°C (B).
On the other hand, the biofilm formed by S. epidermidis at 37°C revealed different morphologies depending on the kinds of additive supplemented into the medium. In the presence of additional carbon sources, the biofilm structure appeared uniformly organized,showing stacked cellular layers after 16 h (Fig. 6A). From 16 h to 24 h, biofilms showed structures that differed widely from those grown in varied media. A pile of organized cells in a condensed ball-shaped structure was observed under the lactose condition,while biofilms in the presence of maltose showed mainly opaque thick rich colonies. On the other hand, the biofilm showed a compact multilayered-shaped structure under both glucose and sucrose conditions.
4. Discussion
It is complicated to anatomize the molecular, mechanical, and topographical factors that contribute to biofilms formation, as these factors may vary with extracellular conditions, including temperature, carbon sources, and the composition of nutrient media and growth factors [13]. In the food industry, food waste, such as dairy products (proteins, fats, and carbohydrates), serves as a substrate for microorganisms, assisting biofilm formation, even in inhospitable conditions [14]. For this, the Influence of carbon sources on biofilm formation of S. epidermidis was studied using five different growth media at 37°C (Fig. 1). All S. epidermidis biofilms developed in NB supplemented with different carbon sources had a higher biomass density in comparison with the biofilms developed in non-supplemented NB (P < 0.05), and this may be related with the ability of bacteria in non-optimal growth conditions (such as excess of carbon sources in the environment) to form exopolysaccharide matrices as a by-product that could otherwise obstruct metabolism [15]. Interestingly, S. epidermidis tested for biofilms formation on polystyrene surfaces following 24 h of incubation at 37°C in NB supplemented with different carbon sources concentrations(0.5–10 mg/mL), formed the highest biomass yield at 2.5 mg/mL for all carbon sources. Xu et al. [16] found that the desorption phase was a decrement in the cell density during biofilm colonization compared with the initial attachment. Specifically, all selected strains showed this phase with a low concentration of NaCl in TSB(0% and 2%), but not in biofilms developed with high levels (8% and 10%). This result con firmed that the desorption phase was dependent on environmental conditions. In the current research, there was a significant difference between the cell density in biofilms obtained at 8 and 24 h at 37°C in all groups.
Additionally, like many other microbial species, the temperature is one of the most crucial environmental factors affecting biofilm formation by S. epidermidis [17]. In the current study, the kinetics of biofilms formation under conditions that mimic the food industry, including temperature and carbon sources, were tested on polystyrene surfaces. After 8 h incubation at 37°C, high bacterial counts were obtained in all tested media (Fig. 4A), which could be related to the previous step in the biofilm formation[18]. Meanwhile, WST-8 assay results revealed that a significantly(P < 0.05) smaller number of metabolically active S. epidermidis cells was present in biofilms grown in NB supplemented with glucose than in NB supplemented with the other carbon sources.However, the level of biomass produced by S. epidermidis represented the opposite trend. Thus, the highest efficiency of EPS molecule production occurred under glucose availability in the growth environment. Gauri et al. [19] reported that the EPS production was affected by carbon sources, as glucose was identified as the most effective promoter. Besides, EPS production by Aureobasidium pullulans cells increased under conditions where growth was extended by the high carbohydrates content in the medium,such as glucose, fructose, mannose, maltose, xylose, ribose, arabinose, sucrose and lactose [20]. In the current study, maltose,lactose, and sucrose were all shown to be as good a carbon source as glucose, despite depending on the concentration and incubation time. However, the number of cells was significantly (P <0.05) lower at 55°C than at 37°C in the same medium, thus, the metabolic activities of S. epidermidis biofilms were temperature dependent.
5. Conclusion
S. epidermidis developed biofilms under all tested conditions,but the cell density was higher in biofilms developed with supplemented carbon sources. The time to reach each biofilm step varied in the current study, which was due to the Influence of environmental conditions, such as nutrients and temperature. Growth media complemented with different carbon sources at different temperatures were important for attachment and biofilm architecture.Maltose, lactose, and sucrose were all shown to be as good a carbon source as glucose for EPS production and biofilm formation, despite depending on the concentration and incubation time.
Based on these results, biofilm formation by S. epidermidis could be adjusted depending on the environmental conditions. To better understand biofilm formation by S. epidermidis, further research will standardize biofilm biomass and metabolically active cells in biofilms, with the aim of reducing the bacterial attachment in the food industry.
Declaration of Competing Interest
The authors declare that they have no conflict of interest.
Acknowledgments
This work was financially supported by the National Key Research and Development Program of China (2016YFD0400301)and the Key Research and Development Program of Zhejiang Province (2017C02015).
杂志排行

食品科学与人类健康(英文)的其它文章
- Antioxidant and α-glucosidase inhibitiory activity of Cercis chinensis flowers
- Gelatin-stabilized traditional emulsions: Emulsion forms, droplets,and storage stability
- Changes of protein oxidation, lipid oxidation and lipolysis in Chinese dry sausage with different sodium chloride curing salt content
- Major royal jelly proteins accelerate onset of puberty and promote ovarian follicular development in immature female mice
- Chrysoeriol ameliorates hyperglycemia by regulating the carbohydrate metabolic enzymes in streptozotocin-induced diabetic rats
- Isolation and identification of Starmerella davenportii strain Do18 and its application in black tea beverage fermentation