南海西部夏季上升流锋面的次中尺度特征分析*
2020-05-25黄小龙经志友郑瑞玺张旭
黄小龙, 经志友, 郑瑞玺,2, 张旭,2
海洋水文学
南海西部夏季上升流锋面的次中尺度特征分析*
黄小龙1, 2, 经志友1, 郑瑞玺1,2, 张旭1,2
1. 热带海洋环境国家重点实验室(中国科学院南海海洋研究所), 广东 广州 510301; 2. 中国科学院大学, 北京 100049
利用卫星遥感资料和区域海洋数值模式ROMS(regional ocean modeling system)高分辨率数值模拟结果, 对南海西部夏季上升流锋面的次中尺度特征及其非地转过程进行了探讨。高分辨率卫星遥感观测和数值模拟结果显示, 南海西部夏季锋面海域存在活跃的次中尺度现象, 其水平尺度约为1~10km, 且具有(1)罗斯贝数(Rossby number, Ro)的典型次中尺度动力学特征。进一步的诊断分析表明, 在夏季西南风的驱动下, 沿锋面射流方向的风应力(down-front wind stress)引起的跨锋面埃克曼输运有利于将海水由锋面冷水侧向暖水侧输运, 减小了锋面海域的垂向层结和Ertel位涡, 加剧了锋面的不稳定, 并形成跨锋面的垂向次级环流。高分辨率模拟结果显示, 锋面海域最大垂向流速可达100m∙d–1, 显著增强了上层海洋的垂向物质交换。因此, 活跃在锋面海域的次中尺度过程可能是增强南海西部上升流海域垂向物质交换的重要贡献者。
上升流锋面; 次中尺度过程; 区域海洋数值模式; 卫星遥感; 南海西部
海洋环流包含了从几千公里的大尺度环流, 到几百公里的中尺度过程和几公里的次中尺度过程, 直到百米以下的小尺度湍流混合过程。其中关于大尺度环流、中尺度过程和小尺度湍流混合过程的研究已取得了丰硕的成果(Munk et al, 1998; Mauritzen et al, 2002; Tian et al, 2009; Chelton et al, 2011; Alford et al, 2015; Wunsch et al, 2018)。但受限于资料分辨率等因素, 目前对介于中尺度和小尺度之间, 水平尺度为(1~10km), 时间尺度为几小时到数天的次中尺度过程尚缺乏足够的理解。近年来随着观测技术的革新、高分辨率模式的发展以及相关理论认知的提高, 对普遍存在于上层海洋的次中尺度过程研究也逐渐深入。
在中尺度背景环流、非对称的大气强迫(海表风场和降温)以及地形诱导等因素的影响下, 次中尺度过程在强流、中尺度涡旋边缘以及锋面海域尤其活跃(Thomas et al, 2008)。次中尺度过程具有典型的(1)罗斯贝数(Rossby number, Ro)和理查森数(Richardson number, Ri), 表现为完全的三维运动特征(McWilliams, 2016)。一方面, 现场观测和高分辨率数值研究表明, 次中尺度过程及其不稳定能够诱发强烈的垂向非地转次级环流, 有利于增强上层海洋热通量、浮力、营养盐和动量的垂向输运, 是影响区域海洋生态环境变化的重要动力过程之一(Mahadevan et al, 2012; Omand et al, 2015; McKinley et al, 2016; Zhang et al, 2019)。另一方面, 理论分析和观测研究显示, 次中尺度过程也是平衡态地转能量向小尺度过程正向串级的重要媒介过程之一(Capet et al, 2008a)。次中尺度不稳定(例如对称不稳定和混合层斜压不稳定)能够有效地汲取地转动能并释放锋面有效位能, 并在次级不稳定的作用下将能量进一步串级至小尺度湍流混合过程(Boccaletti et al, 2007; D'Asaro et al, 2011; Barkan et al, 2015)。因此, 次中尺度过程是中、小尺度相互作用的关键动力过程。
南海地处东亚季风区(Fang et al, 2002), 在大气强迫、复杂海底地形等因素的影响下, 具有多尺度的动力过程(Wang et al, 2003; Chen et al, 2011; Zhang et al, 2016), 是研究次中尺度过程和中、小尺度相互作用的理想海域(Jing et al, 2016; Zhong et al, 2017; 冀承振等, 2017)。其中南海西部是南海中尺度过程活跃的主要区域之一(Zhuang et al, 2010), 且已被现场观测所证实。卫星遥感观测显示(图1), 南海西部海面高度变化(图1中黑色框)显著高于中部海盆区, 和南海东北部海域同为南海两个典型的中尺度涡旋活跃海区(Hu et al, 2011; Zhang et al, 2016)。在夏季西南风的驱动下, 南海西部出现显著的东向离岸上升流(Chen et al, 2014a; Li et al, 2014)。同时, 沿岸径流输入(Chen et al, 2012)、风应力旋度(Xie et al, 2003, 2007)以及涡度水平输运(Wang et al, 2006; Gan et al, 2008)等均对该上升流的生成与不同时间尺度的演变有着重要影响。上升流将下层低温、高营养盐的海水带至表层, 并在平流作用下向东输运, 在南海西部形成显著的温度锋面和叶绿素浓度高值区(Kuo et al, 2000; Chen et al, 2014b)。高分辨率水色遥感观测结果显示, 南海西部夏季锋面海域广泛存在着细丝状和涡旋状的次中尺度结构(Liu et al, 2015; Yu et al, 2018), 但关于该海域次中尺度过程的动力学特征及其对上层海洋的影响尚缺乏足够的理解。本文尝试利用高分辨率数值模拟并结合卫星观测资料分析, 探讨南海西部夏季上升流锋面的次中尺度特征及其非地转过程, 以期为南海西部锋面海域的高叶绿素浓度和中尺度过程变异提供动力学解释, 进一步加深对南海西部多尺度相互作用和生态效应的认识。

图1 南海海表面高度均方根的空间分布
黑色矩形框表示本文研究区域; 地图来自Matlab软件自带底图, 下同
Fig. 1 Spatial distribution of SSH root mean square (rms) in the South China Sea (SCS).The research domain is delineated by the black box
1 数据来源与分析方法
1.1 卫星遥感资料
本文使用的卫星遥感资料包括高分辨率海表温度数据(sea surface temperature, SST)、海表面高度(sea surface height, SSH)、海表高度异常(sea level anomaly, SLA)、风场数据和叶绿素浓度数据。海表温度数据(2006—2017年)采用英国气象局制作并由美国国家海洋数据中心发布的高分辨率融合产品(http://data.nodc.noaa.gov/ghrsst/L4/GLOB/UKMO/OSTIA/), 空间分辨率为0.05°×0.05°, 时间分辨率为1d, 反演精度约为0.57℃(Dong et al, 2014)。日平均的高度计数据(SSH和SLA,1993—2016年)来源于法国国家空间研究中心提供的AVISO(Archiving Validation and Interpolation of Satellite Oceanographic)网格化产品(ftp://ftp.aviso.oceanobs. com/global/), 空间分辨率为0.25°×0.25°, 反演精度约为0.02m。日平均海表风场数据(1999—2009年)来自QuikSCAT(Quick Scatterometer)卫星散射计, 空间分辨率为0.25°×0.25°, 资料精度为1m∙s–1。海表叶绿素浓度数据(2002—2012年)来自中等分辨率成像光谱仪(MEdium Resolution Imaging Spectrometer, MERIS)提供的2级产品数据(ftp:// merisfrs-fts-ds.eo.esa.int), 水平分辨率约为300m, 绝对精确度达到10–3mg·m–3。
1.2 模式配置
本文利用ROMS(regional oceanic modeling system)数值模式对南海及其西部海域进行高分辨率的嵌套模拟。其中最外层模拟区域覆盖西太平洋(ROMS0, 7.5km分辨率), 第一层嵌套覆盖南海区域(ROMS1, 1.5km分辨率, 如图2所示), 第二层嵌套聚焦南海西部海域(ROMS2, 500m分辨率); 模式垂向分层均为60层, 并在上边界和底边界适当加密。初始边界条件以及风场强迫分别采用SODA(simple ocean data assimilation data)海洋数据集的气候态月平均数据(1990—2010年, Carton et al, 2008)和气候态日平均QuikSCAT(Quick Scatterometer)风场数据(Risien et al, 2008)。其中, 采用的SODA数据集包含温度、盐度、水平和垂直速度以及SSH等变量, 该再分析同化资料的空间分辨率为0.5°×0.5°, 对应的数据精度约为: 温度0.41℃、盐度0.5‰、速度不确定性小于30%和SSH 0.03m(Carton et al, 2000)。热通量和淡水通量等气候态月平均海—气通量来源于国际海洋大气综合数据集(International Comprehensive Ocean-Atmosphere Data Set, ICOADS) (Woodruff et al, 2011), 空间分辨率为1°×1°。地形数据采用美国国家海洋和大气管理局(National Oceanic and Atmospheric Administration, NOAA)提供的ETOPO2数据。小尺度湍流混合采用KPP参数化方案(K-profile parameterization)进行参数化(Large et al, 1994)。ROMS0诊断计算20年后, 在线嵌套的ROMS1和ROMS2计算第21年并输出日平均模拟结果。本文选取500m分辨率的ROMS2模拟结果对南海西部上升流锋面海域的次中尺度动力特征进行分析。
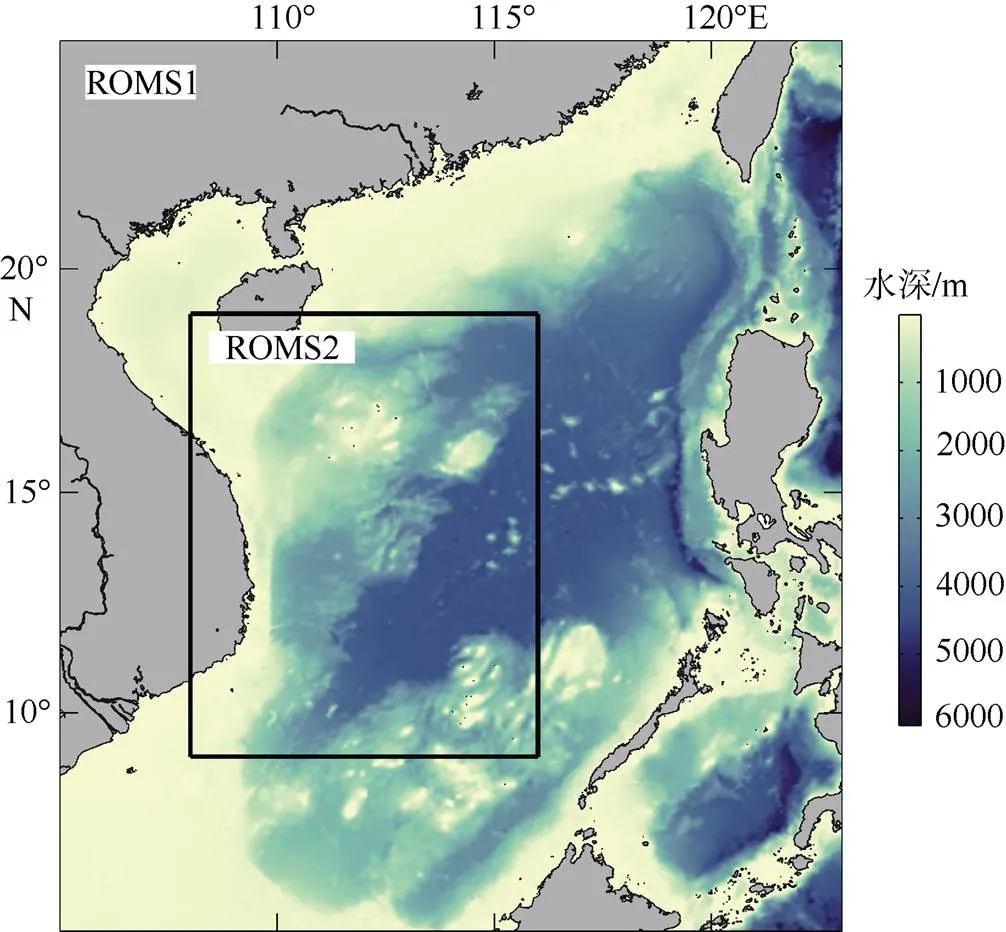
图2 南海嵌套模拟区域示意图
第一层嵌套(ROMS1)包括南海海域, 第二层嵌套(ROMS2)为南海西部海域(黑色矩形框)
Fig. 2 The diagram for the nested ROMS model domain. The western SCS is the nested domain for the ROMS2 simulation (black box) while the nested domain of ROMS1 covers the SCS
1.3 相关参数诊断计算
位涡(potential vorticity, PV)作为一种重要的动力学示踪物, 反映海洋环流和多尺度动力过程的稳定性(Hoskins, 1974; Thomas et al, 2013)。由于北半球恒为正值, 因此当Ertel位涡小于零时, 易诱发对称不稳定(Thomas et al, 2013)。在地转平衡的假设条件下, Ertel位涡定义如下(Hoskins, 1974):


为评估风应力引起的艾克曼输运对改变海表浮力的作用, 本文计算了埃克曼浮力通量(Ekman buoyancy flux, EBF), 表达式如下:


2 结果分析
2.1 锋面的次中尺度动力学特征
高分辨率MERIS水色遥感资料显示, 南海西部上升流海域有着显著的叶绿素浓度高值区, 侧向宽度约20~40km的高叶绿素带状区域由近岸109°12'E向东延伸至112°30'E, 并且在空间分布形态上与卫星观测的温度锋面位置一致(图3)。同时, 从高分辨率叶绿素浓度图像可以清晰地看到锋面两侧涡旋状和涡丝状的次中尺度结构, 这些次中尺度现象的侧向尺度约为10km, 该特征尺度与吕宋海峡、南海西部等海域的现场观测结果一致(Zheng et al, 2008; Song et al, 2019)。


图3 南海西部2009年7月26日的海表叶绿素浓度、海表风速(箭头)和海表温度(等值线, 单位: ℃)平面分布
本文选取11°48'—12°06'N, 110°30'—110°54'E的典型锋面区域(图4a虚线矩形框)对次中尺度过程进行进一步分析, 其水平分布和跨锋面结构如图5所示。沿流轴方向露头等密线显示, 流轴附近存在宽约5km的狭长密度锋面。垂向上, 密度锋面主要存在于混合层内20m以浅, 且南侧等密线相对北侧更加密集。


图4 模式第21年8月4日南海西部数值模拟海表温度、表层流(箭头)、SLA(等值线, 单位: m)(a)和罗斯贝数Ro(b)分布
黑色实线表示流轴位置(相对涡度为0); a中虚线矩形框为本文选取的典型锋面区域
Fig. 4 Maps of SST (a) and Ro (b) from the ROMS2 simulation. The vectors are surface currents. The gray contours represent the SLA, and the black line is the jet axis
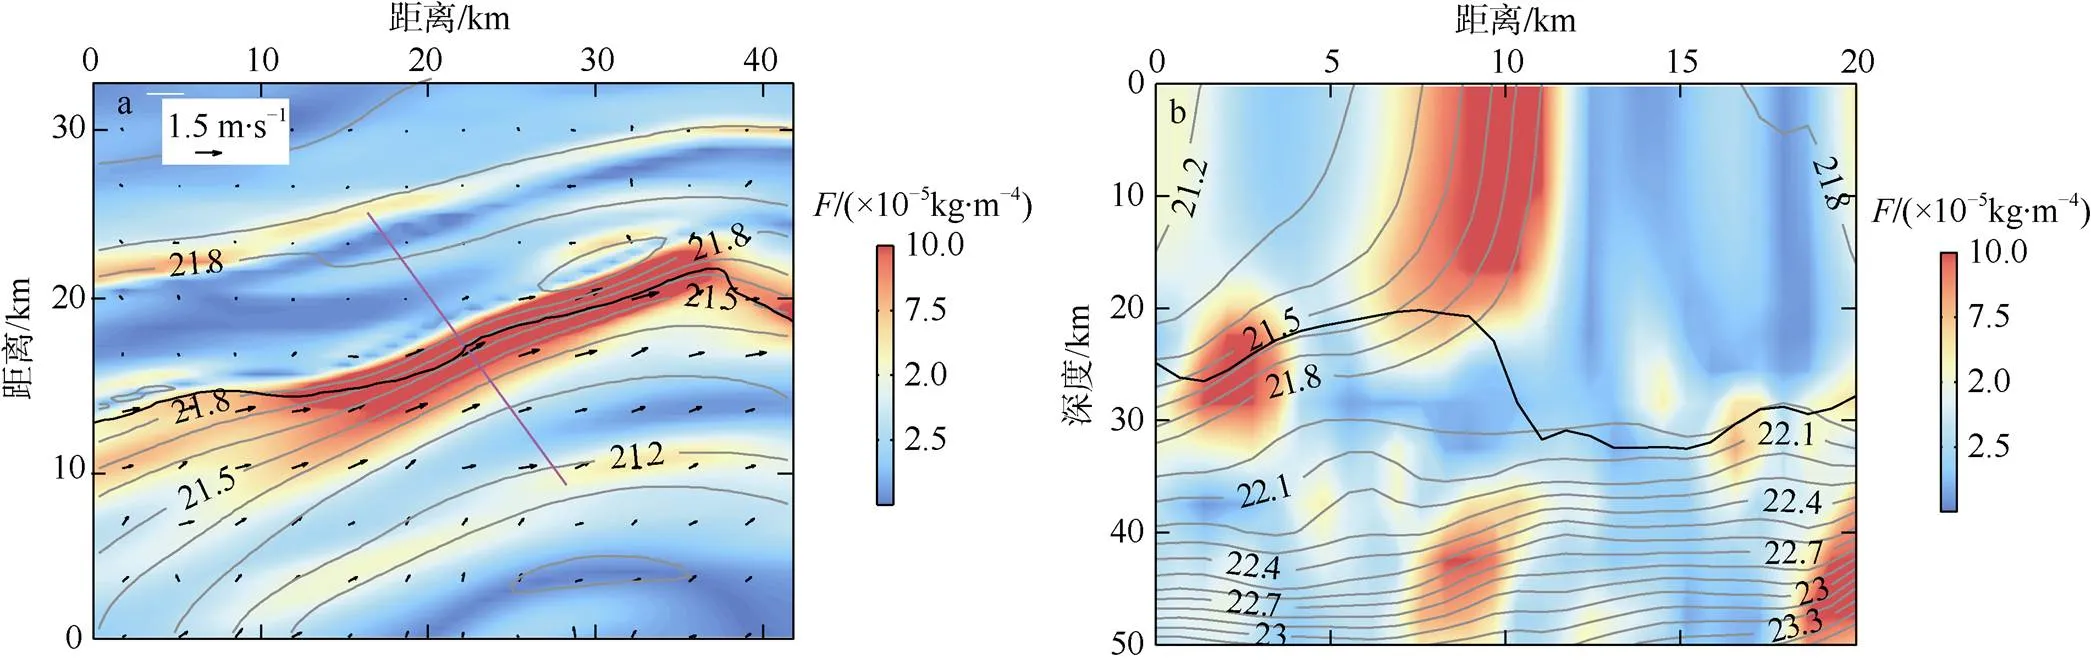
图5 典型锋面区域锋面强度F、地转流ug(箭头)和海水密度(灰色等值线, 单位: kg·m–3)的水平分布(a)和断面分布(b)
a中紫红色实线表示断面位置, 黑色实线表示流轴; b中黑色实线表示混合层深度
Fig. 5 Spatial distribution of the intensity of front: horizontal distribution (a) and vertical profile (b). The geostrophic flows (vector) and density (grey contour) are also shown. Black line is the jet axis in (a) and the mixed layer depth in (b). The location of the vertical profile is shown by the magenta line in (a)
2.2 垂向次级环流与位涡分布特征
为了进一步讨论上升流锋面区域垂向环流结构, 本文通过空间滤波的方法提取次中尺度的流速信号。图6给出了次中尺度垂向流速异常的水平和垂向分布。可以确定, 锋面附近存在明显的跨锋面的非地转次级环流, 其表层海水在锋面区域辐聚下沉, 而在其两侧存在上升流, 最大垂向流速出现在15m深度附近(图6b), 其中最大垂向流速可达100m∙d–1, 显著增强了上层海洋物质的垂向交换。该特征与利用南海西部、南海北部等海域的现场观测及高分辨率模拟诊断的结果一致(Xie et al, 2017; Zhong et al, 2017)。
理论研究结果表明:局地非地转次级环流与次中尺度不稳定密切相关(Mahadevan et al, 2006; Gula et al, 2014; McWilliams, 2017)。当Ertel位涡与反号时, 有利于促发多种类型的次中尺度不稳定, 其中对称不稳定是能量增长最快的一种模态(Hoskins et al, 1972)。与传统的中尺度过程不同, 锋面弱垂向层化、强水平浮力梯度以及垂向剪切等均使得位涡的水平斜压分量(EPVh)与其垂向分量(EPVv)量值相当, 有利于负Ertel位涡的发生并易于引发次中尺度不稳定。
图7显示了基于高分辨率数值模拟诊断计算得到的Ertel位涡、水平位涡分量和垂向位涡分量的空间分布。负Ertel位涡主要出现在上层海洋次中尺度锋面附近, 表明锋面区域发生次中尺度斜压不稳定。通过比较各位涡分量可以发现, Ertel位涡水平分量绝对值大于水平分量, 使得Ertel位涡小于零(图7a—c)。由Ertel位涡的跨锋面垂向结构分布可知, 受次级环流作用, 海表的负位涡水体沿等密度面自海表进入混合层内; 下层高位涡海水受锋面两侧上升流影响抬升至海表, 表明表层和下层海水在次级环流的作用下发生垂向交换且浮力发生再分配(图7d)。在此过程中, 增强的垂向次级环流能够有效地将下层较丰富的营养盐带进入海表, 为锋面海域的浮游生物生长提供营养盐供给。

图6 10m层垂向流速异常的水平和垂向分布
a. 垂向流速异常′(填色)、水平流速异常′(箭头)和海水密度(等值线, 单位: kg·m–3)的水平分布; b. 断面温度(填色)、跨锋面和垂向流速异常(箭头)、海水密度(等值线, 单位: kg·m–3)分布; a中紫红色实线表示断面位置; 黑色实线表示流轴; b中黑色实线表示混合层深度
Fig. 6 Map (a) and vertical (b) profile of vertical velocity anomaly at 10 m. (a) Black arrows refer to surface currents anomalies. Magenta line indicates the section for the vertical profile, and black line indicates the jet axis. (b) Shading denotes temperature, and black vector represents the cross-front and vertical velocity anomaly. Black line represents mixed layer depth. Grey contour is for density

图7 典型锋面海域Ertel位涡(填色)、表层流u(箭头)和海水密度(灰色等值线)分布
a—c分别表示Ertel位涡(EPV)、Ertel位涡水平分量(EPVh)和Ertel位涡垂向分量(EPVv)的水平分布, 黑色实线表示流轴; d为Ertel位涡断面分布, 断面位置如a中紫红色实线所示, 黑色实线表示混合层深度, 灰色等值线为密度(单位: kg·m–3)
Fig. 7 Snapshot of the Ertel PV. (a-c) are the EPV, EPVh and EPVv, respectively. The black line represents the jet axis. Black arrows denote surface currents. (d) is vertical distribution of EPV. The location of the vertical section is shown by the magenta line in (a). Black line represents mixed layer depth
海表外强迫是上层海洋位涡发生改变的主要源之一(Thomas, 2005; Thomas et al, 2005)。在夏季西南风强迫引起的浮力损失等非保守过程影响下, 南海西部锋面海域易出现负Ertel位涡。诊断计算结果显示, 在沿锋面射流风应力(down-front wind stress)的作用下, 最大埃克曼浮力通量出现在流轴附近, 大小约为1×10⁻⁵m2∙s–3, 表明沿锋面射流方向的风应力引起的埃克曼输运将冷水向暖水侧跨锋面输运(图8), 进一步改变锋面浮力分布并减弱垂向层结, 加强锋面的水平浮力梯度以及减小Ertel位涡水平斜压分量, 最终导致负Ertel位涡出现, 从而加剧锋面的不稳定。

图8 典型锋面海域的埃克曼浮力通量(填色)、地转流ug(黑色箭头)、风应力tstr(紫红色箭头)和海水密度(等值线,单位: kg·m–3)的水平分布
从空间分布形态来看, 埃克曼浮力通量空间分布与Ertel位涡结构也有着良好的对应关系。在一定程度上, 这些结果表明沿锋面射流风应力驱动的跨锋面埃克曼输运过程可能是导致夏季南海西部锋面海域发生次中尺度对称不稳定的重要原因。
3 结论
本文利用高分辨率卫星遥感资料并结合数值模拟结果, 分析了夏季南海西部上升流锋面的次中尺度特征及其非地转过程。高分辨率水色遥感观测显示, 南海西部上升流锋面海域存在丰富的次中尺度现象。高分辨率模拟结果发现, 上升流锋面有显著的非地转特征并伴随次中尺度过程发生。诊断计算结果显示, 跨锋面的非线性的埃克曼水平净输运将海水自锋面冷水侧向暖水侧输运, 增强了锋面水平浮力梯度并减弱其垂向层结, 导致锋面海域出现负Ertel位涡, 为次中尺度对称不稳定提供了有利条件。因此, 沿锋面射流风应力引起的浮力损失可能是导致南海西部上升流海域锋面发生次中尺度对称不稳定的重要机制之一。同时, 诊断结果显示, 次中尺度过程能够引起跨锋面的垂向次级环流, 最大垂向流速可达100m∙d–1, 显著增强了锋面海域的垂向物质交换。本文基于数值模拟初步探讨了南海西部锋面海域次中尺度过程, 关于其形成与演变的动力过程, 还需要结合现场观测资料进行深入研究。
范植松, 2002. 海洋内部混合研究基础[M]. 北京: 海洋出版社: 7–10. FAN ZHISONG, 2002. Research fundamentals of ocean interior mixing[M]. Beijing: China Ocean Press: 7–10 (in Chinese).
冀承振, 叶瑞杰, 董济海, 等, 2017. 南海中尺度涡边缘亚中尺度过程模式研究[J]. 中国海洋大学学报, 47(1): 1–6. JI CHENGZHEN, YE RUIJIE, DONG JIHAI, et al, 2017. The simulation of submesoscale process at the periphery of a mesoscale eddy in the South China Sea[J]. Periodical of Ocean University of China, 47(1): 1–6 (in Chinese with English abstract).
ALFORD M H, PEACOCK T, MACKINNON J A, et al, 2015. The formation and fate of internal waves in the South China Sea[J]. Nature, 521(7550): 65–69.
BARKAN R, WINTERS K B, SMITH S G L, 2015. Energy cascades and loss of balance in a reentrant channel forced by wind stress and buoyancy fluxes[J]. Journal of Physical Oceanography, 45(1): 272–293.
BOCCALETTI G, FERRARI R, FOX-KEMPER B, 2007. Mixed layer instabilities and restratification[J]. Journal of Physical Oceanography, 37(9): 2228–2250.
CAPET X, MCWILLIAMS J C, MOLEMAKER M J, et al, 2008a. Mesoscale to submesoscale transition in the California current system. Part I: flow structure, eddy flux, and observational tests[J]. Journal of Physical Oceanography, 38(1): 29–43.
CAPET X, MCWILLIAMS J C, MOLEMAKER M J, et al, 2008b. Mesoscale to submesoscale transition in the California current system. Part II: frontal processes[J]. Journal of Physical Oceanography, 38(1): 44–64.
CARTON J A, CHEPURIN G, CAO X H, 2000. A Simple Ocean Data Assimilation analysis of the global upper ocean 1950–95. Part II: results[J]. Journal of Physical Oceanography, 30(2): 311–326.
CARTON J A, GIESE B S, 2008. A reanalysis of ocean climate using Simple Ocean Data Assimilation (SODA)[J]. Monthly Weather Review, 136(8): 2999–3017.
CHELTON D B, SCHLAX M G, SAMELSON R M, 2011. Global observations of nonlinear mesoscale eddies[J]. Progress in Oceanography, 91(2): 167–216.
CHEN CHANGLIN, WANG GUIHUA, 2014a. Interannual variability of the eastward current in the western South China Sea associated with the summer Asian monsoon[J]. Journal of Geophysical Research: Oceans, 119(9): 5745–5754.
CHEN CHANGSHENG, LAI ZHIGANG, BEARDSLEY R C, et al, 2012. Current separation and upwelling over the southeast shelf of Vietnam in the South China Sea[J]. Journal of Geophysical Research: Oceans, 117(C3): C03033.
CHEN GENGXIN, HOU YIJUN, CHU XIAOQING, 2011. Mesoscale eddies in the South China Sea: mean properties, spatiotemporal variability, and impact on thermohaline structure[J]. Journal of Geophysical Research: Oceans, 116(C6): C06018.
CHEN GENGXIN, XIU PENG, CHAI FEI, 2014b. Physical and biological controls on the summer chlorophyll bloom to the east of Vietnam[J]. Journal of Oceanography, 70(3): 323–328.
D'ASARO E, LEE C, RAINVILLE L, et al, 2011. Enhanced turbulence and energy dissipation at ocean fronts[J]. Science, 332(6027): 318–322.
DONG CHANGMING, MCWILLIAMS J C, LIU YU, et al, 2014. Global heat and salt transports by eddy movement[J]. Nature Communications, 5: 3294.
FANG WENDONG, FANG GUOHONG, SHI PING, et al, 2002. Seasonal structures of upper layer circulation in the southern South China Sea from in situ observations[J]. Journal of Geophysical Research: Oceans, 107(C11): 23-1–23-12.
GAN JIANPING, QU TANGDONG, 2008. Coastal jet separation and associated flow variability in the southwest South China Sea[J]. Deep Sea Research Part I: Oceanographic Research Papers, 55(1): 1–19.
GULA J, MOLEMAKER M J, MCWILLIAMS J C, 2014. Submesoscale cold filaments in the Gulf Stream[J]. Journal of Physical Oceanography, 44(10): 2617–2643.
HOSKINS B J, 1974. The role of potential vorticity in symmetric stability and instability[J]. Quarterly Journal of the Royal Meteorological Society, 100(425): 480–482.
HOSKINS B J, BRETHERTON F P, 1972. Atmospheric frontogenesis models: mathematical formulation and solution[J]. Journal of the Atmospheric Sciences, 29(1): 11–37.
HU JIANYU, GAN JIANPING, SUN ZHENYU, et al, 2011. Observed three-dimensional structure of a cold eddy in the southwestern South China Sea[J]. Journal of Geophysical Research: Oceans, 116(C5): C05016.
JING ZHIYOU, QI YIQUAN, FOX-KEMPER B, et al, 2016. Seasonal thermal fronts on the northern South China Sea shelf: satellite measurements and three repeated field surveys[J]. Journal of Geophysical Research: Oceans, 121(3): 1914–1930.
KUO NAN-JUNG, ZHENG QUANAN, HO C-R, 2000. Satellite observation of upwelling along the western coast of the South China Sea[J]. Remote Sensing of Environment, 74(3): 463–470.
LARGE W G, MCWILLIAMS J C, DONEY S C, 1994. Oceanic vertical mixing: a review and a model with a nonlocal boundary layer parameterization[J]. Reviews of Geophysics, 32(4): 363–403.
LI YUANLONG, HAN WEIQING, WILKIN J L, et al, 2014. Interannual variability of the surface summertime eastward jet in the South China Sea[J]. Journal of Geophysical Research: Oceans, 119(10): 7205–7228.
LIU FENFEN, TANG SHILIN, CHEN CHUQUN, 2015. Satellite observations of the small-scale cyclonic eddies in the western South China Sea[J]. Biogeosciences, 12(2): 299–305.
MAHADEVAN A, TANDON A, 2006. An analysis of mechanisms for submesoscale vertical motion at ocean fronts[J]. Ocean Modelling, 14(3–4): 241–256.
MAHADEVAN A, D'ASARO E, LEE C, et al, 2012. Eddy-driven stratification initiates north Atlantic spring phytoplankton blooms[J]. Science, 337(6090): 54–58.
MAURITZEN C, POLZIN K L, MCCARTNEY M S, et al, 2002. Evidence in hydrography and density fine structure for enhanced vertical mixing over the Mid-Atlantic Ridge in the western Atlantic[J]. Journal of Geophysical Research: Oceans, 107(C10): 11-1–11-19.
MCKINLEY G A, PILCHER D J, FAY A R, et al, 2016. Timescales for detection of trends in the ocean carbon sink[J]. Nature, 530(7591): 469–472.
MCWILLIAMS J C, 2016. Submesoscale currents in the ocean[J]. Proceedings of the Royal Society A: Mathematical, Physical and Engineering Sciences, 472(2189): 20160117.
MCWILLIAMS J C, 2017. Submesoscale surface fronts and filaments: secondary circulation, buoyancy flux, and frontogenesis[J]. Journal of Fluid Mechanics, 823: 391–432.
MUNK W, WUNSCH C, 1998. Abyssal recipes II: energetics of tidal and wind mixing[J]. Deep Sea Research Part I: Oceanographic Research Papers, 45(12): 1977–2010.
OMAND M M, D'ASARO E A, LEE C M, et al, 2015. Eddy-driven subduction exports particulate organic carbon from the spring bloom[J]. Science, 348(6231): 222–225.
RISIEN C M, CHELTON D B, 2008. A global climatology of surface wind and wind stress fields from eight years of QuikSCAT Scatterometer data[J]. Journal of Physical Oceanography, 38(11): 2379–2413.
SONG BO, WANG HUIZAN, CHEN CHANGLIN, et al, 2019. Observed subsurface eddies near the Vietnam coast of the South China Sea[J]. Acta Oceanologica Sinica, 38(4): 39–46.
THOMAS L N, 2005. Destruction of potential vorticity by winds[J]. Journal of Physical Oceanography, 35(12): 2457–2466.
THOMAS L N, LEE C M, 2005. Intensification of ocean fronts by down-front winds[J]. Journal of Physical Oceanography, 35(6): 1086–1102.
THOMAS L N, TANDON A, MAHADEVAN A, 2008. Submesoscale processes and dynamics[M]//HECHT M W, HASUMI H. Ocean modeling in an eddying regime. Washington: American Geophysical Union: 17–38.
THOMAS L N, TAYLOR J R, FERRARI R, et al, 2013. Symmetric instability in the Gulf Stream[J]. Deep Sea Research Part II: Topical Studies in Oceanography, 91: 96–110.
TIAN JIWEI, YANG QINGXUAN, ZHAO WEI, 2009. Enhanced diapycnal mixing in the South China Sea[J]. Journal of Physical Oceanography, 39(12): 3191–3203.
WANG GUIHUA, SU JILAN, CHU P C, 2003. Mesoscale eddies in the South China Sea observed with altimeter data[J]. Geophysical Research Letters, 30(21): 2121.
WANG GUIHUA, CHEN DAKE, SU JILAN, 2006. Generation and life cycle of the dipole in the South China Sea summer circulation[J]. Journal of Geophysical Research: Oceans, 111(C6): C06002.
WOODRUFF S D, WORLEY S J, LUBKER S J, et al, 2011. ICOADS release 2.5: extensions and enhancements to the surface marine meteorological archive[J]. International Journal of Climatology, 31(7): 951–967.
WUNSCH C, FERRARI R, 2018. 100 years of the ocean general circulation[J]. Meteorological Monographs, 59: 7.1–7.32.
XIE LINGLING, PALLÀS-SANZ E, ZHENG QUANAN, et al, 2017. Diagnosis of 3D vertical circulation in the upwelling and frontal zones east of Hainan Island, China[J]. Journal of Physical Oceanography, 47(7): 755–774
XIE SHANG-PING, XIE QIANG, WANG DONGXIAO, et al, 2003. Summer upwelling in the South China Sea and its role in regional climate variations[J]. Journal of Geophysical Research: Oceans, 108(C8): 3261.
XIE SHANG-PING, CHANG C-H, XIE QIANG, et al, 2007. Intraseasonal variability in the summer South China Sea: Wind jet, cold filament, and recirculations[J]. Journal of Geophysical Research: Oceans, 112(C10): C10008.
YU JIE, ZHENG QUANAN, JING ZHIYOU, et al, 2018. Satellite observations of sub-mesoscale vortex trains in the western boundary of the South China Sea[J]. Journal of Marine Systems, 183: 56–62.
ZHANG ZHENGGUANG, QIU BO, KLEIN P, et al, 2019. The influence of geostrophic strain on oceanic ageostrophic motion and surface chlorophyll[J]. Nature Communications, 10: 2838.
ZHANG ZHIWEI, TIAN JIWEI, QIU BO, et al, 2016. Observed 3D structure, generation, and dissipation of oceanic mesoscale eddies in the South China Sea[J]. Scientific Reports, 6: 24349.
ZHENG QUANAN, LIN HUI, MENG JUNMIN, et al, 2008. Sub-mesoscale ocean vortex trains in the Luzon Strait[J]. Journal of Geophysical Research: Oceans, 113(C4): C04032.
ZHONG YISEN, BRACCO A, TIAN JIWEI, et al, 2017. Observed and simulated submesoscale vertical pump of an anticyclonic eddy in the South China Sea[J]. Scientific Reports, 7: 44011.
ZHUANG WEI, XIE SHANG‐PING, WANG DONGXIAO, et al, 2010. Intraseasonal variability in sea surface height over the South China Sea[J]. Journal of Geophysical Research: Oceans, 115(C4): C04010.
Analysis of submesoscale characteristics of summer upwelling fronts in the western South China Sea
HUANG Xiaolong1,2, JING Zhiyou1, ZHENG Ruixi1,2, ZHANG Xu1,2
1. State Key Laboratory of Tropical Oceanography (South China Sea Institute of Oceanology, Chinese Academy of Sciences), Guangzhou 510301, China; 2. University of Chinese Academy of Sciences, Beijing 100049, China
We investigate submesoscale characteristics of summer upwelling fronts in the western South China Sea (WSCS) and associated ageostrophic processes by using satellite measurements and high-resolution ROMS simulations. Active submesoscale filaments with a typical horizontal scale of(1-10) km are detected to be characterized by(1) Rossby number (Ro) from the fine-resolution satellite images and simulation results. The diagnostic analysis shows that down-front wind forcing drives a net cross-front Ekman transport and advects heavy water over light water. This process at submesoscale tends to reduce the stratification and potential vorticity (PV), exacerbates the frontal instabilities, and forms the cross-front secondary circulation. The high-resolution simulation results show that the maximum vertical velocity in the frontal zone can reach 100m∙d–1, which significantly enhances vertical material exchange. In this context, active submesoscale processes may contribute to enhanced vertical exchanges of the upper ocean in the summer upwelling front of the western SCS.
upwelling front; submesoscale process; ROMS; satellite remote sensing; western South China Sea
P731.21
A
1009-5470(2020)03-0001-09
10.11978/2019086
http://www.jto.ac.cn
2019-09-12;
2019-12-20。
林强编辑
中国科学院基础前沿科学研究计划原始创新项目(ZDBS-LY-DQC011); 国家自然科学基金项目(41776040); 中国科学院南海生态环境工程创新研究院自主部署项目(ISEE2018PY05); 青岛海洋科学与技术试点国家实验室OCFL功能实验室开放课题(OCFL-201804); 广州市科学研究计划(201904010420)。
黄小龙(1992—), 男, 广东省信宜市人, 硕士研究生, 主要从事上层海洋次中尺度过程研究。E-mail: huangxiaolong@scsio.ac.cn
经志友。E-mail: jingzhiyou@scsio.ac.cn
*感谢三位审稿专家提出的宝贵修改意见。
2019-09-12;
2019-12-20.
Editor: LIN Qiang
Original Innovation Project of Basic Frontier Scientific Research Program of CAS (ZDBS-LY-DQC011); National Natural Science Foundation of China (41776040); Innovation Academy of South China Sea Ecology and Environmental Engineering, CAS (ISEE2018PY05); Laboratory for Ocean Dynamics and Climate, Pilot Qingdao National Laboratory for Marine Science and Technology (OCFL-201804); Guangzhou Science and Technology Project (201904010420).
JING Zhiyou. E-mail: jingzhiyou@scsio.ac.cn