CFD study on double-to single-loop flow pattern transition and its influence on macro mixing efficiency in fully baffled tank stirred by a Rushton turbine☆
2019-08-07QuanhongZhuHangXiaoAqiangChenShujunGengQingshanHuang
Quanhong Zhu,Hang Xiao,Aqiang Chen,Shujun Geng,Qingshan Huang,3,*
1 Key Laboratory of Biofuels,Qingdao Institute of Bioenergy and Bioprocess Technology,Chinese Academy of Sciences,Qingdao 266101,China
2 Dalian National Laboratory for Clean Energy,Dalian 116023,China
3 Key Laboratory of Green Process and Engineering,Institute of Process Engineering,Chinese Academy of Sciences,Beijing 100190,China
Keywords:Rushton turbine Flow pattern Transition Simulation Mechanism Mixing
ABSTRACT For a fully baffled tank stirred by a Rushton turbine(RT),the flow pattern will change from double-to single-loop as the off bottom clearance(C)of the RT decreases from one third of the tank diameter.Such a flow pattern transition as well as its influence on the macro mixing efficiency was investigated via CFD simulation.The transient sliding mesh approach coupled with the standard k-ε turbulence model could correctly and efficiently reproduce the reported critical C range where the flow pattern changes.Simulation results indicated that such a critical C range varied hardly with the impeller rotation speed but decreased significantly with increasing impeller diameter.Small RTs are preferable to generating the single-loop flow pattern.A mechanism of the flow pattern transition was further proposed to explain these phenomena.The discharge stream from the RT deviates downwards from the horizontal direction for small C values;if it meets the tank wall first,the double-loop will form;if it hits the tank bottom first,the single-loop will form.With the flow pattern transition,the mixing time decreased by about 35%at the same power input(P),indicating that the single-loop flow pattern was more efficient than the double-loop to enhance the macro mixing in the tank. A comparison was further made between the single-loop RT and pitched blade turbine(PBT,45°)from macro mixing perspective.The single-loop RT was found to be less efficient than the PBT and usually required 60%more time to achieve the same level of macro mixing at the same P.
1.Introduction
Mixing is one of the most important unit operations in the chemical and biotechnological industries [1]. The mechanically stirred tank is often used to achieve such a goal.Fundamental understanding of flow and mixing therein is critical to the proper design and operation of such apparatuses [2-5]. The Rushton turbine (RT)—a typical radial flow impeller—is one of the most used in mechanically stirred tanks.Its standard clearance(C)off the tank bottom equals 1/3 of the tank diameter(T)[6,7].Under such circumstances,two circulation loops—one below and one above the impeller disk—are normally observed,giving rise to the well-known double-loop flow pattern[8](Fig.1a).On the other hand,Nienow[9]observed that as C decreased from T/3 to a certain value,the double-loop flow pattern evolved into a single-loop one(Fig.1b).In other words,at small C values the RT works like an axial flow impeller.Apparently,the flow field in the stirred tank does not solely depend on the impeller, but contains a substantial restriction from the tank geometry [10]. Such low-clearance configurations are commonly used in designing pump-mix mixers in the nuclear industry to satisfy both the pumping and mixing requirements[11].Moreover,the single-loop flow pattern is more efficient for suspending solid particles in liquid than the double-loop[12-14].
Note that early scholars [9,12,15] also termed the double- and single-loop flow patterns double- and single-eight patterns, respectively.The possibility of utilizing the same RT as either a radial or an axial flow impeller with just different C values is attractive,greatly increasing the operation flexibility to meet different agitation requirements[11].In addition,such a flow pattern transition from double-to single-loop can work as a stringent benchmark for evaluating different CFD simulation strategies and further aiding their development [6].Therefore, it is of both practical and theoretical value to investigate the flow pattern transition.
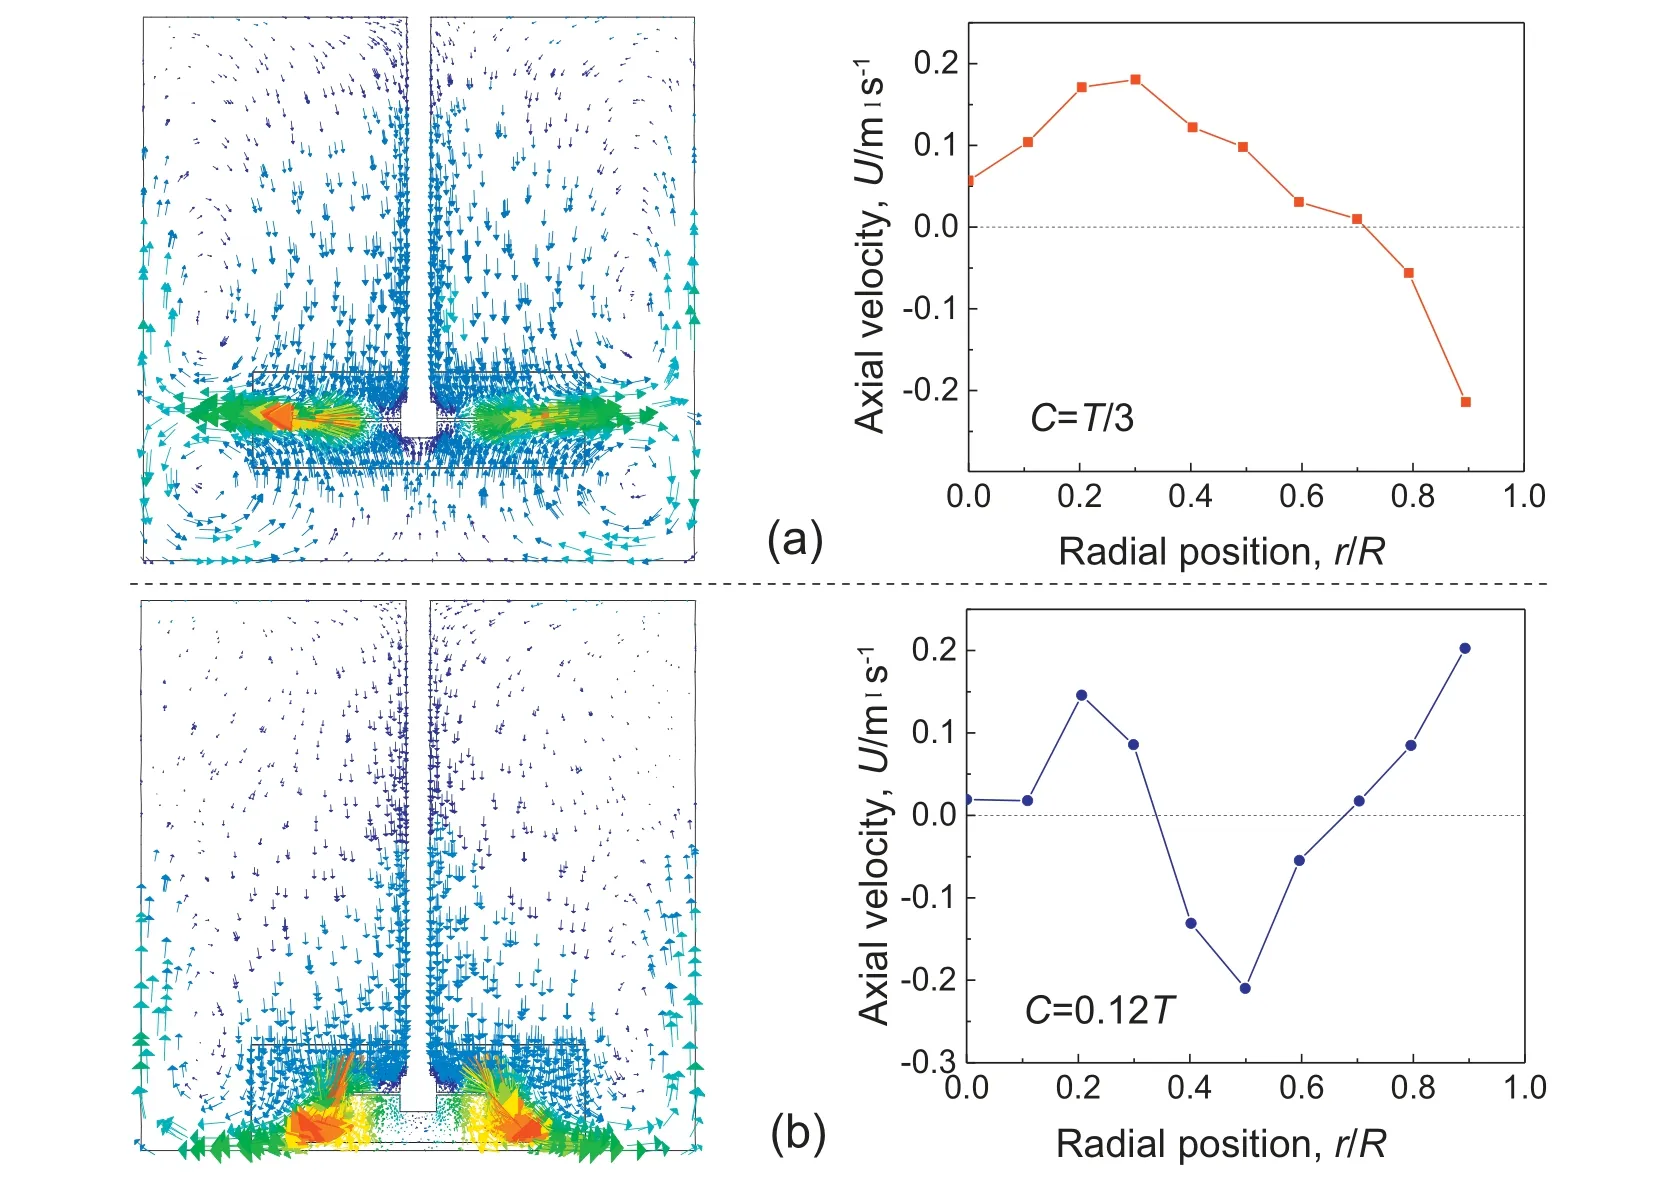
Fig.1.Characteristics of double- and single-loop flow patterns; radial profiles of U are based on a horizontal plane located 15 mm underneath the turbine disk; (a) double-loop,(b) single-loop.
The flow pattern transition from double-to single-loop with decreasing C has many important consequences.For one thing,the power number(NP)decreases significantly[9,15]and less power input(P)is required to maintain the rotation speed(N).The relationship between NPand P is given by Eq.(1),where ρ is the density of fluid in kg·m-3,N is the impeller rotation speed in s-1,and D is the impeller diameter in m.Montante[16]reported that P decreased by 30%with the flow pattern change at the same N.Ibrahim[17]showed that NPmeasured for the single-loop(C=T/6)was around 25%smaller than those for the double-loops(C=T/3,T/4).For another thing,such a flow pattern transition enhances the macro mixing in the tank.Ochieng[7,18]found that as the flow pattern changed from double-to single-loop,the mixing time(θ)showed a decrease of 16.37%at the same N.Recall that P also decreases with the flow pattern transition at the same N,it would be of greater value to compare θ between the two flow patterns at the same P instead of the same N,which is,however,still not seen in the literature by far.

Since the flow pattern transition has such important consequences,relevant works have been done to determine the critical C where it occurs.As per Fig.1,the critical C could be determined by analyzing radial profiles of the axial velocity(U)on a horizontal plane located 15 mm underneath the impeller disk [8]. For the double-loop, U is negative(downwards) in the near wall region, while for the single-loop U therein is positive(upwards).The critical C values reported by different researchers are summarized in Table 1.All previous works gave the critical C a range instead of a value.This resulted from that the flow pattern did not change abruptly at a certain point but randomly within a specified C range. A transitional flow regime existed within the critical C range.In this case,the flow field in the tank was unstable,switching back and forth between double-and single-loop patterns with a welldefined periodicity[12,19].
Potential effects of N and D on the critical C range were also investigated in the literature.Conti[15] found that the critical C range was practically independent on N.This was later confirmed by Montante[16]with N ranging from 80 to 250 r·min-1.Recently,Li[11]also reported that N(97-182 r·min-1)had no influence on the flow pattern transition.On the other hand,Conti[15]also found that the critical C range did not depend on D(0.2-0.37 T).This was later supported by Armenante[12,13]who reported that the higher D/T ratio only required a slightly lower C/T value for the flow pattern transition to take place.However,Li[11]reported recently that at C=0.15 T,the single-loop flow pattern changed into a double-loop one when D was increased from T/3 to T/2. This in essence implied that the greater D was, the smaller the critical C range. Apparently, there is still a controversy about whether D can affect the critical C range.It is of urgent need to determine in future studies the effect of D on the flow pattern transition[16].

Table 1 Critical C range reported in the literature
Based on the above short literature review,this work aims to resolve the controversy by investigating the effect of D on the critical C range over a wider operation range.Then a mechanism of the flow pattern transition will be proposed to systematically explain all the observed phenomena.Thereafter,the effect of C on θ with P being constant will be studied. Finally, a comparison between the single-loop RT and pitched blade turbine(PBT,45°)will be made from the macro mixing perspective.
2.Models and Numerical Techniques
2.1.Physical model
The cylinder tank with a flat bottom had an inner diameter of 290 mm[16].Four flat baffles with a width of 0.1 T and a thickness of 3 mm were fitted vertically and tightly along the tank wall with an equal space.The depth of water equaled T.As shown in Fig.2,the diameter of the RT equaled 98 mm(0.338 T)unless specified otherwise.The blade had a width of D/4,a height of D/5,and a thickness of 1.6 mm;the disk had a diameter of 3D/4 and a thickness of 1.6 mm;the hub had an outer diameter and a height of D/5;the draft had a diameter of 13 mm.The impeller rotated in a clock-wise direction as viewed from above the tank.The rotation speed was 250 r·min-1unless specified otherwise.In addition,the PBT(45°)had the same diameter with the RT.It also rotated in a clockwise direction so as to push the fluid downwards.

Fig.2.Size of the Rushton turbine.
It is noteworthy that different defniitions of C were reported in the literature.Some[12]defined it as the distance from the impeller blade bottom to the tank bottom,while others[1,7,20]denoted it as the distance from the disc center to the tank bottom.The second definition was adopted here.
2.2.Mathematical model
The conservation equations of mass and momentum(i.e.,continuity and Navier-Stokes equations)were solved to obtain the flow field.Due to the high computation cost of large eddy simulation turbulence model,the classical RANS-based models(standard,RNG,and realizable k-ε)for engineering design were employed to deal with turbulence in this fully baffled tank where the swirling motion of the fluid was much not as strong as that in unbaffled tanks [18]. When the flow field reached the steady state at a given N,the macro mixing behavior in the tank was obtained by solving the transport equation of a passive tracer,which is given by Eq.(2):

where Q is the tracer concentration,SQdenotes the source term,and ГQrepresents the molecular diffusivity.
2.3.Numerical techniques
The multiple reference frame(MRF)and sliding mesh(SM)algorithms were adopted and compared to deal with the impeller rotation.Both approaches divided the computation domain into an external domain being stationary and an internal one rotating with the impeller.Data exchange was carried out through the interface between the rotating and stationary domains.In this way,both the stationary baffles and rotating impeller could be conveniently incorporated[6].The SM is a transient algorithm in which the impeller rotation relative to the baffles is explicitly taken into account while in the MRF approach,a steady flow field is predicted for a fixed impeller position relative to the baffles.The capability of these two algorithms to simulate the flow field was tested by observing whether they could correctly predict the critical C range reported by Montante[16]with N=250 r·min-1and D=0.338 T.
The flow field was first solved with the convergence criteria for continuity,momentum and turbulence being 10-5.In general,the time step should not exceed 0.1/N[21],which was therefore set as 10-3s in this work.After the steady flow field has been obtained,the transport equation of the passive tracer was solved together with the flow equations so as to simulate the macro mixing behavior[22].The convergence criterion for the tracer concentration(Q)was set as 10-7[23].
Furthermore,since the positions where the passive tracer is injected and detected have a strong influence on the mixing time(θ)[24,25],these positions were fixed in this work so as to solely investigate the effect of C on θ.The injection point was located in the middle of two adjacent baffles,25 mm below the free liquid surface and away from the tank wall. The detection point was on the other side of the tank,25 mm above the tank bottom and away from the tank wall. These two positions were used most frequently in the literature[26].
The second order upwind scheme was adopted for both time and spatial discretization. A 3D segregated solver with the underrelaxation method was employed to solve the conservation equations.The SIMPLE(Semi-Implicit Method for Pressure Linked Equations)algorithm was used for the pressure-velocity coupling[27].No slip boundary conditions were imposed on the rotating impeller,stationary baffles and walls.The symmetry boundary condition was applied to the free water surface.
3.Results and Discussion
3.1.Grid independence study
Attention must be paid to the grid size so as to reach a balance between the computation accuracy and time cost.The grid independence study was therefore first performed based on the case with D=0.338 T and N=250 r·min-1.The predicted radial profiles of U for different C values are plotted in Fig.3.As the grid was about two-fold fined,the radial profiles exhibited no significant difference for both double-and single-loop flow patterns. Therefore the grid with approximately 290000 cells can be considered as already fine enough. Such a grid was used throughout this work to ensure the high accuracy and to reduce the computation time.

Fig.3.Radial profiles of the axial velocity predicted with different grids;these profiles were based on a plane located 15 mm underneath the impeller disk.
3.2.Statistical average time
For unsteady simulations,the reported results should be based on the statistical average over a given time period after the steady state has been reached.Therefore the time when the steady state is reached should be determined prior to the statistical analysis.For the transient SM strategy,the change of the draft moment with time was plotted to determine such a time[28].As shown in Fig.4,the draft moment did not change any more with the simulation time reaching 5 s.Therefore the statistical average should begin at 5 s or afterwards.Furthermore,Fig.5 shows the radial profiles of U averaged over different time periods.The profile averaged over 5-15 s was almost the same with that averaged over 5-10 s.Hence,the results reported in this work were based on the statistical average from 5 to 15 s.

Fig.4.Change of the draft moment with simulation time.
3.3.Comparison between MRF and SM
Montante[16]reported that for the RT with D=0.338 T and N=250 r·min-1,the flow pattern change from double-to single-loop occurred within a C range from 0.15 to 0.20.The capability of the MRF and SM approaches to simulate the flow field could be evaluated by observing whether they could correctly predict such a critical C range.The simulation results of the two approaches (both coupled with the standard k-ε turbulence model) are listed in Table 2. The critical C range computed by the MRF approach was greater than the experimental results,indicating that it was not capable of simulating the flow pattern transition.The reason behind this is still an open question to solve.On the other hand,the critical C range computed by the SM approach agreed quite well with the experimental results.Therefore,the SM approach was adopted in this work to simulate the flow pattern transition and macro mixing characteristics in the tank.The SM approach still remains the most rigorous and informative solution method for simulating stirred tanks [29], although it typically consumes one order of magnitude of computation time than the corresponding MRF approach[20,29].
3.4.Comparison among turbulence models
The standard,RNG,and realizable k-ε models with standard parameters[30]were adopted to close turbulence during simulation of the folw field.Their performances are compared in Table 2.All the three turbulence models(combined with the SM algorithm)could correctly predict the critical C range.Nevertheless,for the RNG k-ε model,solution of the conservation equations was found to be a little unstable and more iterations were required for each time step to converge.Such an instability problem was also observed by Jaworski[31].As for the realizable k-ε turbulence model,the solution process was even harder to converge.Only the standard k-ε turbulence model could give a quick and stable solution of the transport equations of mass and momentum.

Fig.5.Radial profiles of the axial velocity averaged over different time periods;these profiles were based on a plane located 15 mm underneath the impeller disk.

Table 2 Comparison between MRF and SM approaches as well as among different turbulence models
Although the standard k-ε model was initially derived from the assumption that the turbulence is isotropic,Gimbun[32]argued that it was able to predict both radial and tangential velocities well except in the close vicinity of trailing vortices where the flow was extremely anisotropic.The strong swirling motion that was recognized to be at the base of the k-ε failure in unbaffled tanks was strongly reduced in the fully baffled tanks[8].Therefore,this work employed the standard k-ε model to deal with turbulence due to its low computation cost and sufficient accuracy.Given that the simulation strategy has been successfully established, effects of many factors (such as D and N) on the critical C range and influence of the flow pattern transition on the macro mixing efficiency could be investigated,which will be discussed in the following sections.
3.5.Effects of D and N on the critical C range
The impeller diameter can affect the flow pattern.It was reported that above a D/T ratio of 0.55,the PBT(45°)became a radial flow impeller[29].Fig.6 shows the effect of D on the critical C range within which the flow pattern changes. Here the critical C range was confined by the upper and lower limits.The flow pattern was single-loop for C smaller than the lower limit while for C beyond the upper limit,the double-loop flow pattern formed. For C between the upper and lower limits, the flow field was in the transitional regime.The critical C range decreased monotonously with the increase of D.It was easier for small RTs to form the single-loop flow pattern during the decrease of C.This is in agreement with the experimental results reported recently by Li[11].

Fig.6.Effect of the impeller diameter on the critical C range.
Fig.7 shows the effect of N on the critical C range.As a radial flow impeller,the RT is usually operated in the range of N <300 r·min-1.Within this range,N was found to have no influence on the critical C range.This agrees quite well with Montante's[16]results that with N ranging from 100 to 250 r·min-1,it could hardly affect the critical C range.

Fig.7.Effect of the impeller rotation speed on the critical C range.
Reasons for the effects of D and N on the critical C range will be explained in the following section after the mechanism of the flow pattern transition is proposed.
3.6.Mechanism of the flow pattern transition
Although the present data enable the flow pattern transition to be clearly identified,the mechanism behind such a transition still remains a mystery[16,19].To the best of our knowledge,only two works mentioned the transition mechanism.Montante[16]pointed out that the flow field in the single-loop flow pattern was more complicated than that in the double-loop;the change in the pressure distribution around the impeller with decreasing C was responsible for the flow pattern transition. On the other hand, Ochieng [18] implied that the singleloop flow pattern at low C values resulted from the interaction between the impeller discharge stream and the tank bottom.
In order to propose a mechanism of the flow pattern transition,the already-known phenomena should be first summarized, which are listed in Table 3.Based on these phenomena,the following mechanism can be proposed,which is illustrated in Fig.8.As C decreases from T/3,the discharge stream from the RT deviates downwards from the horizontal direction.What the flow pattern will form depends essentially on which part of the tank the discharge stream meets first.If the discharge stream meets the tank wall first,the formed flow pattern will be double-loop;if it meets the tank bottom first,the single-loop flowpattern will form;if it meets the tank corner directly,the flow field will be unstable and switch between the double-and single-loop patterns.

Table 3 Phenomena related to the flow pattern transition
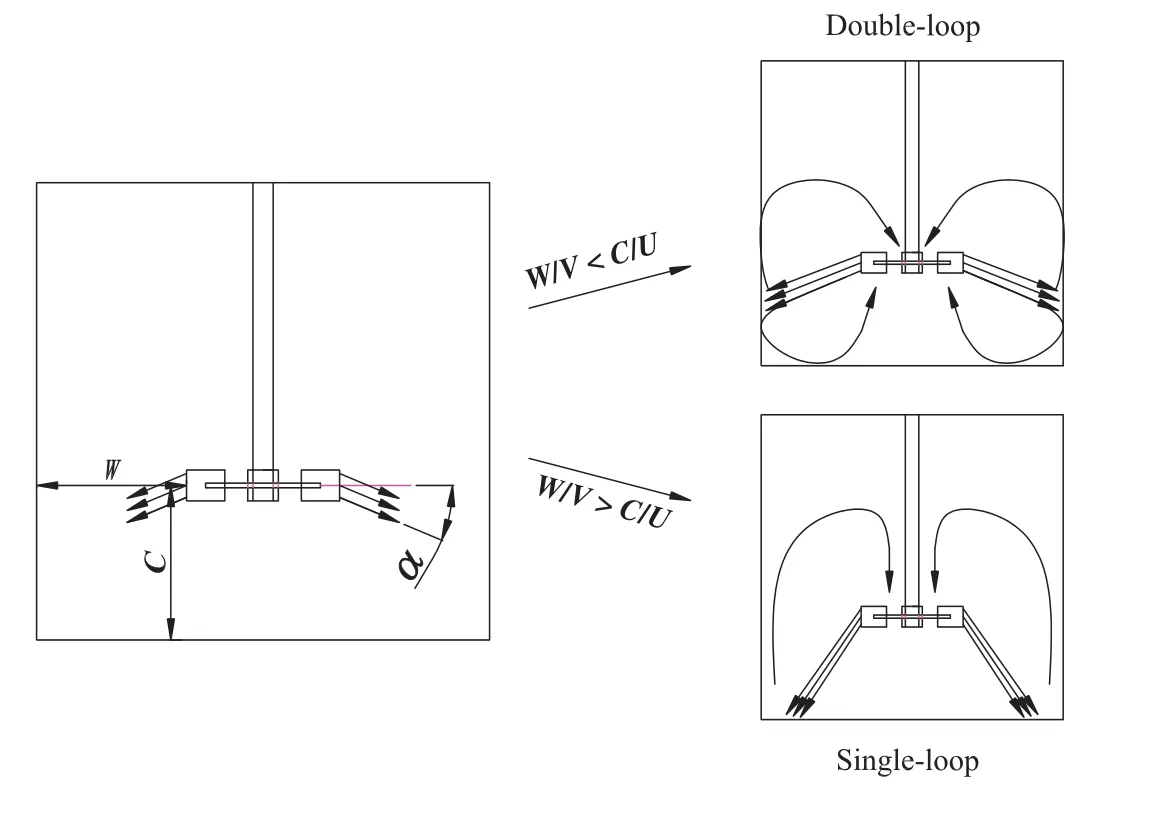
Fig.8.Formation mechanism of double-and single-loop flow patterns;U and V are axial and radial velocities of the discharge stream,respectively.
Furthermore,whether the discharge stream meets the tank wall or bottom first depends on the displacement between the blade tip and tank wall(W=T/2-D/2),C,U,and V(the radial velocity of the discharge stream).The relationship between U and V depends on the discharge stream angle(α)by tangent α=U/V.As shown in Fig.8,if W/V is smaller than C/U,it will take less time for the discharge stream to reach the wall,forming the double-loop flow pattern;is greater than C/U,the discharge stream will hit the tank bottom first, forming the singleloop flow pattern.On the other hand, if W/V is equal to C/U,the discharge stream will reach the tank corner directly,resulting in the unstable flow pattern.
Based on this mechanism,the flow pattern transition from doubleto single-loop with decreasing C could be easily explained.W/V is always smaller than C/U with the RT at the standard position,and therefore the double-loop flow pattern prevails.On decreasing C,W/V will eventually become greater than C/U and resulted into the flow pattern transition to single-loop.Moreover,the effects of N and D on the critical C range could also be explained systematically quite well.The invariance of the critical C range with N results from that N has no influence on α and the relationship between W/V and C/U.Whether the discharge stream meets the tank wall or bottom first depends solely on C.On the other hand,the decrease of the critical C range with increasing D arises from that both W and α decrease as D increases.When the stream is discharged from the RT blade,it moves a shorter distance with a higher V to reach the tank wall and therefore more easily forms the doubleloop flow pattern[11].
Several comments about the above mechanism should be made here.(1)The value of α is still unknown up to now.If it can be measured in the future,the critical C range could be theoretically calculated from the RT size and tank geometry.(2)The reason behind the increase of α with decreasing C and D is critical to the above mechanism. Great attention should be paid to this aspect in future study.As we all know,the fluid will always flow along the way with the smallest resistance.Therefore,the constraint of the tank bottom to the fluid flow at low C values should be carefully considered.(3)The mechanism is also suitable for explaining the flow pattern transition for the PBT with increasing C[10]and D[29].
3.7.Effect of C on the power input

Fig.9.Effect of the bottom clearance on the power number.
Fig.9 shows the effect of C on NPat three different levels of N.NPdropped suddenly by approximately 30% at C ranging from 0.21 to 0.19,which corresponded to the flow pattern transition from doubleto single-loop. This phenomenon is consistent with that reported in the literature [7,9,15-17].For the single-loop flow pattern, C was so small that the RT only had to agitate the lower part of the tank,and therefore the required power input was smaller. On the other hand,no matter it was in the double-or single-loop flow pattern,NPvaried only slightly with C.Only when C was quite small(<0.1 T),there appeared an increase of NPwith further decreasing C.This phenomenon probably resulted from that the tank bottom significantly hindered the stream from discharging out of the RT and more power input was required to maintain the rotation speed.
3.8.Effect of C on the macro mixing behavior
Given that C affects the flow pattern,it will definitely influence the macro mixing behavior,which is the focus of this part.Here the macro mixing behavior was quantitatively characterized by the mixing time(θ) [26,33,34], for which many definitions were proposed [22]. This work adopted the definition that θ was the time from the release of the tracer until its concentration at the detection point reached 95%of the final concentration[27,33,35-38].

Fig.10.Rotation speeds for different C values with P being constant.
It is a convention to compare θ of different turbine configurations at the same P.Under such circumstances,the smaller θ is,the better the turbine configuration is from the macro mixing perspective.However,as per Fig. 9, the power input changes with the decrease of C at the same N. Therefore it is difficult to discuss the effect of C on θ at the same N. To solve this problem, N should be adjusted for different C values so as to keep P being the same.Fig.10 gives the rotation speeds required for different C values so as to keep P being 0.19 W and 3.09 W, respectively. At low off bottom clearances, greater rotation speeds could be maintained with the same power input. Note that there existed a small decrease of N for C <0.1 T,which corresponded exactly to the slight increase of NPtherein(Fig.9).
Fig. 11 shows the effect of C on θ with P being constant. For P =0.19 W,θ decreased from about 38 s to 26 s as the flow pattern changed from double-to single-loop with decreasing C.For P=3.09 W,θ decreased from circa 14 s to 9 s with the flow pattern change.In summary,with the power input being constant the mixing time will decrease by about 35% as the flow pattern changes from double- to single-loop with decreasing C.This is in qualitative agreement with the results reported by Ochieng [7,18] that the mixing time decreased by 16.37%with N being constant.

Fig.11.Effect of the off bottom clearance on the mixing time.
Apparently,the single-loop flow pattern was more efficient than the double-loop to enhance the macro mixing.The longer mixing time for the double-loop flow pattern resulted from that the mixing between the two loops was retarded.The two loops were isolated from the hydrodynamic perspective. The passive tracer injected just below the water surface was entrapped in the upper loop and was difficult to enter the lower loop[7].
3.9.Comparison of macro mixing between single-loop RT and PBT
As discussed above,when C is smaller than 0.19 T and the singleloop flow pattern forms,the RT can work like an axial flow impeller.Therefore this work further made a comparison of the macro mixing behavior between the single-loop RT and PBT(45°),which is presented in Table 4.Note that the PBT also rotated in a clockwise direction as viewed from above the tank and pushed the fluid downwards.

Table 4 Comparison of the macro mixing performance between single-loop RT and PBT
C and N for the RT were fixed at 0.103 T and 285 r·min-1,respectively.Under such circumstances,P and θ equaled 3.09 W and 9.384 s(see Fig.11),respectively.When C for the PBT was 0.338 T(standard position)and N=285 r·min-1,P and θ equaled 1.26 W and 5.850 s,respectively.Compared with those of the single-loop RT,P and θ showed a remarkable decrease by 59%and 38%,respectively.For such a PBT,N should be increased to 384 r·min-1so as to make P reach 3.09 W.In this case, θ equaled 4.198 s, which was smaller than that for the single-loop RT by 55%.Furthermore,we adjusted C for the PBT to be also 0.103 T.Here N must be increased to 366 r·min-1so as to make P reach 3.09 W.Under such circumstances,θ equaled 5.008 s which was smaller than that for the single-loop RT by 47%.
Apparently,although the RT at low off bottom clearances could work like an axial flow impeller,it was still much less efficient than the PBT or other axial flow impellers from the macro mixing perspective.This phenomenon resulted partly from that less energy delivered by the RT was used to drive the macro circulation of liquid.Instead,much of the energy was dissipated in overcoming the resistance of the tank bottom to form the single-loop flow pattern or dissipated in the trailing vortices behind the blades.Further investigation on this aspect is of urgent need.The possibility of utilizing the same RT as either a radial or an axial flow impeller with just different C values significantly increases the operation flexibility to meet different agitation requirements.Nevertheless,the single-loop RT is not recommended for long time usage in enhancing the macro mixing due to its low efficiency compared to the axial flow impellers.
4.Conclusions
The flow pattern transition with decreasing C in a fully baffled tank stirred by a Rushton turbine was investigated via CFD simulation.The sliding mesh approach coupled with the standard k-ε turbulence model was sufficient to predict such a flow pattern transition.The critical C range was found to decrease with increasing D,indicating that the single-loop flow pattern was easier to form for small Rushton turbines.A flow pattern transition mechanism was further proposed to explain these phenomena.Which part of the tank the discharge stream meets first eventually determines whether the double- or singleloop flow pattern will form. As the flow pattern changed from double- to single-loop with decreasing C, θ decreased by approximately 35%at the same P.Apparently,the single-loop was more efficient than the double-loop for enhancing the macro mixing.Further comparison indicated that θ for the single-loop RT was longer than that for the PBT by more than 60% at the same P. Therefore, the single-loop RT was less efficient than the PBT from the macro mixing perspective.It was not recommended for long-term usage if the purpose is to intensify the macro mixing.
Nomenclature
C off bottom clearance,m
D diameter of turbine,m
MRF multiple reference frame
N rotation speed,r·min-1
NPpower number
P power input,W
PBT pitched blade turbine
Q tracer concentration,kg·m-3
R tank radius,m
RT Rushton turbine
r distance to tank axis,m
S source term of tracer
SM sliding mesh
T tank diameter,m
U axial velocity of discharge stream,m·s-1
V radial velocity of discharge stream,m·s-1
W displacement between blade tip and tank wall,m
α angle of discharge stream,rad
Г molecular diffusivity of tracer,kg·m-1·s-1
θ mixing time,s
ρ density of fluid,kg·m-3
Acknowledgements
Our gratitude goes to the Supercomputing Center of USTC(University of Science and Technology of China)for the support.
杂志排行

Chinese Journal of Chemical Engineering的其它文章
- Assessment of the TFM in predicting the onset of turbulent fluidization☆
- Simulation of drop breakage in liquid-liquid system by coupling of CFD and PBM:Comparison of breakage kernels and effects of agitator configurations☆
- Heat transfer characteristics of molten plastics in a vertical falling film reactor☆
- Stabilizing silica nanoparticles in high saline water by using polyvinylpyrrolidone for reduction of asphaltene precipitation damage under dynamic condition
- Numerical simulation and experimental study on dissolving characteristics of layered salt rocks
- Removal of chloride from simulated acidic wastewater in the zinc production☆