Micron-sized diamond particles containing Ge-V and Si-V color centers∗
2019-08-06HangChengZhang章航程ChengKeChen陈成克YingShuangMei梅盈爽XiaoLi李晓MeiYanJiang蒋梅燕andXiaoJunHu胡晓君
Hang-Cheng Zhang(章航程), Cheng-Ke Chen(陈成克), Ying-Shuang Mei(梅盈爽),Xiao Li(李晓), Mei-Yan Jiang(蒋梅燕), and Xiao-Jun Hu(胡晓君)
College of Materials Science and Engineering,Zhejiang University of Technology,Hangzhou 310014,China
Keywords: diamond,germanium-vacancy,silicon-vacancy,photoluminescence
1. Introduction
In the past decades, diamond color centers have caused great interest. The combination of optical active defects with diamond is an ideal solution to many situations, such as high spatial resolution magnetic field sensing, single photon emitter, and biological marker.[1-4]More than 500 color centers in diamond have been discovered, but only about ten of them meet the requirements of ideal single-photon source.[5,6]Nitrogen-vacancy(N-V)is the most available color center,and widely exists in natural and synthetic diamonds.[7]N-V color center has long lifetime of 11-25 ns and a photoluminescence(PL) band from 550 nm to 800 nm.[8]This limits the photonic applications because only 4% of emitted photons concentrate near the zero-photon line (ZPL).[9]Another widely tracked color center is silicon-vacancy (Si-V), which has intensive emission and almost 70%of its emitted photon concentrated near ZPL.[10]The Si-V center life time is nearly 1.2 ns,and the inhomogeneous linewidth could be reduced even to 0.7 nm.[11]Furthermore,the Si-V PL band is proved to be stable in nano-diamond of 2-5 nm.[12,13]The structure of the Si-V center is D3d,making it insensitive to the electrical noise.[14]Due to these excellent properties,the Si-V center shows better potential in quantum information processing.[15-17]
Recently, the germanium-vacancy (Ge-V) center with ZPL peak position of 602 nm has attracted increasing attention.[18,19]The Ge-V center structure is D3d,so the Ge-V center is insensitive to the electrical noise. Moreover,the Ge-V center shows stronger coupling between emitters and photons than the Si-V center.[5]However,it is difficult to prepare high quality Ge-V center since the covalent radius of germanium(122 pm)is larger than that of silicon(111 pm). Ge usually damages the diamond lattice and produces large stresses,which will seriously degrade the Ge-V performance, such as reducing the count rate and uneven displacement of ZPL.[20]The Ge-V center in diamond has been prepared by using a high temperatures and high pressures (HPHT) method, microwave plasma chemical vapor deposition(MPCVD),and ion implantation. At HPHT conditions,diamond crystals containing Ge-V color centers were synthesized from the Ge-C,[18]C-H-Ge,[21]and Mg-Ge-C[22]systems. In the MPCVD process,growing Ge-doped diamond was achieved by using both solid Ge[24]and germane GeH4gas[23]as the Ge source. Ge-V single photon color center has also been prepared by ion implantation on the surface of the bulk diamond.[24]However,ion implantation obviously damaged the diamond lattice and caused unevenly distributed color centers. It was very difficult to repair the lattice defects caused by Ge ion implantation even through high-temperature annealing.[24]
In the applications of quantum information processing and biomarkers, diamond usually needs to couple with optical fibers or enter into cells,so small-sized diamond particles are necessary.[25,26]At present, small particles are normally produced by mechanical grinding of large diamond particles and films,but this method will cause metal contamination and structural defects in the diamond crystal,degrading the PL performance of Ge-V color centers in the diamond.
Here,we proposed to prepare micron-sized diamond particles containing Ge-V centers by using hot filament chemical vapor deposition (HFCVD) on Ge wafer and studied the effects of growth pressure and growth time on the Ge-V PL properties. In order to introduce more Ge atoms to the diamond particles and increase the nucleation density of diamond particles on germanium wafer,we firstly bombarded the Ge wafer with argon ions in physical vapor deposition(PVD).This produced many defects on the Ge wafer,which is beneficial to increase the nucleation density of diamond particles.Also, the Ge atoms of this bombarded wafer can easily be etched into the atmosphere by hydrogen and enter into the diamond lattice in HFCVD.
2. Experiment methods
A Ge wafer was used as the substrate and doping source,which was cleaned through ultrasonic vibration in acetone and ethanol for 20 min and then was dried by nitrogen. The surface of the Ge wafer was bombarded by argon ions in PVD.The PVD parameters were selected as follows: Ar gas flow rate of 25 sccm, working pressure of 0.8 Pa, temperature of 400°C,working power of 100 W,bias of-50 V,and time of 30 min. Subsequently, the processed Ge wafer was used as the substrate, which was placed into the chamber of HFCVD to grow diamond particles. The HFCVD parameters were selected as follows: hot filament power of 1.6 kW,the gas mixture composition of CH3COCH3:H2=20 sccm: 200 sccm,deposition time of 75 min, and reaction chamber pressure of 1.5 kPa,2.5 kPa,3.5 kPa,and 4.5 kPa.Diamond particles were prepared under 2.5 kPa for 45 min, 60 min, 75 min, 90 min,105 min,and 120 min.
Field emission scanning electron microscopy (FESEM)measurements were performed to investigate the morphology of the diamond particles. Here, figures with magnification of 5×10⁴times for overall morphology were shown.Raman and PL spectra were collected by Raman spectroscopy with the excitation laser wavelength of 532 nm (Renishaw RL532C50)at room temperature. In the PL mapping, the scanning step length was 0.2µm. The data from PL mappings were then filtered in accordance with the corresponding Raman mappings and microscopy pictures to make the probability histogram of luminous intensity. Then the average PL intensities of areas were calculated based on the probability histogram.
3. Result and discussion
Figure 1 shows the FESEM images of particles with the growth time of 75 min under different growth pressures. It is observed that four samples consist of dispersed particles,and the surfaces of the particles in Figs. 1(a) and 1(b) are smooth. The crystal faces of the particles become rough with the growth pressure increasing. The diamond particles grown under different pressures have different crystal morphologies. The main reason is that the growth pressure has different effects on the growth rates of the (111) and (100)crystal faces.[27,28]In Fig.1(a),the crystal morphology of the diamond particles is icosahedron. In Fig. 1(b), two kinds of crystal morphologies appear when the particles grow at the pressure of 2.5 kPa. One is a truncated octahedron and the other is a decahedron. Figure 1(c)shows the particles growing at the pressure of 3.5 kPa, and the shape of the decahedrons slightly elongates. Figure 1(d) shows the diamond particles growing at the pressure of 4.5 kPa, and all particles are closing to sphere.

Fig.1. FESEM images of diamond particles growing for 75 min under the growth pressures of (a) 1.5 kPa, (b) 2.5 kPa, (c) 3.5 kPa, and (d)4.5 kPa.
Moreover, Raman and PL spectroscopy measurements were performed to test the phase composition and to demonstrate the existence of Ge-V color centers in the particles, respectively. Figure 2(a) is the Raman spectra collected in the range of 1000-1600 cm-1. The sharp peak at 1332 cm-1indicates high-quality diamond particles.[29]The other two peaks at 1350 cm-1and 1580 cm-1,named as D band and G band,respectively, are regarded as features of sp2carbon (usually graphite).[30,31]Moreover, as the growth pressure increases,the G peak gradually weakens and disappears, while the D peak appears and its content increases. The reason may be that the graphite clusters become larger as the growth pressure increases.

Fig.2. (a)Raman spectra and(b)Ge-V PL spectra of diamond particles growing under the different growth pressures. The inset is the Si-V PL spectrum of the diamond particles grown for 75 min under the growth pressure of 1.5 kPa. Dependence of(c)the diamond peak position and FWHM and(d)the Ge-V position and FWHM on the growth pressure.
Figure 2(b) shows the PL spectra of diamond particles.The Ge-V PL peak is located at 602.4 nm, and the Si-V PL peak is located at 738 nm (inset of Fig. 2(b)). It is observed that not only Ge-V color centers but also Si-V color centers exist in the diamond particles,because silicon wafers are used as the substrate to prepare diamond films in this instrument. The diamonds prepared from this chamber inevitably contain Si-V color centers. As the growth pressure increases,the size of the diamond particles decreases, so that the Raman signal-noise ratio decreases.
Figure 2(c) shows the diamond peak position(1332 cm-1) and full width at half maximum (FWHM) by fitting the Raman spectra in Fig. 2(a). The diamond feature peaks all deviate from 1332 cm-1, which means that all the diamond particles are under stress. In addition, the diamond particles grown at 3.5 kPa have the least stress because the diamond feature peak is the closest to 1332 cm-1. It is observed that the FWHM of the diamond peak gradually increases along with the increasing growth pressure. This suggests that more impurities enter the diamond particles and the diamond structure is damaged as the pressure increases.[4]
Figure 2(d) maps out the peak position and the FWHM of the Ge-V (602 nm) peak, and all these data are derived from the fitting of the PL spectra in Fig. 2(b). Figure 2(d)shows that Ge-V PL spectra slightly blue-shift to near 602 nm and have narrower inhomogeneous distribution as the growth pressure increases. The Ge-V ZPL we prepared is around 602.3 nm,closing to the standard Ge-V ZPL of 602 nm.[18,24]The FWHM of the GeV ZPL is around 4 nm,which is smaller than the reported values,[18,24]suggesting that our Ge-V center has more perfect structure.
Germanium and silicon are introduced into the HFCVD growing particles through random atom movements,resulting in the great uncertainty of both the PL properties of Ge-V and Si-V in each particle. It is very difficult to evaluate the PL intensity and find its dependence on the growth parameters.Therefore,particle areas are selected to perform PL mapping,as shown in both Figs.3(a)and 3(b),which display the Ge-V(602 nm) mapping and the Si-V (738 nm) mapping, respectively. The numbers in Figs.3(a)and 3(b)represent the highest intensity of the color center. Figure 3(c)presents the ratio of the number of Ge-V centers within an intensity interval to the total number of Ge-V centers. The Ge-V mapping statistics of diamonds with growth pressure of 1.5 kPa and growth time of 75 min were collected. Then, for the accuracy of the data, we removed the data without Ge-V PL peak, 10% the highest Ge-V PL intensity data, and 10% the weakest Ge-V PL intensity data. The remaining data were used to make the frequency distribution histogram of Ge-V PL intensity. The statistics of other PL mappings have also been summarized in Fig. S1 of the supplementary material. Figure 3(d) is obtained by calculating the average PL intensity from the frequency distribution histogram of Fig. S1. Figure 3(d) shows that the Si-V average PL intensity is much higher than the Ge-V average PL intensity. The reason is that the covalent radius of germanium(122 pm)is larger than that of silicon(111 pm).Therefore, Si more easily forms Si-V color centers, leading to more Si-V color centers in diamond. The more Si-V color centers created brings out the higher Si-V emission. As the growth pressure increases,the Ge-V center average PL intensity increases accordingly,and the average PL intensity of Si-V increases to 32000 and then fluctuates around this value.Figure 2(c)shows that the FWHM of the diamond peak gradually increases along with the increasing growth pressure. We believe that the change of the PL intensity originates from the increase of the color center concentration in the particles.High growth pressure will cause more Ge and Si atoms to enter into the diamond particles to produce more color centers, which leads to strong PL strength and damaged crystal structure,increasing the FWHM of the diamond peak. However,when the growth pressure increases to 3.0 kPa and above, the Si-V intensity does not further increase, indicating that there exists the saturation of Si-V centers in diamond.
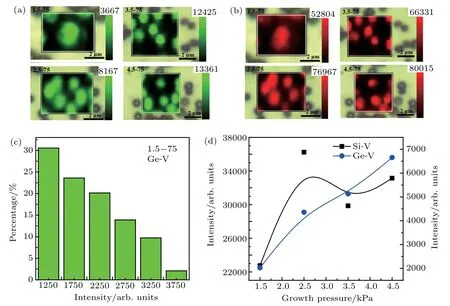
Fig.3. (a)The Ge-V(602 nm)mapping and(b)the Si-V(738 nm)mapping of diamond particle growing under the different growth pressures. (c)The frequency distribution histogram of Ge-V PL intensity. (d)Dependence of the average PL intensities of the color centers on the growth pressure.

Fig.4. FESEM images of the diamond particles grown for(a)45 min,(b)60 min,(c)75 min,(d)90 min,(e)105 min,and(f)120 min under the pressure of 2.5 kPa.
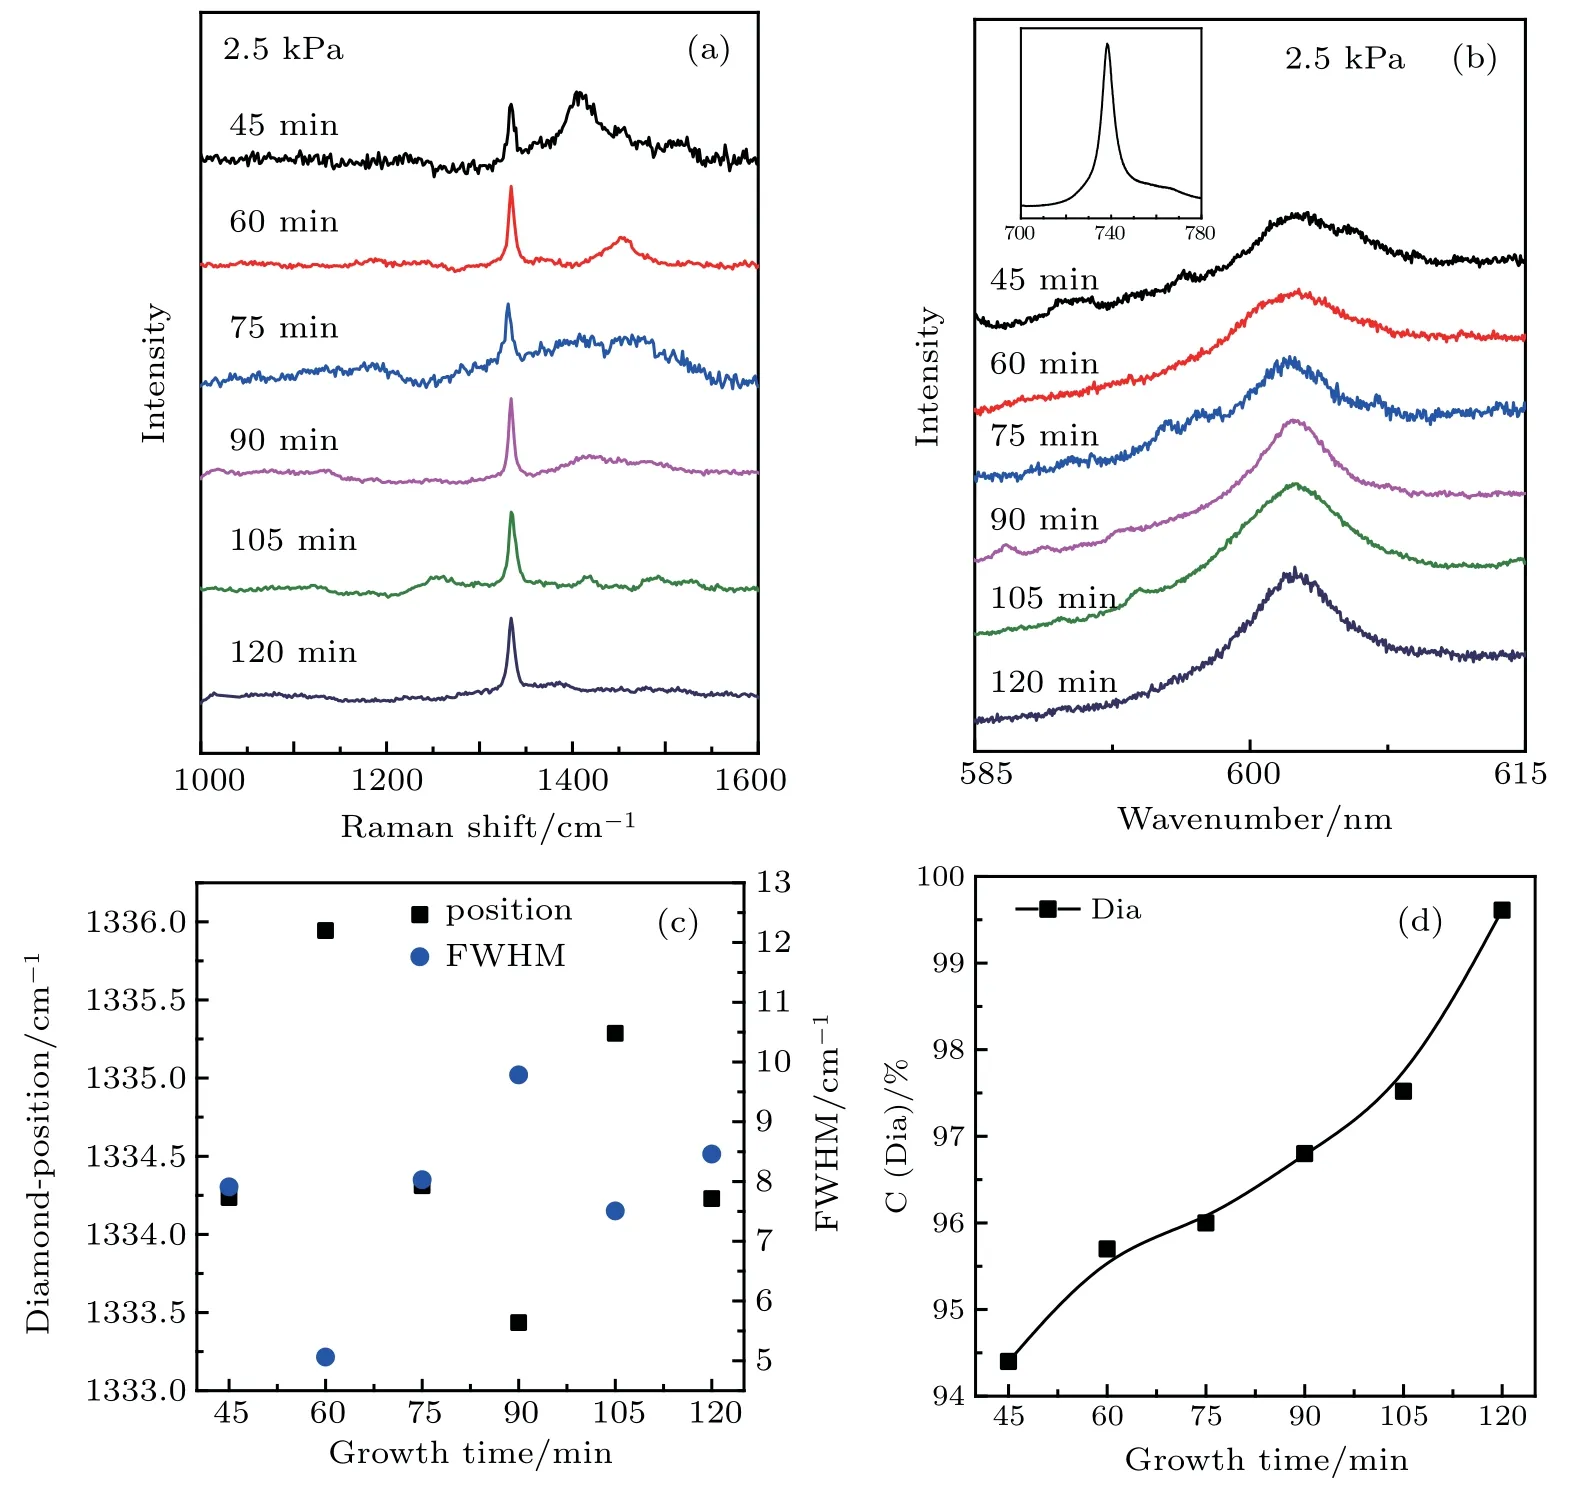
Fig.5. (a)Raman spectra and(b)Ge-V PL spectra of the diamond particles grown for different times under 2.5 kPa. The inset is the Si-V PL spectrum of the diamond particles grown for 120 min under 2.5 kPa. Dependence of (c) the diamond peak position and FWHM and (d) the content of diamond on the growth time.
Figure 4 shows the FESEM images of particles with the growth time of 30 min, 45 min, 60 min, 75 min, 90 min,105 min,and 120 min under 2.5 kPa.It is observed that all particle surfaces are smooth and clear. The particles all have two types of crystal morphologies. One is truncated octahedron and the other is decahedron. The octahedron contains cubeoctahedrons and cyclic twins of cube-octahedrons. The sizes of particles in Figs.4(a)-4(e)are 0.39µm,0.44µm,0.61µm,0.65 µm, and 0.94 µm, respectively. Figure 4(f) shows the sample with the growth time of 120 min, and it is difficult to determine the size because the particles contact with each other.
Figure 5(a)shows the Raman spectra of different samples,indicating the main phase composition of diamond. When the growth time increases, the trans-polyacetylene(TPA),D,and G peak areas will gradually decrease and eventually disappear.The peak of 1332 cm-1gradually becomes the only Raman peak, suggesting that graphite gradually disappears and the diamond particles are close to single crystal diamond. This indicates that the diamond quality improves with increasing growth time. Figure 5(b) shows the PL spectra of diamond particles, in which the peaks at 602 nm and 738 nm (in the inset)are related to Ge-V and Si-V PL,respectively.
Figure 5(c)shows the change of the diamond peak position and FWHM with the growth time obtained by fitting the spectra in Fig.5(a). The position of the diamond peak fluctuates in a small range,so the growth time has little effect on the stress. The difference of FWHM is small,and it can prove that the concentration of Ge-V centers is slightly different from that of Si-V centers. Figure 5(d)shows that the diamond content increases with growth time prolonging. The contents of diamond phase are calculated by the fitted peak area of the diamond peak and other non-diamond peaks in Fig. 5(a) according to the formula in reference.[34]It is observed that the diamond phase content increases with increasing growth time.
We also performed PL mappings of Ge-V (602 nm) and Si-V(738 nm)on the diamond particles,as shown in Figs.6(a)and 6(b). The numbers in Figs. 6(a) and 6(b) represent the highest intensity of the color center.The Ge-V mapping statistics of the diamonds with the growth pressure of 2.5 kPa and the growth time of 45 min are obtained by the same method as Fig.3(c)and the frequency distribution histogram of Ge-V PL intensity is made by analyzing the data,as shown in Fig.6(c).The statistics of other PL mappings are summarized in Fig.S2 of the supplementary material.

Fig.6. (a)The Ge-V(602 nm)mapping and(b)the Si-V(738 nm)mapping of the diamond particles grown for different growth time. (c)The frequency distribution histogram of Ge-V PL intensity. (d)Dependence of the average PL intensity of color centers on the growth time.
Figure 6(d)shows the arithmetic mean values,which are obtained by calculating the frequency distribution histogram of Fig.S2,suggesting the change of the average PL intensity.It is observed that Ge-V and Si-V PL intensities increase with prolonging growth time and the intensity of the Si-V center is much higher than that of the Ge-V center. As shown in Fig. 5(c), there is no large variation of FWHM with the increase of growth time, so the number of color centers entering the crystal is similar and the PL intensity should fluctuate slightly. This is different from the result obtained from the PL mapping of Fig. 6. There must be other factors that affect the PL. We believe the influencing factor is the phase component. Studies have shown that the G and D bands of sp2-bonded carbon and TPA will quench the Si-V PL.[32,33]Because their structures are D3d, the effect of phase composition on the Ge-V color center is similar to the Si-V color center. It indicates that prolonging the growth time not only increased the diamond content, but also reduced sp2-bonded carbon,leading to higher PL intensity.
4. Conclusion
In brief, the diamond particles with Ge-V centers on the Ge wafer are successfully fabricated by HFCVD. The crystal surfaces of the diamond particles become rough, and the crystal morphology changes from icosahedron to truncated octahedron and decahedron, finally becoming spherical as the growth pressure increases. Due to the presence of Si in the chamber,the diamond particles prepared from the chamber all have Si-V color centers. More Ge and Si atoms enter the diamond particles to form Ge-V and Si-V centers with the increase of growth pressure, so the diamond FWHM becomes larger and PL strength becomes stronger. Our Ge-V center has more perfect structure, because the ZPL is closer to 602 nm and the FWHM is smaller than the reported value. Prolonging the growth time, the change of the diamond peak FWHM is small, which shows that the concentration of Ge-V and Si-V centers nearly maintains a constant. Also,prolonging growth time increases the diamond content and reduces the content of sp2-bonded carbon and TPA,enhancing the Ge-V and Si-V PL intensities. Therefore,increasing the growth pressure and prolonging the growth time are all beneficial to enhance the Ge-V PL intensity.
猜你喜欢
杂志排行
Chinese Physics B的其它文章
- Coercivity mechanisms in nanostructured permanent magnets∗
- Progress in recycling of Nd-Fe-B sintered magnet wastes∗
- Grain boundary restructuring and La/Ce/Y application in Nd-Fe-B magnets∗
- Topology of triple-point metals∗
- Local evolutions of nodal points in two-dimensional systems with chiral symmetry∗
- Structural,elastic,and electronic properties of topological semimetal WC-type MX family by first-principles calculation∗