基于金属有机框架衍生的Fe-N-C纳米复合材料作为高效的氧还原催化剂
2019-07-26王倩倩刘大军何兴权
王倩倩,刘大军,何兴权
长春理工大学化学化工系,长春 130022
1 Introduction
The oxygen reduction reaction (ORR) is regarded as one of the most important cathode reactions in clean energy conversion devices such as fuel cells and metal-air batteries1-6. Although platinum is considered as the best electrocatalyst for the ORR,its high cost and scarcity hinder its large-scale practical applications7,8. Furthermore, Pt-based catalysts usually suffer from multiple drawbacks such as low stability and methanol crossover9,10. Therefore, it is highly necessary to develop inexpensive alternatives that possess high efficiency, durability and resistance to methanol. Consequently, much research effort has been devoted to the design and preparation of non-precious metal catalysts (NPMCs) with excellent catalytic activity for the ORR, such as heteroatom (N, S, P, etc.) doped carbon materials10-15,transition metal-nitrogen doped carbon (M-N-C)16-19, transition metal oxides7,20, non-precious metal carbides21-26, metal-Nxmacrocycles27,28, etc. Among them, transition metal-nitrogencarbon (M-N-C) materials, especially for Fe-N-C or Co-N-C,have been a major focus of research and development because of their low cost, excellent electrocatalytic activity and good
stability. It has been demonstrated that heteroatom doping can greatly affect the charge distribution of carbon atoms and their spin density, which can induce active sites in carbon materials3,12,29. In particular, nitrogen atoms can cause adjacent carbon atoms to produce Lewis base sites for greater O2 reduction ability, thus effectively improving ORR activity30.Heteroatom-doped carbon also contributes to mitigating the leaching of metal particles in the catalysts by forming M-N-C bonds and enhances catalytic activity and durability29. Since the first discovery of ORR activity of the Co phthalocyanine complex in 196431, the heat-treated M-N-C (M = Fe or Co) ORR catalysts have been extensively studied32,33. Such catalysts are typically prepared via pyrolyzing a composite precursor containing iron or cobalt, nitrogen, and carbon at temperatures above 700 °C to achieve high activity and a robust structure16-19,32,33.
To design high-performance Fe-N-C catalysts, it is of prime importance to understand their active sites. While multiple active sites have been suggested for these catalysts, including Fe-Nxsites, pyridinic-N and/or graphitic-N, and defect sites of graphitic carbon, and there has been a growing consensus that the Fe-Nxsites are the dominant active centers17,34,35. Recently,metal/metal carbide nanoparticles encased within carbon layers have also been suggested as active sites for Fe-N-C catalysts,whose active sites are believed to be the graphitic carbon shells activated by the encased nanoparticles23,25,26,36,37.
Metal-organic frameworks (MOFs) are a class of porous materials, assembled from metal ions or ion clusters bridged by organic ligands. Owing to their high surface area, controlled crystalline structure, various composition, well-organized framework and tunable porous structure, MOFs have been considered as ideal precursor materials to fabricate high performance carbon-based electrocatalysts31,38-43. For example,Dodelet et al.31developed a new Fe-N-C catalyst through physical mixing of ZIF-8, a zeolitic imidazolate framework(ZIF) composed of Zn and 2-methylimidazole, together with N-chelating Fe compounds using ball milling followed by two annealing treatments using Ar and NH3, respectively. The resulting catalyst generated a high volumetric activity and facilitated mass transport in the porous catalyst layers.
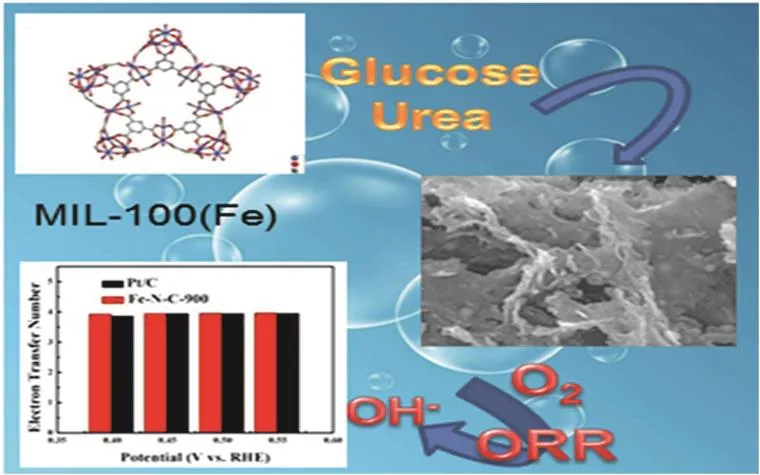
Herein, we report a facile and easily scalable method to prepare a highly active Fe-N-C catalyst, involving physical mixing of MIL-100(Fe) with glucose and urea, and subsequent pyrolysis under inert atmosphere. We demonstrate that the annealing temperature is an important parameter that can be used to tune the composition and structure of the Fe-N-C materials,thus optimizing their electrocatalytic performances. It also shows excellent operational stability and methanol tolerance better than the state-of-the-art Pt/C catalyst.
2 Experimental and computational section
2.1 Materials
1,3,5-Benzenetricarboxylic acid, iron(III) nitrate nonahydrate,glucose, urea and KOH were provided by Beijing Chemical Corp. 5% Nafionperfluorinated resin solution (in ethanol) was obtained from Aladdin. 20% (mass fraction) Pt on Vulcan XC-72 (Pt/C catalyst) was purchased from Alfa Aesar. All the reagents were of analytical grade and used without further purification. Aqueous solutions were prepared using ultrapure water (18.2 MΩ·cm) from a Milli-Q Plus system (Millipore).
2.2 Preparation of the samples
2.2.1 Preparation of MIL-100(Fe)
The synthesis of MIL-100(Fe) was carried out using a previous procedure with slight modifications44. Typically,iron(III) nitrate nonahydrate (484 mg, 1.2 mmol) and 1,3,5-benzenetricarboxylic acid (210 mg, 1.0 mmol) were dissolved in deionized water (5 mL). Then, the resulting solution was stirred for 0.5 h, transferred into a Teflon lined stainless autoclave, and heated at 180 °C for 12 h. The autoclave was let to cool to room temperature in air on its own. The obtained yellow solid was recovered by centrifugation and washed several times with deionized water and ethanol. The material was finally dried overnight at 60 °C in an oven, producing MIL-100(Fe).
2.2.2 Preparation of Fe-N-C
Glucose (40 mg), urea (240 mg) and MIL-100(Fe) (20 mg)were dissolved in the mixed solution of distilled water (5 mL)and ethanol (5 mL), followed by sonication for half an hour. The solvent was slowly removed by rotary evaporation. During this process, glucose and urea molecules self-assembled onto MIL-100(Fe) due to the physical interactions such as van der Waals force and hydrogen bonding. Subsequently, the obtained mixture was heated to 800-1000 °C for 2 h in argon atmosphere at a rate of 5 °C·min-1. The obtained materials were labeled as Fe-N-C-800, Fe-N-C-900 and Fe-N-C-1000.
The Fe-C-900 and Fe-N-900 were also synthesized by a similar procedure as Fe-N-C-900, except that urea and glucose were not added to the synthesis mixture, respectively. MIL-100(Fe) was directly pyrolyzed at 900 °C by using the same procedure as the one used to make Fe-N-C-900 above. The resulting material was named as MIL-900.
2.3 Structure characterization of the samples
The morphologies and structures of the fabricated samples were acquired using scanning electron microscopy (SEM, a JEOL JSM-6701F electron microscope operating at 5 kV),transmission electron microscopy (TEM, a tecnai G220 S-Twin transmission electron microscope operating at 200 kV) and X-ray diffractometer (RIGAK, D/MAX2550 VB/PC, Japan).Raman spectra were obtained using a TriVista™555CRS Raman spectrometer. The laser frequency used was the 532 nm line. X-ray photoelectron spectroscopy (XPS) measurements were performed using an ESCLAB 250 spectrometer with a monochromatized Al KαX-ray source (1486.6 eV) to determine surface chemical compositions and bonding states. Fitting was done using a nonlinear least-squares curve-fitting program(XPSPEAK41 software). XPS deconvolution conditions showed that the background type was Shirley and the FWHM value, as well as the percentage Lorentzian-Gaussian value of these peaks split by the same peak should be close. The Brunauer-Emmett-Teller (BET) surface areas and pore volumes were evaluated using nitrogen adsorption-desorption isotherms measured on a V-SORB2802 volumetric adsorption analyzer at 77 K.
2.4 Electrochemical studies of the prepared samples
In the present work, all electrochemical tests were conducted on an electrochemical workstation (CHI760E, Shanghai Chenhua Co. Ltd., China) with a conventional three-electrode cell system, where a modified electrode was used as the working electrode, a platinum plate as the counter electrode, a saturated calomel electrode (SCE) as the reference electrode, and 0.1 mol·L-1KOH was used as the electrolyte. The working electrode was prepared by the following procedures: the catalyst ink was first prepared by distributing 1 mg of as-synthesizedFe-N-C-900 catalyst or 20% (mass fraction) Pt/C in 1 mL of ethanol under sonication for 3 h. Subsequently, a certain amount of the uniform ink was carefully deposited on the glassy carbon electrode(rotating disk electrode (RDE), d = 5 mm; rotating ring disk electrode (RRDE), d = 5.61 mm), resulting in a catalyst loading of 0.28 mg cm-2. Other counterparts were also kept at the same loading. All potentials in this work were reported vs the reversible hydrogen electrode (RHE) in the working pH, which can be calibrated from the Nernst equation.
The ORR kinetic parameters of the catalysts can be obtained using the following Koutecky-Levich (K-L) equation, Eqs. (1)and (2):
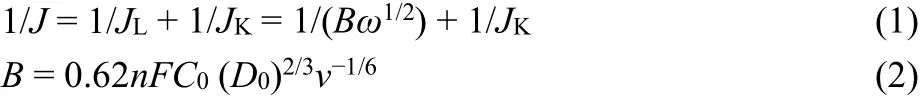
where J is the measured current density; JL and JK are the diffusion limiting and kinetic limiting current densities,respectively; ω is the angular velocity of the disk (ω = 2πN,where N is the electrode rotating speed); B is the Levich slope; n is the transferred electron number; F is the Faraday constant(96485 C·mol-1); C0is the bulk concentration of O2(1.2 × 10⁻³mol mL-1in 0.1 mol·L-1KOH solution). D0 is the diffusion coefficient of O2 in electrolyte (1.9 × 10⁻⁵cm2·s-1in 0.1 mol·L-1KOH solution), and v is the kinetic viscosity (0.01 cm2·s-1in 0.1 mol·L-1KOH solution). Moreover, the diffusion-limiting current density (JL) is obtained from the corresponding current divided by the geometric area of the glassy carbon electrode. The transferred electron number (n) and the yield of H2O2 (Y) during ORR can be calculated using the following equations:
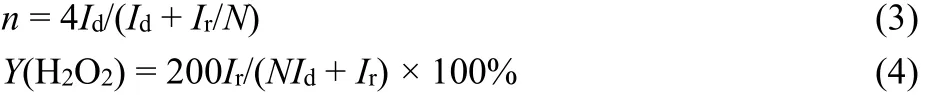
where Iris the ring current, Idis the disk current, and N is the current collection efficiency of the Pt ring.
3 Results and discussion
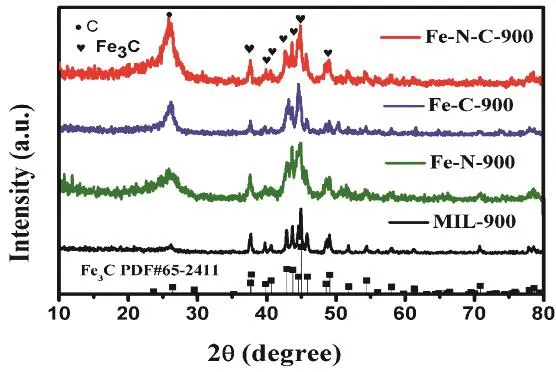
Fig. 1 XRD patterns of Fe-N-C-900, Fe -C-900,Fe-N-900 and MIL-900.
To study the composition of as-obtained samples, XRD measurement was carried out. In Fig. 1, a broad diffraction peak at 2θ ~ 25° appears for Fe-N-C-900, Fe-C-900, Fe-N-900 and MIL-900 samples, implying the formation of the graphitic structure in the hybrid. It is worth noting that the peak intensity of Fe-C-900 and Fe-N-900 at 2θ ~ 25° are distinctly stronger than that of MIL-900, demonstrating that the introduction of glucose or urea is beneficial for the formation of the graphitic structure. It is obvious that the Fe-N-C-900 has the strongest peak at 2θ ~ 25°, which suggests the synergistic effect of glucose and urea. Other diffraction peaks at 37.7°, 39.8°, 40.6°, 43.7°,44.5°, 45.8°, and 49.1° in Fig. 1 can be indexed to the diffraction from (210), (002), (201), (102), (220), (112) and (221) planes of Fe3C (PDF #65-2411) for Fe-N-C-900, Fe-C-900, Fe-N-900 and MIL-900 samples. The XRD results prove the formation of active Fe3C nanocrystals derived from MIL-100(Fe) during the carbonization process.
The morphological and structural properties of Fe-N-C-900 were examined by scanning electron microscope (SEM) and transmission electron microscopy (TEM) techniques. Typical SEM images of the Fe-N-C-900 catalyst are shown in Fig. 2a, b.The Fe-N-C-900 exhibits a folded sheet-like morphology with numerous edges, and the Fe3C nanoparticles seem to be embedded in the matrix of carbon sheets. Fig. S1a-e (Supporting Information) corresponds to SEM images of Fe-N-C-800, Fe-NC-1000, Fe-C-900, Fe-N-900 and MIL-900, respectively. For all of the as-obtained contrast materials, the Fe3C nanoparticles anchored on carbon nanosheets can also be clearly observed. It is worth noting that the mean size of particles loaded on the Fe-N-900 (Fig. S1d) is apparently smaller than that supported on the MIL-900 (Fig. S1e). This result indicates that the addition of urea is beneficial for forming small size of Fe3C nanoparticles,enabling the exposure of more defective sites. After introducing glucose into MIL-100(Fe), the mean size of Fe3C nanoparticles on the Fe-C-900 (Fig. S1c) is similar to that on the MIL-900,while those nanoparticles seem to be covered by carbon layers.This result suggests that the addition of glucose is conducive for producing carbon-encapsulated Fe3C nanoparticles. Metal-based nanoparticles embedded in a few graphitic carbon layers can efficiently optimize the electronic structure of the outer carbon layers, enhancing the activity of the catalysts toward ORR25,26.Above observations distinctly demonstrate that the introduction of both urea and glucose is quite essential to produce Fe-N-C hybrid materials with small and carbon-enclosed Fe3C nanoparticles. Fig. 2c shows a typical TEM image of Fe-N-C-900. The Fe3C nanoparticles encapsulated with graphitic carbon layers can be clearly seen. The inner nanocrystal cores display the lattice fringes with a d-spacing of 0.21 nm in high-resolution TEM (HRTEM, Fig. 2d), which are ascribed to (211) plane in Fe3C (PDF #65-2411)21. The clear lattice fringes with an interlayer distance of 0.348 nm in the shell part correspond to the(002) plane in graphitic carbon19. The TEM image and corresponding elemental mapping results (Fig. 3) confirm the existence of C, N, O and Fe elements in Fe-N-C-900. Notably,except for Fe, all the elements are homogeneously distributed.Fe is obviously concentrated mainly in some sections of the nanoparticles.
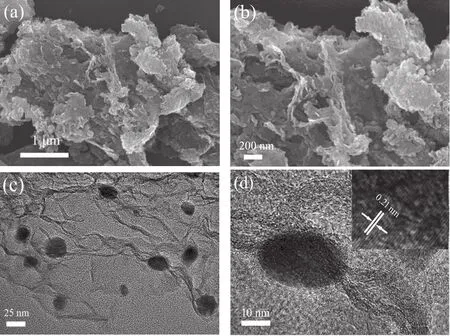
Fig. 2 (a, b) SEM images of Fe-N-C-900 under differentmagnifications; (c) TEM and (d) HRTEM images of Fe-N-C-900.
The high degree of graphitization of the resultant catalysts was further confirmed by Raman spectroscopy, a sensitive tool for characterization of graphitic carbon. As shown in Fig.4a, the Raman spectroscopy of Fe-N-C-T (where T represents the pyrolysis temperature) show two prominent peaks at 1350 and 1582 cm-1, belonging to the D band arising from the disordered carbon atoms and the G band related to sp2-hybridized graphitic carbon atoms, respectively45. Obviously, the ID/IGratios of Fe-N-C catalysts decrease with the elevated pyrolysis temperature,indicating a higher pyrolysis temperature tends to obtain a Fe-NC sample with higher degree of graphitization. Raman spectra of Fe-C-900, Fe-N-900 and MIL-900 samples are shown in Fig. S2(Supporting Information). Both the Fe-N-900 (0.966) and Fe-C-900 (1.162) have smaller ID/IGvalues than MIL-900 (1.293),suggesting the introduction of urea or glucose can obviously increase the degree of graphitization of the obtained samples.Fe-N-C-900 shows an ID/IGvalue of 1.00, which is slightly higher than that of Fe-N-900 but lower than those of Fe-C-900 and MIL-900, ascribing to the balance between the disorder structure caused by heteroatoms doping and the graphitic structure. The changes in the crystallite size of Fe-N-C-T, Fe-C-900, Fe-N-900 and MIL-900 further prove above results, as shown in Table S1(Supporting Information). The low ID/IGvalue indicates the good electrical conductivity of the as-prepared catalysts46,47.
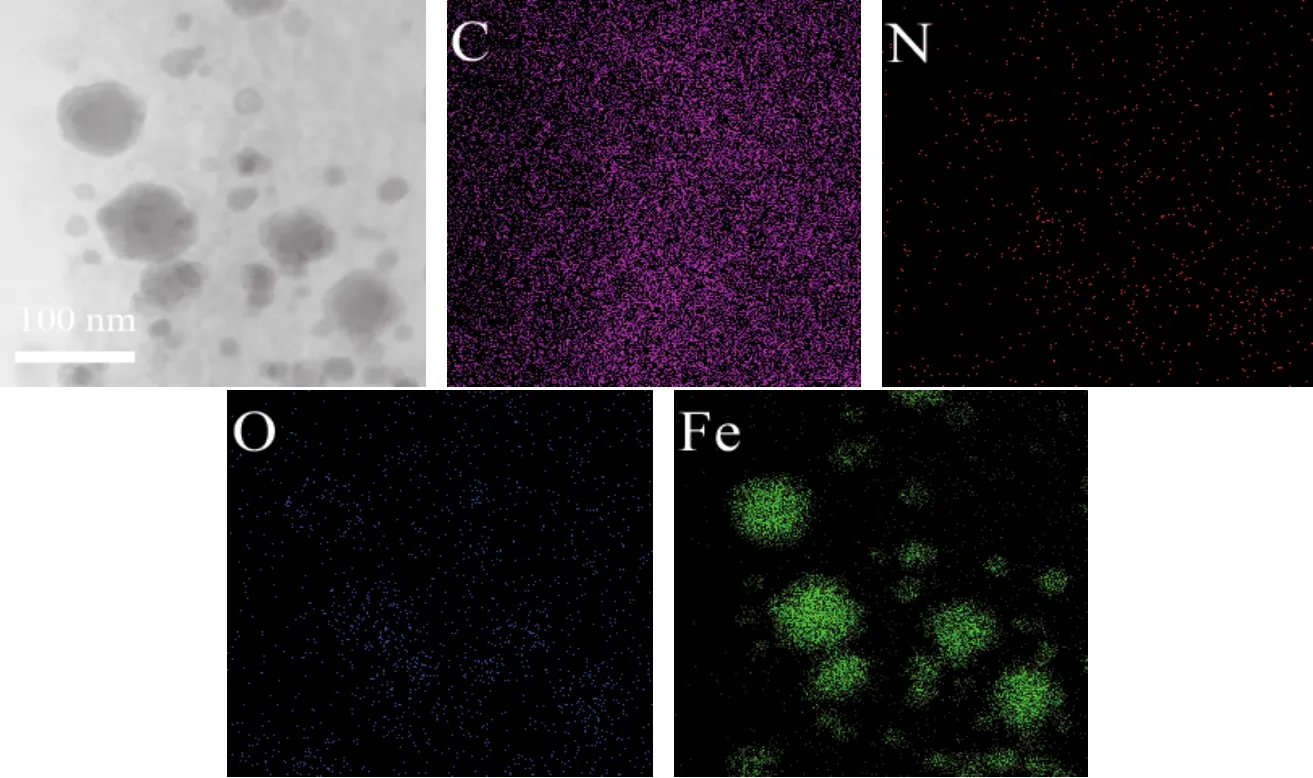
Fig. 3 TEM image with the corresponding C, N, O and Fe element mapping images of the Fe-N-C-900.
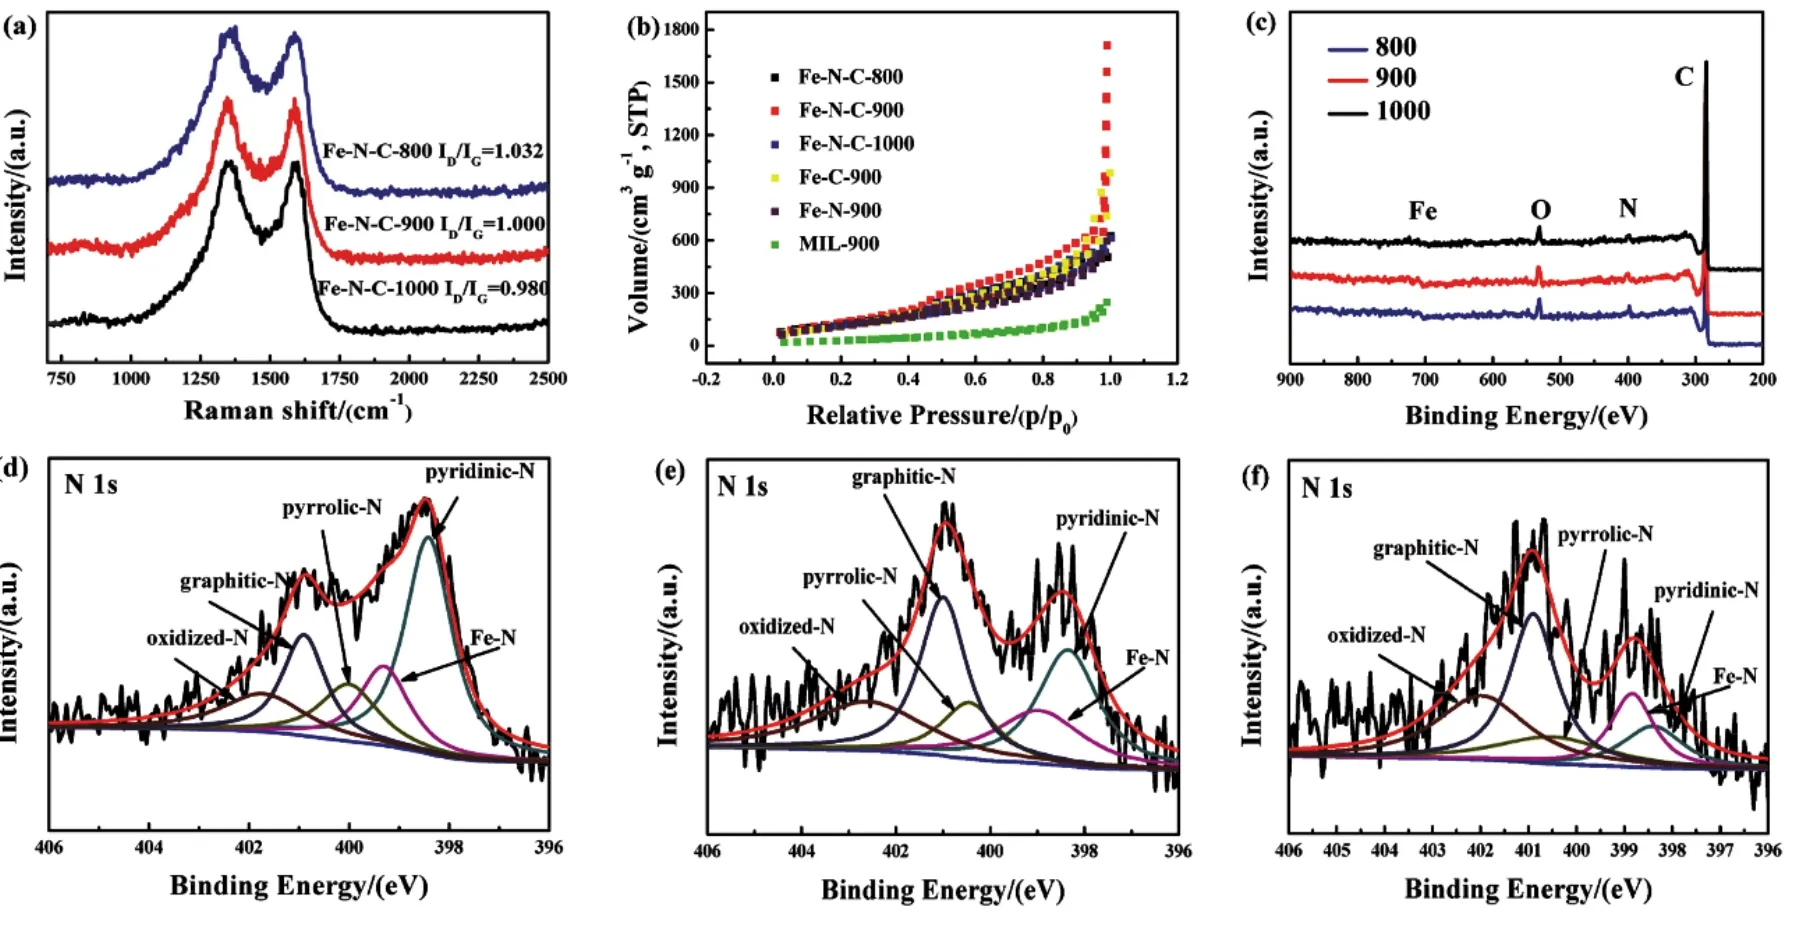
Fig. 4 (a) Raman spectra of Fe-N-C-800, -900 and -1000. (b) N2 adsorption and desorption isotherms of Fe-N-C-800, -900, -1000, Fe-C-900,Fe-N-900 and MIL-900 samples. (c) XPS survey of Fe-N-C-800, -900 and -1000. High-resolution N 1s XPS spectra of Fe-N-C-800 (d),Fe-N-C-900 (e) andFe-N-C-1000 (f).
The surface area and porous texture of the resultant catalysts were characterized on the basis of N2adsorption/desorption analysis. N2 sorption isotherms of the as-obtained Fe-N-C-800,Fe-N-C-900, Fe-N-C-1000, Fe-C-900, Fe-N-900 and MIL-900 samples (Fig.4b) can be identified as typed-IV isotherms with a pronounced hysteresis loop, suggesting the existence of mesoporous structure48,49. The BET surface areas and total pore volumes are summarized in Table S1. Obviously the Fe-N-C-900 possesses the highest BET surface area and largest pore volume, which are beneficial for the exposure of more active sites and faster mass transfer50. Notably, without adding urea or glucose, the BET surface areas of the obtained Fe-C-900 (435 m2·g-1) or Fe-N-900 (428 m2·g-1) are distinctly larger than that of MIL-900 (112 m2·g-1) but smaller than that of Fe-N-C-900(502 m2·g-1). These results prove that urea and glucose may have double functions in the pore formation processes: as extra poregenerating agents and dopant precursors.
To study the surface composition and chemical states of these materials, X-ray photoelectron spectroscopic (XPS) analyses were performed. As shown in Fig.4c, the XPS survey spectra of Fe-N-C obtained at different pyrolysis temperatures show the presence of C 1s, N 1s, O 1s and Fe 2p peaks in the materials.The nitrogen contents of Fe-N-C-800, -900 and -1000 catalysts are 5.69%, 4.2% and 3.0% (atom percent), as shown in Table S2(Supporting Information). Obviously the overall nitrogen content of the samples decreases with the elevated pyrolysis temperatures, which is possibly ascribed to the decomposition of nitrogen-containing species at higher temperatures. The highresolution N 1s XPS spectra are shown in Fig.4d-f. The N 1s spectra for Fe-N-C can be fitted into five peaks corresponding to pyridinic-N (~398.2 eV), Fe-Nx(~399.3 eV), pyrrolic-N (~400.2 eV), graphitic-N (~401.0 eV), and oxidized-N (402.0 eV)species (Table S3, Supporting Information)51. It is generally believed that pyridinic-N and pyrrolic-N may coordinate with Fe to form Fe-Nxmoieties17,35. It is clear from Table S3, an increase in pyrolysis temperature leads to lower content of pyridinic-N,while the graphitic-N content becomes dominant in the materials. The increase of graphitic-N content is attributed to the conversion of the unstable pyridinic-N and pyrrolic-N to graphitic-N under higher temperature51-53. It is evident that the Fe-N-C-900 possesses the highest total content of pyridinic-N and graphitic-N functionalities (Table S3). Generally, pyridinic-N and graphitic-N species are often regarded as the active sites in N-doped carbon materials that participate in ORR54,55. In addition, the as-obtained Fe-N-C-900 also shows dominant Fe-N content. It is widely accepted that Fe-Nxspecies are the electrocatalytically active sites for ORR17. Fig. S3 (Supporting Information) shows the high-resolution Fe 2p XPS spectra of the Fe-N-C-900. The deconvoluted spectra show the existence of five different peaks. The peak centered at 707.4 eV suggests the presence of Fe3C. The Fe 2p peaks at 710.4 and 712.3 eV are assigned to 2p3/2of Fe2+and Fe3+species. The peaks at 723.4 and 725.8 eV are fitted to 2p1/2of Fe2+or Fe3+species53,56.
To investigate the ORR activities of various catalysts, the samples were deposited onto GCE to form the working electrodes. The ORR catalytic activity of the catalysts was first characterized by cyclic voltammetry (CV) and rotating disk electrode (RDE) tests in 0.1 mol·L-1KOH. As depicted in Fig.5a, in contrast to the featureless CV curve in a N2saturated electrolyte, Fe-N-C-900 presents a well-defined oxygen reduction peak in an O2-saturated electrolyte. Remarkably, the Fe-N-C-900 exhibits an ORR peak potential at 0.79 V vs RHE with the peak current density of -2.6 mA·cm-2, suggesting the prominent ORR activity of the Fe-N-C-900. To further evaluate the electrocatalytic activity of the Fe-N-C-900, Pt/C, Fe-C-900,Fe-N-900 and MIL-900, linear scan voltammetry (LSV)measurements of catalysts for ORR were performed in an O2saturated 0.1 mol·L-1KOH solution at a rotation rate of 1600 r·min-1. As shown in Fig. 5b, the Fe-C-900 displays worse activity than MIL-900 in terms of onset potential and half-wave potential, suggesting that the introduction of exotic inert carbon(glucose) is not beneficial for the improvement of ORR activity.In contrast, the ORR activity of Fe-N-900 is superior to MIL-900, which demonstrates that the nitrogen doping is conducive for the enhancement of the ORR activity. Compared to other control catalysts, the Fe-N-C-900 shows a superior onset potential (0.96 V vs RHE), more positive half-wave potential(0.830 V) and lager ORR current density. Although its half-wave potential is slightly worse than Pt/C (0.85 V), the onset potential of Fe-N-C-900 is the same with the benchmark Pt/C catalyst(0.96 V vs RHE). These results indicate that the Fe-N-C-900 possesses superior ORR activity, demonstrating the cooperativity of glucose and urea contributes a lot to enhancing ORR activity of the fabricated Fe-N-C-900. To further evaluate the electrocatalytic activity of the Fe-N-C-900 and Pt/C with the different catalyst loadings, linear scan voltammetry (LSV)measurements of catalysts for ORR were performed in an O2 saturated 0.1 mol·L-1KOH solution at a rotation rate of 1600 r·min-1in Fig. S4 (Supporting Information). The electrocatalytic activities of the Fe-N-C catalysts obtained at different pyrolysis temperatures were measured by RDE in Fig. 5c. It is found that all the Fe-N-C samples show prominent ORR catalytic activities,and the optimum carbonization temperature appears to be 900 °C. The enhanced performance of the Fe-N-C-900 toward ORR is attributed to an optimal balance of the specific surface area, active site density and electronic conductivity. We also compare the ORR activity of our as-obtained Fe-N-C-900 with those of some state-of-the-art M-N-C catalysts reported in literature (Table S4, Supporting Information). As seen from Table S4, the electrocatalytic activity of the as-preparedFe-N-C-900 catalyst is comparable or superior to those M-N-C catalysts in terms of the onset potential, half-wave potential and limiting current density.
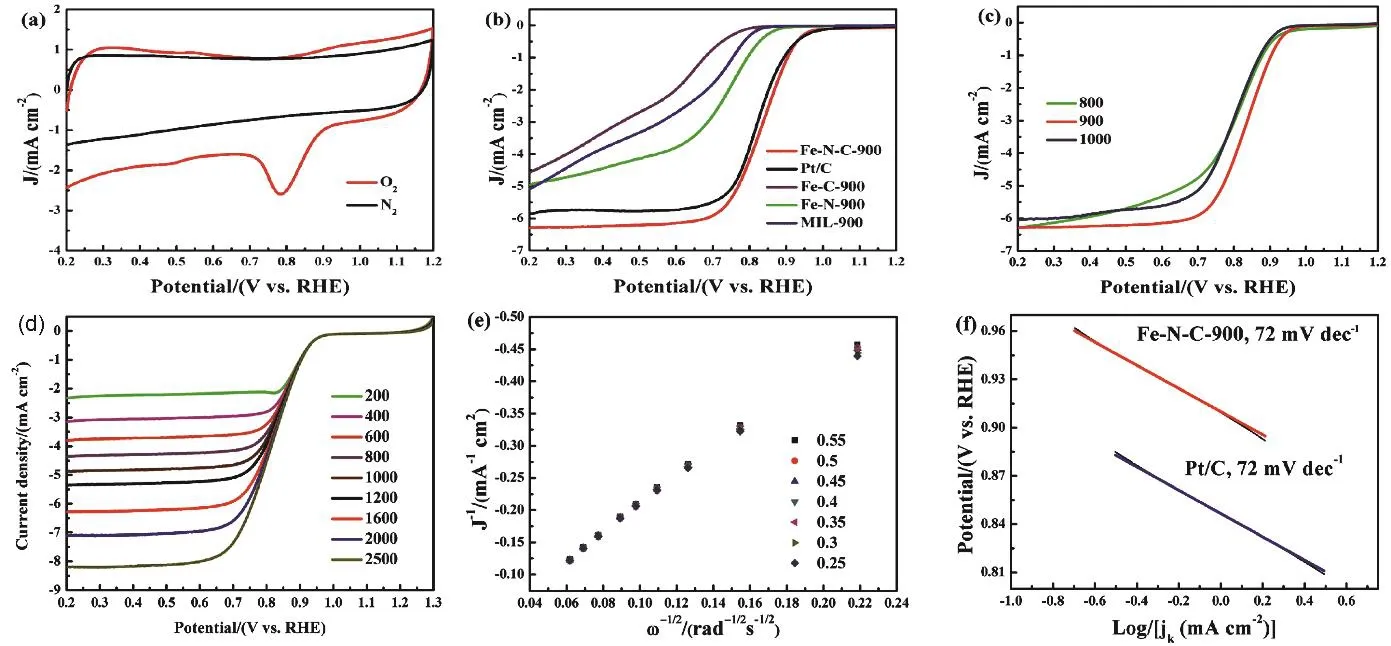
Fig. 5 (a) CV curves of Fe-N-C-900 in O2- and N2-saturated 0.1 mol·L-1 KOH solutions with a scan rate of 100 mV·s-1.(b) LSV curves of Fe-N-C-900, Fe-C-900, Fe-N-900, MIL-900 and Pt/C. (c) LSV curves of Fe-N-C-T catalysts at a rotation speed of 1600 r·min-1 with a scan rate of 10 mV s-1. (d) LSV curves of Fe-N-C-900 at different rotation speeds in O2-saturated 0.1 mol·L-1 KOH.(e) The corresponding Koutecky-Levich plots of ORR for Fe-N-C-900. (f) Tafel plots obtained from the RDE measurements on Fe-N-C-900 and Pt/C catalysts in O2-saturated 0.1 mol·L-1 KOH at 1600 r·min-1.
The LSVs of Fe-N-C-900 with various rotation speeds in an O2saturated 0.1 mol·L-1KOH solution were implemented to thoroughly explore the ORR kinetics of the Fe-N-C-900 catalyst.In Fig. 5d, the current densities are increased with the increase of rotating speed from 200 to 2500 r·min-1owing to the faster oxygen diffusion to the electrode surface. The Koutecky-Levich(K-L) plots shown in Fig.5e suggest that these plots exhibit good linearity with a rather consistent slope over the potential range of 0.55-0.25 V, demonstrating that the ORR process on the Fe-N-C-900 follows the first-order reaction kinetics to oxygen concentration57. Fig. 5f displays the Tafel slopes of Fe-N-C-900 and Pt/C. It is noticed that the Tafel slope of Fe-N-C-900 (72 mV·dec-1) is the same with that of Pt/C (72 mV·dec-1), further demonstrating they possess a very similar reaction mechanism of ORR, where the rate-determining step is likely the first electron reduction of oxygen58.
To further examine the ORR activity on the samples, RRDE measurements were employed to evaluate the ORR mechanism in depth. Fig. 6a shows the disk and ring current density on Fe-N-C-900 and Pt/C. The electron transfer number (n, Eq. (3))calculated from a RRDE technique suggests that the Fe-N-C-900 catalyst favors a 4e ORR process, similar to ORR catalyzed by the commercial Pt/C catalyst (n ≈ 4, Fig. 6b), producing water as the main product. RRDE measurement was conducted to monitor the formation of H2O2during the ORR process. As shown in Fig. 6c, the H2O2yield of Fe-N-C-900 in 0.1 mol·L-1KOH is below 4% in the measured potential range from 0.4 to 0.55 V, which is even smaller than that of the benchmark Pt/C catalyst, manifesting higher catalytic efficiency of the Fe-N-C-900 toward ORR.
For practical applications, the methanol crossover effect and stability toward ORR are also important parameters in the quantification and comparison of catalytic performance. The methanol crossover effect was evaluated on both Fe-N-C-900 and Pt/C (Fig. 6d). The Fe-N-C-900 catalyst suffers from a little change in current density upon the introduction of 3 mol·L-1methanol into 0.1 mol·L-1KOH saturated with O2; however, for the case of Pt/C the current density undergoes a sharp decrease under the same conditions. Above results suggest that our Fe-NC-900 catalyst has good tolerance to methanol crossover. For investigating the electrode stability, an operational stability test was performed using the chronoamperometric current-time (i-t)method in an O2-saturated 0.1 mol·L-1KOH aqueous solution at 0.79 V and a rotation rate of 1600 r·min-1. As shown in Fig. 6e,the current density of Fe-N-C-900 remains 94.9% of its initial value after 10000 s, and the value for Pt/C catalyst is 82%. To further evaluate the electrocatalytic activity of the Fe-N-C-900 after the stability test, LSV measurements of Fe-N-C-900 for ORR were performed in an O2-saturated 0.1 mol·L-1KOH solution at a rotation speed of 1600 r·min-1. Fig. S5 (Supporting Information) shows LSV curves of Fe-N-C-900 before and after stability tests. It is clear from Fig. S5 that the onset potential of the ORR over Fe-N-C-900 remains unchanged and the halfwave potential is decreased only by 5 mV after stability test.Above results demonstrate that our fabricated Fe-N-C-900 catalyst possesses high ORR activity. The high stability of Fe-N-C-900 can be attributed to the uniformly distributed iron carbide nanoparticles with graphitized carbon outlayer, avoiding the aggregation or dissolution of iron carbide nanoparticles.
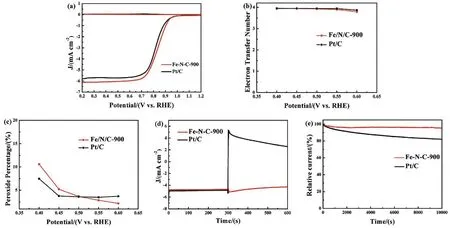
Fig. 6 (a) Rotating ring disk electrode (RRDE) measurements of Fe-N-C-900 and Pt/C in O2-saturated 0.1 mol·L-1 KOH at a rotation speed of 1600 r·min-1 with a scan rate of 10 mV s-1. (b) Electron transfer number of Fe-N-C-900 and Pt/C. (c) Peroxide percentage of Fe-N-C-900 and Pt/C.(d) Chronoamperometric response of Fe-N-C-900 and Pt/C to addition of methanol at 300 s. (e) Chronoamperometric response of Fe-N-C-900 and Pt/C in O2-saturated 0.1 mol·L-1 KOH.
The remarkable electrocatalytic activity of Fe-N-C-900 for ORR in alkaline media may have resulted from the combination of the following factors: (1) the outer protective graphitic layers stabilize the Fe3C nanoparticles of the materials in alkaline media, although the inner Fe3C nanoparticles are not in direct contact with the electrolyte, they play a crucial role in catalyzing ORR by activating the outer surface of the graphitic layers; (2)the Fe-N-C-900 possesses dominant electrocatalytically active species such as pyridinic-N (25.3%)and graphitic-N (27%); (3)the high surface area of the Fe-N-C-900 can help creating more surface-exposed reactive sites that promote ORR over the material; and (4) more importantly, the synergistic effect among the catalytic active species in the materials contributes to the substantial enhancement in the catalytic activity of the material toward ORR.
4 Conclusions
In summary, a highly active Fe-N-C catalyst was obtained by pyrolyzing the mixture of MIL-100, glucose and urea under inert atmosphere. Among the materials obtained, the one made at 900 °C, Fe-N-C-900, was found to exhibit superior ORR activity, high durability and good methanol tolerance under alkaline media, comparable to the benchmark Pt/C (20% Pt)catalyst. The large BET area and total pore volume, high contents of nitrogen doping species, excellent electrical conductivity and cooperative effects between reactive functionalities are proposed to be responsible for excellent ORR activity and stability of the material. The Fe-N-C catalyst reported here is, therefore, highly promising to be part of highlyefficient and cost-effective future energy devices.
Supporting Information:available free of charge via the internet at http://www.whxb.pku.edu.cn.