Relationship between characteristic lengths and effective Saffman length in colloidal monolayers near a water-oil interface∗
2019-06-18NaLi李娜WeiZhang张伟andWeiChen陈唯
Na Li(李娜),Wei Zhang(张伟),and Wei Chen(陈唯)
1State Key Laboratory of Surface Physics and Department of Physics,Fudan University,Shanghai 200438,China
2School of Physical Science and Technology,China University of Mining and Technology,Xuzhou 221116,China
Keywords:colloidal monolayer,cross-correlated diffusion,hydrodynamic interactions,characteristic length
1.Introduction
Con fined colloidal systems are ubiquitous and important in many real scenarios.Examples of such systems include porous media,[1-3]micro fluidic devices,[4-11]proteins in the cytoplasm,[2]and cell membranes.[12-14]The dynamics of a con fined colloidal suspension depend on the boundary conditions of the system[15-21]and are more complicated than those of an unbounded free three-dimensional(3D)bulk liquid.Generally,the strength of the hydrodynamic interactions(HIs)between two tracked particles is a function of their separation distance in the liquid.[3,22,23]When a membrane is suspended in a liquid,the HIs in the membrane exhibit a transition from two-dimensional(2D)to 3D in nature with an increasing distance r.[22,24,25]In a quasi-2D system,such as a cell membrane,a liquid-liquid interface,or a liquid film,a characteristic length can be de fined to describe the distance at which the crossover from 2D membrane dynamics to 3D bulk dynamics occurs in the liquid.[25-27]When the distance r is much smaller than the characteristic length,both the mass and momentum of the membrane are conserved,as in a 2D membrane,[25,28,29]which results in a decay of the HIs with the distance r as ln(1/r)due to the contributions of 2D shear stress.When the distance r is greater than the characteristic length,the momentum is transmitted into the surrounding fluid,[13,26]which causes the HIs to decay with the distance r as 1/r due to the contributions of the 3D shear stress.
The characteristic lengths of a system depend on the boundary conditions of that system. In the Saffman model,[27,30]the characteristic length of a thin sheet of viscous fluid of viscosity ηssuspended in an unbounded bulk liquid of viscosity ηbis de fined as λs= ηs/ηb,which is called the Saffman length.The characteristic length of a semi-in finite system,such as a viscous film at a water-air interface,is also taken to be equal to the Saffman length λs= ηs/ηb.[22]However,if the viscous film at the water-air interface is replaced by a colloidal monolayer,the characteristic length of this particle monolayer will depend on both the particle size a and the Saffman length λsof the monolayer in the following form:a(λs/a)3/2.[31]When the colloidal monolayer is detached from the interface and placed in bulk water close to the water-air interface,the characteristic lengths in the two orthogonal directions are anisotropic;they are expressed as λsand a(λs/a)2/3.[32]However,the characteristic lengths of a particle monolayer near a water-oil interface have not been closely studied until now.We wonder whether characteristic lengths of colloidal monolayers near a water-oil interface can be achieved by the method developed in colloidal monolayers on a water-air interface,[31]and what different features will be exposed between those two systems.When a colloidal monolayer is located near a water-oil interface,momentum diffuses from the colloidal monolayer into the bulk water and bulk oil on either side.In such a scenario,this system can be regarded as similar to a 3D bulk system.However,the HIs in the monolayer will be in fluenced by the interface,such as that in monolayers near a water-air interface.[32]Thus,it is interesting to consider which kind of HIs behavior can be expected in a colloidal monolayer near a water-oil interface.
In this paper,we report an investigation of the HIs in colloidal monolayers near a water-oil interface that was conducted by experimentally measuring the cross-correlated diffusion of the colloid particles. We find that an effective Saffman length λs∗should be introduced in such a system.Using λs∗,the characteristic lengths of the colloidal monolayer can be de fined,and they are found to be different in the two orthogonal directions.In the longitudinal direction,the characteristic length is equal to λs∗itself,while in the transverse direction,the characteristic length exhibits a power-law relationshipwithλs∗.From these characteristic lengths, the friction coefficientsof the colloidal mono layers can be estimated,and the results are consistent with those obtained from single-particle measurements.Using the characteristic lengths as scaling factors,universal curves describing the cross-correlated diffusion in a water-oil system are obtained.These universal curves are independent of the separation between the colloidal monolayerand the interface, unlike in the case of a water-air system.Such universal curves can help us to further understand the dynamics of fluids near a soft boundary.
2.Experimental data analysis and discussion
The experimental setup is shown in Fig.1(a).A stainless steel sample cell with two layered chambers was constructed,similar to that described in Ref.[33].The chamber for water was 8 mm in width and 0.8 mm in depth.The chamber for oil was 15 mm in width and 1 mm in depth.An aqueous colloidal solution was introduced into the chamber for water such that it filled the chamber.Once the water-air interface was level,decalin was used to fill the oil chamber.The layers of liquid were sandwiched between two coverslips.Finally,the prepared sample was placed upside down and allowed to remain undisturbed for at least two hours.The particle solution was pinned by the edge of the stainless steel hole and remained on top of the layer of decalin.The particles sank under gravity and formed a monolayer close to the water-oil interface.The repulsive interaction of the image charges balanced the action of gravity on the particles,preventing the particles from contacting the water-oil interface.Samples of three kinds of colloid particles were used,namely,silica spheres with radii of a=0.6µm(S1)and a=1.0µm(S2),and polystyrene(PS)latex spheres with a radius of a=1.0µm(S3),as presented in Table 1.Silica spheres with SiO-groups on their surfaces were purchased from Bangs,and PS spheres with sulfate groups on their surfaces were purchased from Invitrogen.The colloidal samples were cleaned seven times by centrifugation to eliminate any possible surfactant and then suspended in deionized water with a conductivity of 18.2 MΩ·cm.The decalin used was a mixture of cis and trans with a density of 0.896 g/cm3and a viscosity of 2.36 cp at a temperature of 28°C,which was purchased from Sigma-Aldrich.An inverted Olympus IX71 microscope with a 40×objective and a digital camera(Prosilica GE1050,1024×1024 pixels,14 fps)were used to record the positions of the particles.The spatial resolution was 0.09µm/pix.Each image sequence consisted of 500 consecutive frames,and each image had dimensions of 176µm×176µm.A typical image obtained by the microscope is shown in Fig.1(b).Under the frame-collecting rate of 14 fps,particles diffuse a short distance,which is much less than the average separation between the neighbor particles during time intervals between two adjacent frames.The positions of centers of particles were estimated by the geometric mean of positions of pixels.The error of the particle location estimated was half a pixel,i.e.,45 nm in our experiments.Using homemade software(IDL),we obtained the trajectories of the particles with a similar particle tracking algorithm in Ref.[34].From these particle trajectories,the single-particle diffusion and the correlated diffusion between particles were calculated to study the HIs in the colloidal monolayer.

Table 1.Parameters α,β,γ,and the separation z for three samples.
First,from the particle trajectories,the particle displacement over a lag time was calculated as Δsi(τ)=si(t+τ)-si(t).The single-particle self-diffusion coefficient Ds(n)was calculated from the mean square displacement using the relation 〈Δs2i(τ)=4Ds(n)τ.As shown in Fig.1(c),Ds(n)scaled by D0is a function of the particle area fraction n,where D0is calculated according to the Einstein-Stokes relation:D0=kBT/6πaη.The measurements of this scaled diffusion coefficient Ds(n)/D0were fit to the following second-order polynomial.[33,35]Ds(n)/D0= α(1-β ·n-γ·n2).Here,the parameter α is related to the local viscosity experienced by the particles in the dilute limit,and the parameter β is related to the two-body interactions between the particles.When n→0,the diffusion coefficient Ds(0)can be obtained from the formula Ds(0)/D0=α;this coefficient is the self-diffusion coefficient of a particle in the monolayer in the dilute limit.From Ds(0)/D0,the separation z from the center of the colloidal monolayer to the water-oil interface was calculated according to Eq.(1):[19,36]

where ηwis the viscosity of the water and ηois the viscosity of the decalin.The fitted values of the parameters and the calculated values are shown in Table 1.
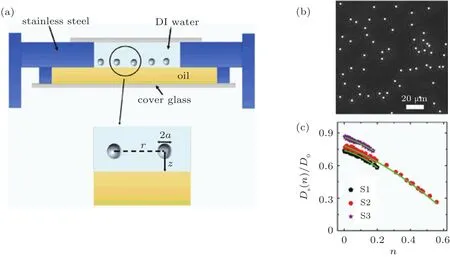
Fig.1.(a)Schematic illustration of the experimental setup.The distance between particles is denoted by r,the separation from the center of the particle monolayer to the water-oil interface is denoted by z,and the parameter a is the particle radius.(b)Optical microscopic image of silica particles of radius a=1.0µm suspended near a water-decalin interface at an area fraction of n=0.01.(c)Normalized self-diffusion coefficient Ds(n)/D0as a function of the area fraction n for each of the three samples:S1(black pentagon),S2(red dot),and S3(purple star).The green curves are fits to the following second-order polynomial Ds(n)/D0=α(1-β ·n-γ·n2).
From the displacement Δs(τ),the cross-correlated diffusion coefficients D‖,⊥(r)were calculated in the directions longitudinal and transverse to the line connecting the centers of two particles(i and j)according to Eq.(2).In Eq.(2),‖and⊥represent different coordinates along and perpendicular to the line connecting the centers of particle pair i and j. Δsi‖(t,τ)and Δsi⊥(t,τ)represent the components of the displacement Δsi(τ)of particle i at time t during the interval time τ in the longitudinal and transverse directions,respectively.Ri,j(t)is the distances between the particles i and j,and the average〈···〉is taken over time t and over all observed particle pairs between which the distances r are equal to Ri,j(t).

Figure 2 shows the cross-correlated diffusion coefficients D‖,⊥(r)scaled by the self-diffusion coefficient Ds(n)as functions of the distance r,which is scaled by the particle diameter 2a,for sample S1.The area fraction for sample S1 ranges from 0.007 to 0.20.From Fig.2,it can be seen that the scaled cross-correlated diffusion coefficients D‖,⊥(r/2a)/Ds(n)are invariant with the concentration n. However,the crosscorrelated diffusion should be strongly in fluenced by the viscosity of the colloidal monolayer,which directly depends on the concentration n.The effects of the concentration n on the cross-correlated diffusion are hidden in the plots of D‖,⊥(r/2a)/Ds(n)for this sample.This finding suggests that the single-diffusion coefficient Ds(n)and the particle diameter 2a are not good parameters with which to analyze the crosscorrelated diffusion.The scaled cross-correlated diffusion coefficients D‖,⊥(r/2a)/DS(n)for the other two samples,S2 and S3,are shown in Fig.A1 and Fig.A2 in the Appendix A.The raw data of S1 and S3 were published in Ref.[31],while data of S2 are published first time.
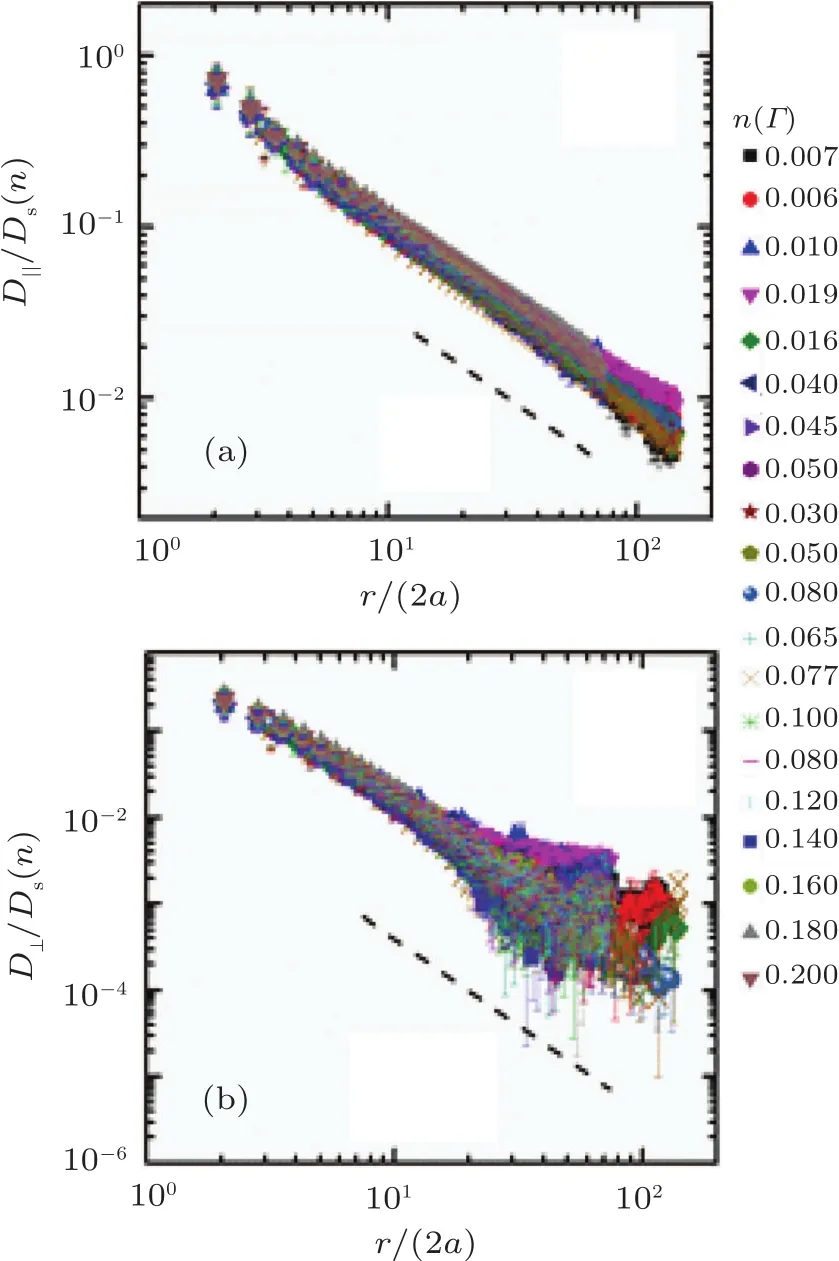
Fig.2. Measured correlated diffusion coefficients D‖/Ds(n)(a)and D⊥/Ds(n)(b)as functions of r/(2a)for sample S1 at different particle area fractions n on a log-log plot.The concentration n ranges from 0.007 to 0.20,and the friction coefficient of the particle monolayer ranges from 0.06 cP·µm to 3.53 cP·µm.The differently colored symbols represent different values of n and different viscosity coefficients,where the black squares correspond to n≈0.007 and the maroon inverted triangles correspond to n≈0.020.The dashed lines are guides for the eye,corresponding to∼1/r in panel(a)and to∼1/r2in panel(b).
The self-diffusion coefficient for a single particle is writtenasDs(n)=kBT/κηa,whereκ is a dimensionless constant.κηa represents the friction experienced by one particle.For a particle in a colloidal monolayer,normally such a friction include two terms,Γ(0)and Γ(1),one related to the contribution from the surrounding liquid and the other to the contribution from the colloidal monolayer.According to Refs.[31]and[32],the self-diffusion fcoefficient Ds(n)can be divided into two effective coefficients:Ds(0)=kBT/Γ(0)and D′s(0)=kBT/Γ(1),where Γ(0)= κ(0)ηba and Γ(1)= κ(1)ηs.Parameters κ(0)and κ(1)are two dimensionless coefficients.The term Γ(0)is the friction coefficient of the colloidal monolayer in the dilute limit(n=0),which re flects the influence of the local environment of the liquid.The ot he rterm,Γ(1),is the friction coefficient of the colloidal monolayer at concentrations of n>0,which is in fluenced by the many-body effect of the particles.The effective diffusion Ds(0)can be obtained by means of a fit parameter α as follows:Ds(0)= α ·D0.D′s(n)can be calculated from the equation 1/Ds(n)=1/Ds(0)+1/D′s(n).[31,32]The effective diffusion D′s(n)depends on the concentration n.As shown in Fig.3,D′s(n)exhibits an inverse relation with n,as expressed by D′s/Ds(n)=1+3/2n,for each of the three samples.As shown in the inset of Fig.3,such a relationship is a general description for all samples when n<0.1.The value 3/2 in the above equation could be estimated by the inverse value of averaged β in Table 1.

Fig.3.The calculated D′s(n)values scaled by Ds(n)as a function of the area fraction n for all three samples:S1(black pentagon),S2(red dot),and S3(purple star).The green line shows the fit to D′s(n)/Ds(n)=1+3/(2n).A log-log replot of D′s(n)/Ds(n)-1 versus n is shown in the inset,where a green line with a slope of-1 is plotted as eye guide.
Because Γ(0)represents the friction experienced by a single particle in dilute limit and only Γ(1)represents the friction contributed by the interaction between the particles in the monolayer.[29]Considering that D‖,⊥re flects the strength of HIs between the particles,the change of D‖,⊥induced by n is contributed only by the change of Γ(1),and has nothing to do with Γ(0).After all,Γ(1)is a function of n,while Γ(0)is a constant and independent of n.Thus,the effective diffusion coefficient D′s(n),which only relates to the friction coefficient Γ(1),is a more suitable scaling factor than Ds(n).
The plots of D‖,⊥/Dsin Fig.2 should thus be replaced with plots of=D‖,⊥/D′s.In Figs.A3-A5 in Appendix A,the plots of(r/2a)increase with increasing Γ(1),showingan influence of the concentration n, as expected.Moreover,new characteristic lengths should be determined to normalize the distance r to obtain a universal function of cross-correlated diffusion.
As shown in Figs.4(a)and 4(b),all of the scaled cross correlated diffusion coefficients De‖,⊥collapse to single master curves when the distance r is scaled by an adjustable parameter R‖,⊥to obtain r′‖,⊥=r/R‖,⊥.The scaled cross-correlated diffusion coef ficientsDe‖,⊥(r‖′,⊥)for large values of Γ(1)fall on the upper left sides of the corresponding master curves,and for small values of Γ(1),they fall on the lower right sides.The curves indicate that the scaled correlation coefficients De‖,⊥(r‖′,⊥),representing the strength of the HIs,are strong for a colloidal monolayer with a highΓ(1).For the other two samples,we obtained similar results using the same method(see Figs.4(c)-4(f)).The scaled cross-correlated diffusion coefficients for all three samples with different separations collapse to single master curves,as shown in Figs.4(g)and 4(h).The universal master curves for the different samples indicate that the HIs in a particle monolayer near a water-oil interface can be described by the same rule,even for monolayers containing particles of different sizes or lying at different separation distances from the interface.It is noted that a bit of curvature of plots in Fig.4(h)occurs when r approaches the particle size,since a logarithmic dependence of D(r)will be introduced in the short limit of r.
The universal master curves can be obtained only with suitable parameters R‖,⊥.As length scales,R‖,⊥can be regarded as characteristic lengths of the system.The question then becomes how these characteristic lengths should be interpreted.In the Saffman model,[27]the characteristic length of a membrane is λs= ηs/ηb,which depends on the viscosity of the membrane.Based on the concept of λs,we de fine an effective Saffman length λs∗for a particle monolayer near a water-oil interface,expressed as λs∗=Γ(1)/6πηb.The effective Saffman length is the ratio of the friction coefficient Γ(1)of the particles in the monolayer to the traditional friction coefficient 6πηbof the particles in a bulk liquid.In the present system,the effective coefficient λs∗is written as λs∗=Γ(1)/(6π ·(ηw+ηo)/2.The characteristic length R‖in the longitudinal direction is taken to be equal to λs∗,as shown in Eq.(3):

From Eq.(3)and the definition of λs∗,the friction coefficient values Γ‖(2)can be obtained from R‖=Γ‖(2)/(6π ·(ηw+ηo)/2).The superscript and subscript of Γ‖(2)suggest that this friction coefficient can be estimated from two-particle diffusion measurements in the longitudinal direction.Meanwhile,Γ(1)can also be obtained from single-particle diffusion measurements,in accordance with the formulas D′s(n)=kBT/Γ(1)and 1/Ds(n)=1/Ds(0)+1/D′s(n).
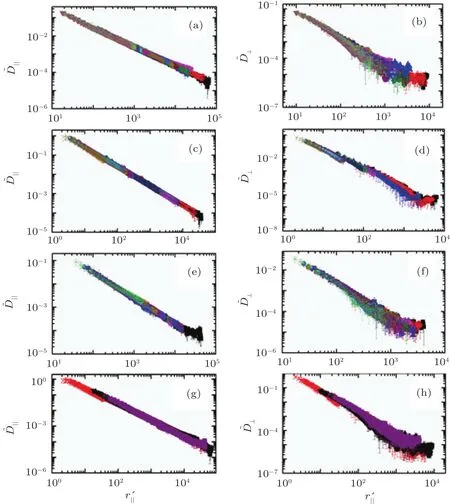
Fig.4.Scaled correlated diffusion coefficientas a function of the scaled distance r‖′for samples S1(a),S2(c),S3(e).Scaled correlated diffusion coefficientas a function of the scaled distance r⊥′for samples S1(b),S2(d),S3(f).The differently colored symbols represent different values of n.The concentration n ranges from 0.007 to 0.2 for S1[panels(a)and(b)],from 0.02 to 0.62 for S2[panels(c)and(d)],from 0.005 to 0.18 for S3[panels(e)and(f)].The comparison of three master curves‖(r‖′)(g)and(r′⊥)(h)for all samples:S1(black),S2(red),and S3(purple).The symbols used in panels(a)and(b)are the same as those in Fig.2.The symbols used in panels(c)and(d)are the same as those in Fig.A1 in the appendix.The symbols used in panels(e)and(f)are the same as those in Fig.A2 in the appendix.
As shown in Fig.5(a),the Γ‖(2)values obtained from R‖agree with the Γ(1)values obtained from D′s(n),which justi fies the rationality of the relationship R‖=λs∗.However,in the transverse direction,the equivalent of Eq.(3),R⊥=λs∗,does not work as the characteristic length.If R⊥=λs∗is assumed,then the friction coefficient Γ⊥(2)obtained from λs∗=Γ⊥(2)/(6π ·(ηw+ηo)/2)is not a linear function of Γ(1).In fact,Γ⊥(2)will exhibit a power-law relationship with Γ(1),expressed as Γ⊥(2)∼(Γ(1))2/3.Such a wrong dependence of Γ⊥(2)on Γ(1)given by the assumption(R⊥=λs∗)is shown in Fig.5(b),as a comparison of the correct dependence in Fig.5(a).As suggested by this power-law relationship,the transverse characteristic length R⊥should instead be written as for Γ⊥(2)=Γ(1)to be satis fied,where λs∗=Γ⊥(2)/(6π ·(ηw+ηo)/2).

The plot ofΓ⊥(2)versusΓ(1)is shown in Fig.5(a).BothΓ‖(2)andΓ⊥(2)are friction coefficients obtained for the same colloidal monolayer.Unsurprisingly,Γ‖(2)and Γ⊥(2)should be equal to each other,as shown in the inset of Fig.5(a).Thus,we can de fine the friction coefficient obtained from cross-correlated diffusion as Γ(2),where Γ(2)= Γ‖(2)=Γ⊥(2).The characteristic lengths Γ‖and Γ⊥follow Eq.(3)and Eq.(4),respectively,indicating that the HIs are anisotropic in the two orthogonal directions.By combining Eq.(3)and Eq.(4),the relationship between R‖and R⊥can be found to be R‖/a=(R⊥/a)3/2,as shown in Fig.5(c).

Fig.5.(a)CompaComparison between the frictionΓ(1)calculated from D′s(n)and the friction coefficient sΓ‖(,2⊥) ofthethreesamplesS1(blackpentagon),S2(red dot),and S3(purple star)on a log-log plot.The solid dots correspond to Γ‖(2),and the open dots correspond to Γ⊥(2).The cyan line is the guide for the eye,where the slope of the line is 1.0.In the inset,a comparison is shown between the friction coefficients Γ‖(2)and Γ⊥(2)on a log-log plot.The cyan line is the guide for the eye,where the slope of the line is 1.0.(b)The friction coefficient Γ⊥(2 )obtained from R⊥=λsfollows a power-law relationship with the friction coefficient Γ (1)for the three samples.The cyan lines represent fits of the form Γ⊥ (2 )∼(Γ(1))2/3.(c)Relationship between the characteristic lengths R‖and R⊥ scaled by the particle radius a for the three samples on a log-log plot.The green line is the fit to R‖/a=(R⊥/a)3/2.
By the definition of cross-correlated diffusion coefficients,the values of D‖,⊥can be written as D‖,⊥∝ Ds(0)·f(Γ(1),r).Here,the dimensionless factor of f(Γ(1),r)represents the strength of the correlation between two particles in the monolayer.Moreover,D′s(n)can be also written as∝ Ds(0)·g(Γ(1)(n)),since both D′s(n)=kBT/κ(1)ηsand Ds(0)=kBT/κ(0)ηba are proportional to kBT and ηsis a function of ηba.Therefore,the effective diffusion constantsshould be used as the scaling factor for different monolayers.The scaled curves by using Ds(n),as shown in Fig.2 and A2,either just simply overlap without a right order,or apparently diverse(Fig.A1).Only when D′s(n)are used as scaling factor,can the scaled curves be ranked into a general master curve with a correct order(Fig.4)for all independent samples(S1,S2 and S3):the curves for large values of Γ(1)fall on the upper left side,the curves for small values of Γ(1)fall on the bottom right side.
In Figs.2(a)and 2(b),D‖/Ds(n)for sample S1 decays with the distance r as∼1/r in the limit of large r,while D⊥/Ds(n)decays as∼1/r2.These behaviors are the result of the anisotropic HIs in a colloidal monolayer near a liquidliquid interface.In the longitudinal direction,the HIs respond to a 3D shear stress that is similar to that in a 3D bulk liquid,and in the transverse direction,the HIs respond to a 2D compressive stress.[13,26]The propagation of the vertical component of momentum through the interface will be diminished due to the surface tension of the water-oil interface,otherwise the curved interface will cost extra energy.Meanwhile,the horizontal component of the momentum can propagate freely in the system,which results in the quasi-2D HIs of D‖∼1/r and D⊥∼1/r2between the particles in the monolayer near a water-oil interface,rather than the HIs of D‖,⊥∼ 1/r in the 3D bulk liquid.The anisotropyofthe characteristic lengthsR‖and R⊥of a colloidal monolayer near a water-oil interface is also similar to that near a water-air interface.[32]This anisotropic behavior can be explained by analogy to the lubrication force between two solid walls.[32,37]
It is worth noting that the particles also fluctuate in the direction perpendicular to the water-oil interface due to the temperature.The amplitude of fluctuation Δz can be estimated through kBT/2= Δm·g·Δz,with Δm=mparticle-mwater.The value of Δz/z for three samples S1,S2,and S3 are 0.27,0.03,and 0.41,respectively.In principle,the vertical fluctuation of particles Δz will be modi fied by the HIs between the particles among the monolayer.As shown in Figs.4(e)and 4(h),the master curves with different Δz and z are collapsed together directly,which suggests that the effect of vertical fluctuation of particles on HIs between particles are also included in D′s(n)=kBT/κ(1)ηs,since the values of κ(1)and ηsalready involves the effect of z and Δz.
In the system of a water-oil interface,the scaled correlated diffusion coefficients(r′‖,⊥)are independent on the separation z,as seen in Figs.4(g)and 4(h),whilein the water-air system are dependent on the separation z.[32]Comparing these two systems,the signi ficant difference is that the viscosity and mass density of the air can be negligible comparing with oil.HIs contributed by the oil overwhelms small change of HIs resulting from the different locations of colloidal monolayers.In the colloidal monolayer near the waterair interface,the momentum(stress flux)of the monolayer diffuse only into one side of the interface,i.e.,the region of water.The HIs near the water-air interface is sensitive to the thickness of the water film between the monolayer and the interface.In the water-oil system,the momentum(stress flux)of the monolayer diffuse into both sides of the interface,i.e.,the regions of water and oil.Comparing with the influence of the bulk of water and oil,the influence of the thin water film between the monolayer and the water-oil interface can be negligible.The diffusion of the momentum(stress flux)into the whole space causes thateD‖,⊥(r′‖,⊥)in the water-oil system is insensitive to the separation(as shown in Fig.4).
The high viscosity of oil may also cause the curves collapse Fig.2(Sample S1)and Fig.A2(Sample S3),since such collapse was never found in monolayers near a waterair interface.[32]We think the difference of D‖,⊥induced by the change of particle concentrations lie already in Ds(n),but only in the part of D′s(n).Ds(0)is just a constant and independence on n.It is the reason why the rescaling method in Fig.4 works so well for all the situations.
3.Conclusion
In this work,we measured the cross-correlated diffusion in particle monolayers near a water-oil interface.An effective Saffman length of λs∗= κ(1)ηs/6πηbwas de fined for such a colloidal monolayer On the basis of this effective Saffman length,anisotropic characteristic lengths R‖and R⊥were introduced in the longitudinal and transverse directions,respectively.In the longitudinal direction,the characteristic length R‖is equal to λs∗,which re flects the continuous nature of the system.In the transverse direction,the characteristic length R⊥is a function of λs∗and the particle radius a,with the form a(λs∗/a)2/3,which re flects the discrete nature of the system.The anisotropy of the characteristic lengths re flects the fundamental differences in the dynamics of the colloidal monolayer in the two directions.With these two characteristic lengths,the measured curves of the cross-correlated diffusion for three samples at different concentrations collapse to universal master curves.These universal master curves describe the HIs in a particle monolayer near a soft interface.This experimental research provides a general picture of the dynamics of a liquid near an interface.
Appendix A:Supplementary figures
The scaled cross-correlated diffusion coefficients for three samples are shown in the following figures.

Fig.A1.Measured correlated diffusion coefficients D‖/Ds(n)(a)and D⊥/Ds(n)(b)as functions of the distance r/(2a)for sample S2.The concentration ranges from 0.02 to 0.62,and the friction coefficient of the particle monolayer ranges from 0.15 cP·µm to 44.5 cP·µm.The differently colored symbols represent the scaled correlated diffusion coefficients at different friction coefficients.
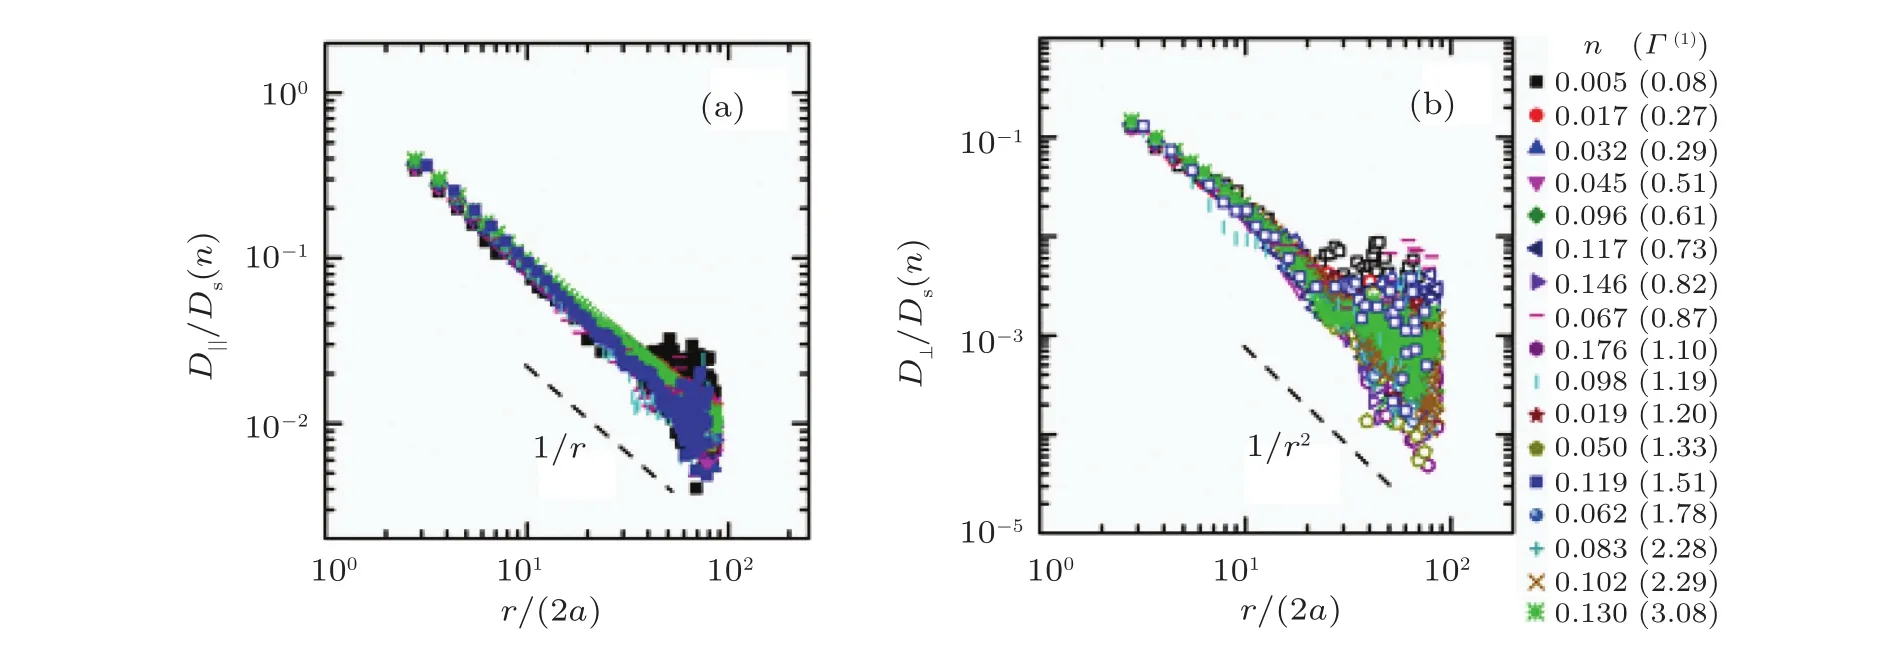
Fig.A2.Measured correlated diffusion coefficients D‖/Ds(n)(a)and D⊥/Ds(n)(b)as functions of the distance r/(2a)for sample S3.The concentration n ranges from 0.005 to 0.18,and the friction coefficient of the particle monolayer ranges from 0.08 cP·µm to 3.08 cP·µm.The differently colored symbols represent the scaled correlated diffusion coefficients at different friction coefficients.
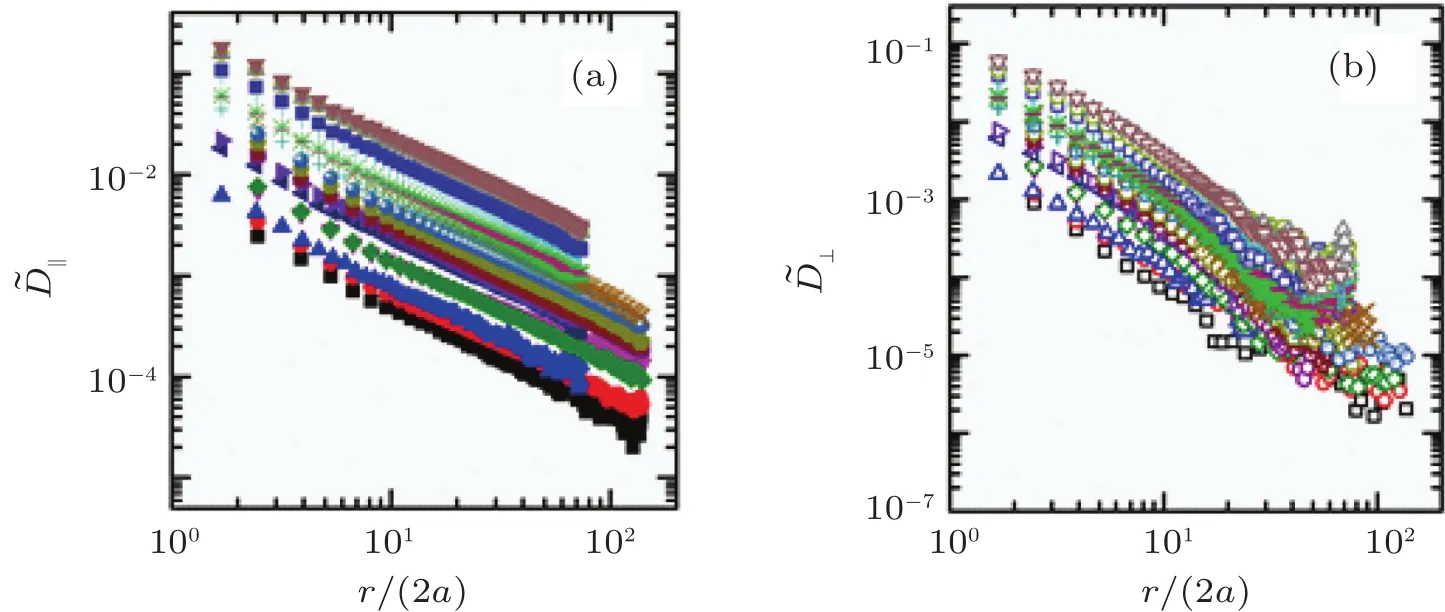
Fig.A3.Scaled correlated diffusion coefficient seD‖(a)andeD⊥(b)as functions of r/(2a)with different friction coefficients for sample S1.The differently colored symbols represent the scaled correlated diffusion coefficients at different friction coefficients.The symbols used in this figure are the same as those in Fig.2.

Fig.A4.Scaled correlated diffusion coefficientsD(a)and(b)as functions of r/(2a)with different friction coefficients for sample S2.The differently colored symbols represent the scaled correlated diffusion coefficients at different friction coefficients.The symbols used in this figure are the same as those in Fig.A1.

Fig.A5.Scaled correlated diffusion coefficients(a)and(b)as functions of r/(2a)with different friction coefficients for sample S3.The differently colored symbols represent the scaled correlated diffusion coefficients at different friction coefficients.The symbols used in this figure are the same as those in Fig.A2.
猜你喜欢
杂志排行

Chinese Physics B的其它文章
- Topological superconductivity in a Bi2Te3/NbSe2heterostructure:A review∗
- The universal characteristic water content of aqueous solutions∗
- Neutral excitation and bulk gap of fractional quantum Hall liquids in disk geometry∗
- Direct deposition of graphene nanowalls on ceramic powders for the fabrication of a ceramic matrix composite∗
- Hard carbons derived from pine nut shells as anode materials for Na-ion batteries∗
- Crystal structures and sign reversal Hall resistivities in iron-based superconductors Lix(C3H10N2)0.32FeSe(0.15<x<0.4)∗