斯里兰卡穹顶区的形成和演变机制分析
2019-05-30王卫强
王卫强
摘要 通过SODA再分析资料和AVISO观测资料研究了斯里兰卡穹顶区(SLD)的迁移和消散机制.斯里兰卡穹顶区是孟加拉湾西南部的一个气旋涡旋,主要出现在西南季风(5—9月)期间,与西南季风海流侵入孟加拉湾同時存在.正风应力旋度引起的Ekman抽吸是形成SLD的主要原因.回归分析结果表明SLD区域的风应力旋度与Ekman抽吸存在较强的正相关(r2=0.93,p>0.5).此外,结果表明SLD在发展过程中的移动主要受正风应力旋度移动的影响,SLD的消减与该正风应力旋度减弱和西传的暖Rossby波有关,而冷Rossby波的传播有益于SLD的发展.在SLD消减时期,孟加拉湾涡旋(BBD)独立发展并进一步与SLD融合,回归分析发现BBD区域的Ekman抽吸与当地风应力旋度的关系密切(r2=0.76,p>0.5),这表明了BBD在形成阶段由局地的风应力主导.9月之后,风应力旋度减弱,BBD和SLD开始了合并过程.动力方面,EKE分析显示SLD衰退的同时,BBD的EKE大幅增加;热力方面,10—11月时,由Ekman抽吸引起的SLD和BBD次表层冷水汇合,清晰地表明了二者之间的热动力学联系.
关键词 斯里兰卡穹顶区;风应力旋度;Ekman抽吸;Rossby波;孟加拉湾涡旋
中图分类号 P444
文献标志码 A
0 引言
斯里兰卡穹顶区(SLD)是孟加拉湾西南部的一个气旋涡旋,主要出现在西南季风(5—9月)期间,和西南季风海流侵入孟加拉湾同时存在.前人研究通过分析气候态海表温度发现,SLD位于斯里兰卡东部,在5月生成,9月开始衰减,盛期出现在7月.对SLD形成与衰退的机制研究表明,在西南季风期间斯里兰卡东部存在一个正的风应力旋度,从而引起局地的Ekman抽吸形成SLD;之后风应力旋度减弱,虽然正的风应力旋度一直持续到12月,但是西传的暖Rossby波会引起穹顶区的下沉从而导致SLD的衰退.另外,在SLD衰减过程中,在斯里兰卡东北部形成一个新的气旋式涡旋,即孟加拉湾涡旋(BBD).有观点认为BBD是SLD气旋式涡旋信号传播导致,而其他的观点认为BBD是独立发展形成的,并与SLD相互影响.本研究试图通过分析简单海洋数据同化再分析2.0.2版本的20年月平均气候态数据,来描述SLD的迁移和消散机制.
本文研究发现,在西南季风期间,斯里兰卡东侧存在较复杂的风应力旋度分布,首先是位于斯里兰卡东侧的正的风应力旋度(SLDPWC),与SLDPWC相关的Ekman抽吸机制对SLD的形成给出了合理的解释,回归分析也表明了SLDPWC和SLD的上升流之间存在着很强的正相关关系(r2=0.93,p >0.5).该气旋式环流与正风应力旋度一起在5月形成,6—8月逐渐增强并向东北方向传播,清楚表明了SLD在形成过程中和正风应力旋度的一致性.关于SLD的衰退机制,由Hovmoller 分析显示,东边界反射的暖Rossby波在8月到达斯里兰卡东海岸,使得SLD减弱;另外,局地正风应力旋度的减弱也是SLD消减的因素之一.
其次,除了SLDPWC之外,SLDPWC北部还有另外2个风应力涡旋(正文图2).正的风应力涡旋位于印度东海岸(东印度正风应力旋涡,EIPWC),在EIPWC和SLDPWC之间存在一个负的风应力旋度(负风应力旋度,NWC).本文研究发现,SLD的衰退与BBD的发展与这3个风应力旋度的变化密切相关.首先,在EIPWC作用下BBD开始发展,回归分析也表明EIPWC和BBD的上升流之间存在着很强的正相关关系(r2=0.76,p >0.5) (正文图9).随着NWC的减弱,正的风应力旋度逐渐统治了孟加拉湾西南部,这也是最终SLD和BBD合并的关键因子,进一步的EKE分析也证实了两者之间的这种动力学联系.除此之外,次表层与SLD和BBD相关的冷中心之间的合并过程,也清晰地表明了二者之间的热动力学联系.
Mechanisms of the Sri Lanka Dome and its evolutionary aspects
K.B.S.S.J EKANAYAKA1 WANG Weiqiang1
1 State Key Laboratory of Tropical Oceanography,South China Sea Institute of Oceanology,
Chinese Academy of Sciences,Guangzhou 510301
AbstractThis study focuses on the formation,migration and dissipation mechanisms of the Sri Lanka Dome (SLD) and its combination with Bay of Bengal Dome (BBD) using Simple Ocean Data Assimilation reanalysis data and AVISO data.The SLD is a cyclonic eddy in the southwest Bay of Bengal,which occurs during May through September coinciding with the intrusion of southwest monsoon current into the Bay of Bengal.The results show that,Ekman pumping due to positive wind stress curl east off Sri Lanka is the governing mechanism of the SLD formation and migration during developing stage.Besides,a positive impact of cold Rossby waves propagation contribute to the SLD developing as well.Further,weakening positive wind stress curl and the eastern boundary reflected warm Rossby wave effect are important factors for dissipation of SLD.During the decaying stage of SLD,the BBD evolves independently because of the Ekman Pumping driven by local positive wind curl.The regression analysis proves that the local wind stress curl has a strong positive relationship with upwelling within the BBD.After September,weak positive wind stress curl dominates in the southwest BOB,the BBD starts to merge with the SLD.There are two kinds of links between SLD and BBD.The first is a dynamic interaction revealed by eddy kinetic energy analysis and the second is a thermodynamic interaction described by combination of subsurface cold cores of the SLD and the BBD.
Key wordsSri Lanka Dome;wind stress curl;Ekman Pumping;Rossby;Bay of Bengal Dome
0 Introduction
Due to the transition pattern of the Inter-Tropical Convergence Zone (ITCZ) over the Bay of Bengal (BoB) region,there are two annually reversing monsoon currents,which can be observed as Northeast Monsoon Current (NMC) and Southwest Monsoon Current (SMC),driven by Northeast Monsoon (NEM) winds (December to April) and Southwest Monsoon (SWM) winds (May to September) respectively (Vos et al.[1]).The Sri Lanka Dome (SLD) circulation occurs during the SWM period coinciding with the intrusion of SMC eastward flow into BoB,which is one of the most important mesoscale cyclonic circulation in the Bay of Bengal.
After passing the Sri Lankan island,part of the SMC curves around its southeastern boundary and intrude into the BoB,while the rest of SMC flow continues eastward.A part of this aforementioned BoB intrusion flows along a cyclonic path near the east coast of Sri Lanka and contributes to the SLD formation (Vinayachandran and Yamagata[2];Vinayachandran et al.[3];Schott and McCreary[4]).As a result,the western flank southward coastal current of the SLD flows against the prevailing local winds along off eastern coast of Sri Lanka (Shetye et al.[5]).The southernand eastern flanks of the SLD are closed by eastward SMC flow andBoB intrusion of SMC respectively (Vinayachandran and Yamagata[2]).
From the climatological sea surface temperature analysis,Vinayachandran and Yamagata[2] mentioned that,the SLD starts from May and decays in September.Further,they noticed the well-developed stage of the SLD is occurring in east of Sri Lanka during July.McCreary et al.[6],Vinayachandran and Yamagata[2] and Burns et al.[7] demonstrated a positive wind stress curl occurs in the east of Sri Lanka and generates an Ekman upwelling in this region during SWM.Furthermore,Vos et al.[1] ran an idealized model to examine the hypothesis that,the SLD is formed through the interaction between the SMC and the topography (Island Wake effect).They concluded that the island wake effect is a supportive mechanism for the SLD formation.
Although wind stress curl near the east coast of Sri Lanka remains positive until December,the arrival of warm Rossby waves propagating from the east,results in decay of the SLD due to the downwelling effect (Vinayachandran and Yamagata[2];Burns et al.[7]).Vinayachandran and Yamagata[2] reported that,these warm Rossby waves originate from the eastern boundary of BoB during April-June and reach the east coast of Sri Lanka during September.In addition to the negative impact of warm Rossby waves,Burns et al.[7] mentioned the northern BoB low salinity water invasion is also a factor for the SLD dissipation.During the decay stage of SLD,another cyclonic eddy was observed,which located northeastward to Sri Lanka named as Bay of Bengal Dome (BBD).McCreary et al.[6] showed that,the SLD cyclonic ocean circulation gradually migrates to northward during the ending of SWM and becomes the BBD.As opposed to the above evidence,Vinayachandran and Yamagata[2] showed that,the BBD independently evolves during September and devoid of further dynamic interaction with SLD.
All aforementioned studies have well addressed the formation of the SLD,but their focus deprived of explanation about the migration of the SLD throughout the whole evolution.The current study focuses on the formation and migration of the SLD and its relevant mechanisms.Furthermore,the decay stage of the SLD seems bit controversial owing to the several demonstrations given by previous studies.The present study will attempt to explain the decay stage of the SLD and its related interaction with BBD.
1 Data and ethodology
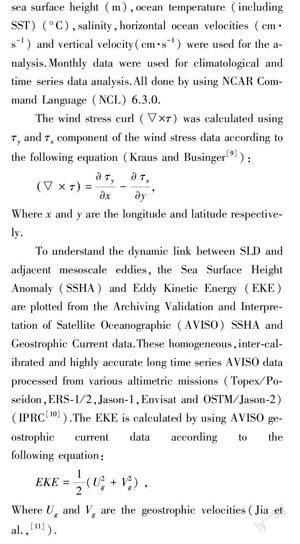
The Simple Ocean Data Assimilation reanalysis version 2.0.2. is used in this study.This ocean model is based on Parallel Ocean Program physics with an average 0.25°×0.4°×40-level resolution.Observations include virtually all available ocean station data,moored temperature,hydrographic profile data and salinity time series,surface temperature and salinity observations of various types,and nighttime infrared satellite SST data.The processed data are in a monthly-composites form and they were mapped onto a uniform 0.5°×0.5°×40-level grid (Carton and Giese[8]). wind stress (N/m2),sea surface height (m),ocean temperature (including SST) (°C),salinity,horizontal ocean velocities (cm·s-1) and vertical velocity(cm·s-1) were used for the analysis.Monthly data were used for climatological and time series data analysis.All done by using NCAR Command Language (NCL) 6.3.0.
The wind stress curl (×τ) was calculated using τy and τx component of the wind stress data according to the following equation (Kraus and Businger[9]):
Where x and y are the longitude and latitude respectively.
To understand the dynamic link between SLD and adjacent mesoscale eddies,the Sea Surface Height Anomaly (SSHA) and Eddy Kinetic Energy (EKE) are plotted from the Archiving Validation and Interpretation of Satellite Oceanographic (AVISO) SSHA and Geostrophic Current data.These homogeneous,inter-calibrated and highly accurate long time series AVISO data processed from various altimetric missions (Topex/Poseidon,ERS-1/2,Jason-1,Envisat and OSTM/Jason-2)(IPRC[10]).The EKE is calculated by using AVISO geostrophic current data according to the following equation:
Where Ug and Vg are the geostrophic velocities(Jia et al.,[11]).
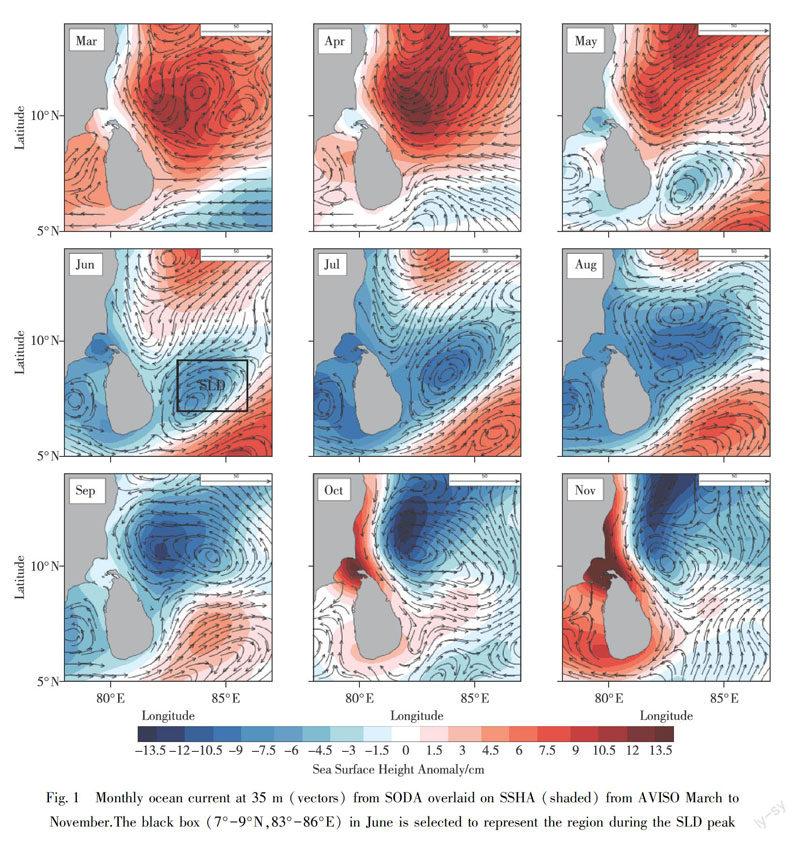
Fig.1 Monthly ocean current at 35 m (vectors) from SODA overlaid on SSHA (shaded) from AVISO March to
November.The black box (7°-9°N,83°-86°E) in June is selected to represent the region during the SLD peak
2 Results
As a cyclonic eddy,SLD can be distinguished with the negative SSHA due to its divergent upwelling formation.In this study,the occurrence of the cyclonic ocean circulation is studied with climatological ocean current data at 35 m overlaid with the SSHA data.The SSHA data show positive values east of Sri Lanka until May due to the anticyclonic ocean circulation (Fig.1).In May,there is a small negative circular SSHA patch and corresponding cyclonic ocean circulation,which appears first with -2 to -4 cm SSHA near the southeastern coast of Sri Lanka.From June to August,negative SSHA patch develop and become stronger more than -10 cm.In particular,it gradually move northeastward and results in the decay of SLD.During September, the SLD is vanished.Instead,a widened negative SSHA core can be seen between 10°N and 13°N resulting in the formation of BBD near the northeast coast of Sri Lanka.
2.1 Developing stage of the Sri Lanka Dome
Previous studies described the Ekman pumping as the major factor for the formation of SLD (McCreary et al.[6];Vinayachandran and Yamagata[2];Burns et al.[7]).They showed occurrence of positive wind stress curl generating the SLD.Although,the impact of this positive wind stress curl on the SLD migration is yet to be analyzed.
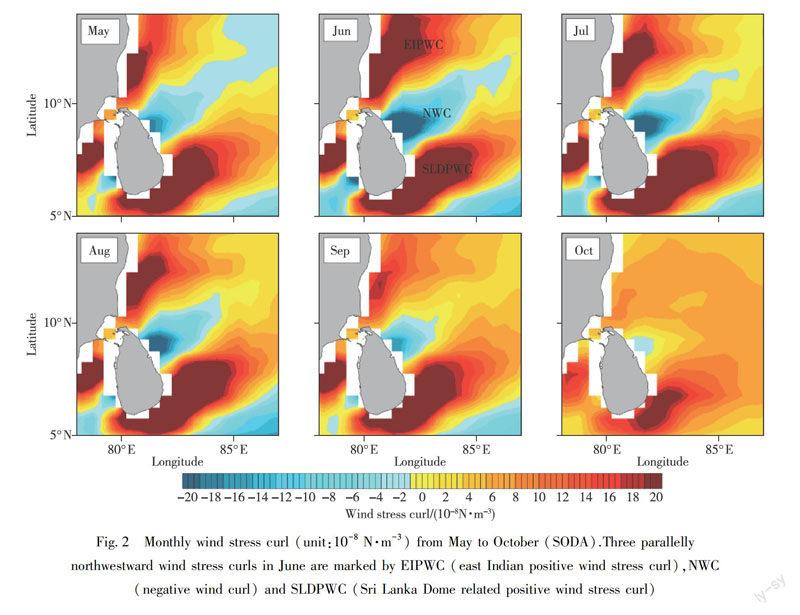
Fig.2 Monthly wind stress curl (unit:10-8 N·m-3) from May to October (SODA).Three parallelly
northwestward wind stress curls in June are marked by EIPWC (east Indian positive wind stress curl),NWC
(negative wind curl) and SLDPWC (Sri Lanka Dome related positive wind stress curl)
First,in resemblance with previous studies,Figure 2 also captured the strong positive wind stress curl,which can be observed during the boreal summer in the east part of Sri Lanka,with the evolution of the SLD.The patch of positive wind curl develops from the southern coast of Sri Lanka during May with a distinctive northeastward projection.From May to August,this strong positive wind stress curl gradually strengthens and further extends its projection northeastward till August (hereafter this Sri Lanka Dome related positive wind stress curl will be mentioned as SLDPWC).In the same manner,the SLD migrates northeastward via expanding its periphery from the monthly ocean current and SSHA in Figure 1.
Further,to understand the relationship between local wind stress curl and SLD,a detailed analysis of wind stress curl is carried out over the region of 7°-9°N and 83°-86°E,which is indicated as SLD region in Jun in Figure 1.The results illustrate that,the well-developed wind stress curl over the SLD region develops from May,strengthens till August,and decay after August (Fig.3).At the same time,vertical velocity at 35 m over the SLD region shows similar variations with the wind stress curl,indicating that positive wind curl induced Ekman upwelling in the SLD region is dominant.Correspondingly,the patch of positive wind stress curl gradually retract to the southern coast of Sri Lanka at the end of SWM in October (Fig.2).Afterward,the SLD cyclonic ocean circulation deflects northwestward and merge with BBD (Fig.1).
In addition to the SLDPWC,there are two other wind stress curls located northward to the SLDPWC,which run parallelly northeastward during boreal summer (Fig.2).The positive wind stress curl located near east coast of India (hereafter mentioned as east Indian positive wind stress curl,EIPWC).The other is a negative one,which can be seen between the SLDPWC and EIPWC (hereafter mentioned as NWC).This NWC results in the northeast coastal current of Sri Lanka flowing northward and separating from the southward western flank flow of the SLD (Fig.1).After August,this northward flow gradually decays with the weakening of this NWC.
2.2 Dissipation of the Sri Lanka Dome
Although the positive wind stress curl is still remaining in east of Sri Lanka in September,SLD starts to decay (Vinayachandran and Yamagata[2];Burns et al.[7]),in which the warm Rossby wave is a major factor contributing to the dissipation of the SLD.In detail,the eastward travelling equatorial Kelvin waves,generated by zonally oscillated seasonal equatorial winds,result in the generation of upwelling (cold) and downwelling (warm) Rossby waves after hitting on the eastern boundary of the BoB (Wyrtki[15];Rao et al.[16];Sreenivas et al.[17]).As a result,the warm Rossby waves start in April and reach the east coast of Sri Lanka after September (Vinayachandran and Yamagata[2];Burns et al.[7]),in this study,the downwelling Rossby waves,which start during March and reach the east coast of Sri Lanka during August.In addition to the warm Rossby wave effect,the SLDPWC weakening is also an important factor for dissipation of SLD.
Fig.4 Time-longitude diagrams of climatological average,meridional velocity over the region of
7°N to 8°N (left) and zonal velocity over the region of 8°N to 9°N (right)〖TS)〗
Moreover,the impact of remote forcing Rossby wave signals on the SLD is studied using Hovmoller plots of the zonal velocity and the meridional velocity in this study (Fig.4).Here,meridional velocity over zonal belt of 7°N to 8°N and zonal velocity over zonal belt of 8°N to 9°N are selected,since these two zonal belts cover western and northern flank of SLD.The warm Rossby waves,depicted by meridional and zonal velocity in Figure 4,start from the east during March and gradually reach the east coast of Sri Lanka during August.The downwelling Rossby signals favor strengthening the northward currents and eastward currents.Thus arrival of this warm meridional velocity Rossby signals result in weakening southward western flank flow of SLD and weakening westward northern flank flow of SLD during August (Fig.4).As a result,the anticyclonic ocean circulation and corresponding downwelling condition start to develop in this region.In addition,as a supportive mechanism to SLD development,it also can be seen from upwelling Rossby waves propagation (Fig.4),which start from January and reach the east coast of Sri Lanka during April through July.It results in strengthen the westward northern flank flow of SLD and the SLD cyclonic circulation.
In addition to the warm Rossby waves,weakening of the positive wind stress curl is also an important factor for SLD dissipation.Figure 2 and Figure 3 clearly that,the positive wind stress curl,directly forcing SLD,gradually decays after August.Correspondingly,the upwelling of SLD also gradually weakens according to vertical velocity variation shown in Figure 3 because of the strong positive relationship between local directly forcing wind stress curl and SLD.Therefore,the combined effect of the weakening of local positive wind stress curl and the arrival of warm Rossby waves results in decaying of the SLD after August.
2.3 SLD and BBD
After August,the SLD moves to northeastward and merges with BBD.So far,the interaction between SLD and BBD is still controversial due to two different viewpoints.First,McCreary et al.[6] showed that,the SLD cyclonic ocean circulation gradually migrates northward during the ending of SWM and becomes the BBD during which the dynamic link between SLD and BBD is not described.As opposed to the above illustration,Vinayachandran and Yamagata[2] showed that,the BBD independently evolves from the SLD during September and devoid of further dynamic interaction with the SLD.
In contrast,the present study shows that,the BBD evolves independently initiated by Ekman pumping resulted from local positive wind stress curl and subsequently merges with the SLD accompany with shrinkage of negative wind stress curl sandwiched between two positive wind curl.Correspondingly,the subsurface temperature clearly shows evolvement of the BBD and combination of the BBD and the SLD (Fig.5c).As a result,the upwelled cold water masses of the SLD and the BBD merge to be a large cold water gyre in northeast of Sri Lanka.Vinayachandran and Yamagata[2] also stated that,the lateral convergence is the largest contributor for the heat changes in the BBD during the formation stage.It indicates that the cold water mass of decaying SLD plays an important role in the thermodynamics of BBD.Therefore,the present study proves both dynamic and thermodynamic links between the SLD and the BBD,further investigate in detail below.
As mentioned above,the BBD evolves independently in the formation stage.Moreover,the Ocean currents and SSHA in Figure 5b indicate that,the formation of the BBD also to westward projection of the SLD during September.This BBD formation occurs in northeast of Sri Lanka simultaneous the eastward propagation of the EIPWC (Figs.5a and 5b).A regression analysis is carried out for the Bay of Bengal Dome box (black square marked in Figure 5b) (10°-13°N,81°-83°E) to understand the relationship between local wind stress curl and the BBD formation (Fig.6).The results reveal that,the local wind stress curl has a strong positive relationship with the upwelling of the BBD (r2:0.76,p>0.5),which means the BBD forms as a result of the EIPWC driven Ekman Pumping.In order to confirm this independent evolution of the BBD,a detailed analysis of EKE is carried out from June to December (Fig.7).Since the analysis on EKE variations during the SLD decaying,for convenience,a new Sri Lanka Dome box (8°-12°N,83°-87°E) (red square in Figure 5b) is defined,which is different from the region during the SLD peak (Fig.1).The Figure 7 illustrates that,the EKE of SLD box gradually decreases after June,while the EKE of the BBD box gradually increases until November.Most importantly,a considerably higher value of EKE (~120 cm2·s-1) can be seen from the BBD box prior to the SLD interaction with the BBD during August confirms the BBD circulation starts to occur independently from the SLD.
Fig.5 Monthly climatological characteristics,(a) wind stress curl,(b) ocean current vectors (35 m depth) overlaid
on SSHA (shaded),and (c) temperature at 35 m depth from September to October.Red square is for the SLD box
Fig.6 Relationship between monthly wind stress curl and
monthly 35 m depth velocity (cm·s-1) in
BBD box (10°-13°N,81°-83°E) (SODA,1988-2008),
with black line for linear regression
With the degradation of the NWC,the positive wind stress curl dominates over southwest of the BoB and favors the combination of the weakening SLD and the newly formed BBD (Figs.5a and 5b).The spatial temperature distributions and ocean currents clearly indicate the merging of these two separate during October (Figs.5b and 5c).Furthermore,the EKE of the BBD,which remains constant (-120 cm2·s-1) during August to October,suddenly increases to the maximum level (-160 cm2·s-1) in November,whereas the EKE of the SLD gets the lowest (-10 cm2·s-1)(Fig.7).These two simultaneous EKE variations are associated with the SLD completion and the BBD peak in November,for which the SLD is decaying in November and afterward the major part of the SLD EKE moves to the BBD and favor BBD (Fig.5b).It clearly shows that,the upwelled cold water masses of these two eddies merge owing to the interaction of their two cyclonic ocean circulations (Fig.5c).This cold water masses interaction further reveals the thermodynamic link between the SLD and the BBD relevant to their dynamic interaction.Eventually,the merging of the SLD and the BBD creates a large cold water gyre in southwest of the BoB.
Fig.7 Monthly variation of the Eddy Kinetic Energy
(EKE) of the Sri Lanka Dome box (red square in Fig.5b)
(red color) and the Bay of Bengal Dome box (black
square in Fig.5b) (blue color) from June to December based
on monthly composites of AVISO data during 1993-2008
3 Discussions and Conclusions
As studied above,the SLDPWC related Ekman Pumping mechanism offers a reasonable explanation for the formation of the SLD.The regression analysis proves that,there is a strong positive relationship between the SLDPWC and the upwelling of the SLD (r2:0.93,p>0.5) (Fig.3).The cyclonic circulation,which starts from May,gradually strengthens during June to August and moves northeast accompany with northeast propagation of the SLDPWC.The present study clearly demonstrates the consistency between the SLD migration and positive wind stress curl propagation during SLD evolution.Further,Ekman upwelling of SLD results in the upward movement of subsurface high salinity cold water east of Sri Lanka during boreal summer.
The role of eastern boundary reflected Rossby wave is importantin the SLD evolution.Cold Rossby waves propagation,observed in time-longitude diagrams of zonal velocity,favors the SLD developing.Similarly,the reflected warm Rossby waves reach the east coast of Sri Lanka during August and play a major role in dissipation of the SLD (Fig.4).In addition,the present study shows that,the weakening of SLDPWC is also an important factor for the dissipation mechanism because of the strong positive relationship between SLDPWC and the SLD.
In addition to the SLDPWC,there are two other wind stress curls located northward to the SLDPWC,which run parallelly northeastward during boreal summer (Fig.2).One is the positive wind stress curl located near east coast of India (EIPWC),and the other is a negative wind curl (NWC) which can be seen between the related wind curl and EIPWC.The present study shows that,evolution of the SLD and the BBD are closely related to variations of these three wind curls.Regarding to the BBD,it first evolves independently from the SLD due to the EIPWC driven Ekman Pumping,for which the regression analysis confirms that the EIPWC has a strong positive relationship with the upwelling of the BBD (r2:0.76,p>0.5) (Fig.6).Although these three wind curls weaken after September,the BBD develops and peaks accompany with disappearance of NWC.As a result,weak positive wind curl is dominant over southwest of BoB in November,which favors combination of SLD and BBD.As a dynamic interaction,the EKE transfers to the BBD when SLD decaying (Fig.3).Simultaneous,also as a thermodynamic interaction,the upwelled cold water mass of the SLD and the BBD merge revealed by subsurface temperature variations (Fig.5c).It illustrates the close relationship between the SLD and the BBD,for which they have not only a thermodynamic interaction,but also a dynamic interaction.
Acknowledgement
We would like toexpress our special gratitude to China-Sri Lanka Joint Center for Education and Research,Chinese Academy of Sciences and University of Ruhuna (Sri Lanka) for their guidance and the administrative support.This study was funded by the Strategic Priority Research Program of Chinese Academy of Sciences under contract No.XDA20060502;the National Natural Science Foundation of China under contract Nos.41676013,41521005,41731173;the National Key Research and Development Program of China under contract No.2016YFC1401401;the Independent Research Project Program of State Key Laboratory of Tropical Oceanography under contract No.LTOZZ1702;and the CAS/SAFEA International Partnership Program for Creative Research Teams.Further we would like to extend our gratitude to NCAR,as all the plots that are included in this paper are created by using NCAR Command Language (NCL).
References
[1] De Vos A,Pattiaratchi C B,Wijeratne E M S.Surface circulation and upwelling patterns around Sri Lanka[J].Biogeosciences,2014,11(20):5909-5930
[2] Vinayachandran P N,Yamagata T.Monsoon response of the sea around Sri Lanka:generation of thermal domes and anticyclonic vortices[J].J Phys Oceanogr,1998,28(10):1946-1960
[3] Vinayachandran P N,Masumoto Y,Mikawa T,et al.Intrusion of the Southwest Monsoon Current into the Bay of Bengal[J].J Geophys Res-Oceans,1999,1041(C5):11077-11085
[4] Schott F A,McCreary Jr J P.The monsoon circulation of the Indian Ocean[J].Prog Oceanogr,2001,51(1):1-123
[5] Shetye S R,Shenoi S S C,Gouveia A D,et al.Wind-driven coastal upwelling along the western boundary of the Bay of Bengal during the southwest monsoon[J].Cont Shelf Res,1991,11(11):1397-1408
[6] McCreary Jr J P,Han W,Shankar D,et al.Dynamics of the East India Coastal Current 2.Numerical solutions[J].J Geophys Res,1996,101(C6):13993-14010
[7] Burns J M,Subrahmanyam B,Murty V S N.On the dynamics of the Sri Lanka Dome in the Bay of Bengal[J].J Geophys Res-Oceans,2017,122(9):7737-7750
[8] Carton J A,Giese B S.A reanalysis of ocean climate using simple ocean data assimilation (SODA)[J].Mon Weather Rev,2008,136(8):2999-3017
[9] Kraus E B,Businger J A.Atmosphere-ocean interaction[M].London:Oxford University Press,1994:362
[10] Asia-Pacific Data-Research Center of the IPRC.AVISO maps of sea level anomalies & geostrophic velocity anomalies (MSLA)[EB/OL].[2018-01-26].http://apdrc.soest.hawaii.edu/datadoc/aviso_upd_msla_mon.php
[11] Jia F,Wu L X,Qiu B.Seasonal modulation of eddy kinetic energy and its formation mechanism in the Southeast Indian Ocean[J].J Phys Oceanogr,2011,41(4):657-665
[12] Vinayachandran P N,Chauhan P,Mohan M,et al.Biological response of the sea around Sri Lanka to summer monsoon[J].Geophys Res Lett,2004,31(1):1-4
[13] Jensen T G.Arabian Sea and Bay of Bengal exchange of salt and tracers in an ocean model[J].Geophys Res Lett,2001,28(20):3967-3970
[14] Wilson E A,Riser S C.An assessment of the seasonal salinity budget for the upper Bay of Bengal[J].J Phys Oceanogr,2016,46(5):1361-1376
[15] Wyrtki K.An equatorial jet in the Indian Ocean[J].Science,1973,181(4096):262-264
[16] Rao R R,Kumar M S G,Ravichandran M,et al.Interannual variability of Kelvin wave propagation in the wave guides of the equatorial Indian Ocean,the coastal Bay of Bengal and the southeastern Arabian Sea during 1993-2006[J].Deep Sea Res Pt I,2009,57(1):1-13
[17] Sreenivas P,Gnanaseelan C,Prasad K V S R.Influence of El Nio and Indian Ocean Dipole on sea level variability in the Bay of Bengal[J].Global Planet Change,2011,80-81:215-225