Effect of vacuum gas oil hydrotreating reactor on multiple reactors and hydrogen network☆
2019-02-09DonghuiYingjiaWangLingjunHuangDiZhangGuilianLiuWeiLiPengWang
Donghui Lü ,Yingjia Wang ,Lingjun Huang,Di Zhang,Guilian Liu, *,Wei Li,Peng Wang
1 School of Chemical Engineering and Technology,Xi'an Jiaotong University,Xi'an 710049,China
2 Hohhot Branch of PetroChina Pipeline Company,PetroChina,Hohhot 010000,China
Keywords:VGO hydrotreating Reactors Temperature Hydrogen consumption
ABSTRACT The inlet temperature of the Vacuum Gas Oil(VGO)hydrotreating reactor of a refinery is analyzed with the integration of multiple series reactors and hydrogen network considered.The effect of the inlet temperature(T1)on hydrogen sinks/sources and the product output is analyzed systematically based on the simulation of the series reactors,including VGO hydrotreating reactor,hydrocracking reactor,fluid catalytic cracking reactor and visbreaking reactor.The general relation between the Hydrogen Utility Adjustment(HUA)and multiple pairs of varying sinks and sources is deduced,and correlations between varying streams and T1are linearly fitted.Based on this,the quantitative equation between HUA and T1is derived,and corresponding diagram is constructed.The T1corresponding the minimum hydrogen consumption is identified to be 345°C.
1.Introduction
In petroleum refinery,hydrogen addition technologies are widely used to reduce the contents of sulfur,nitrogen,metals and asphaltenes,increase the hydrogen to carbon(H/C)ratio of products.Some of these processes are carried out in series and connected with each other through product/feed streams.Reactor is the heart of each process,and its design and operation affect that of downstream ones.
The application of hydrotreating technologies results in the significant increment of hydrogen consumption.Furthermore,hydrotreating reactor is generally operated with excess hydrogen,and unreacted hydrogen is recycled or reused by the reactors of some other processes.The reuse of hydrogen strengthens the interconnection and interaction among refinery processes.Maximizing the hydrogen reuse and reducing the fresh hydrogen consumption can be achieved through integrating the hydrogen network.However,the hydrogen sink and/or hydrogen source changes along the operating parameters of a hydrotreating reactor,as well as the optimal match between these streams and the minimum fresh hydrogen consumption.Therefore,a thorough understanding of the interaction between the reactors of processes connected in series and the hydrogen network is of vital importance for the optimization of hydrogen network and reactor operation.
Different models have been developed to optimize reactors used in the refinery.Based on the lumped first-principle reactor model and empirical fractionation model,a cascaded model predictive control(MPC)structure is developed to optimize the hydrocracking reactor and fractionation column[1].For continuous catalytic regenerative naphtha process,a thermally coupled reactor is proposed to boost the aromatics and hydrogen productions[2].In this configuration,a catalyst deactivation model is developed and used to predict the behavior of reactions.Besides,a dynamic process model is developed for real-time optimization and control of existing plants[3].Later,a cascaded model is proposed for the optimization of an industrial diesel hydroprocessing plant[4].A molecule-based kinetic model is proposed to simulate industrial naphtha hydrotreators and predict the product composition,temperature rise and pressure drop in the catalyst bed[5].With the complex hydrodynamics of the reactor-regenerator system taken into account,a mathematical model is developed for FCC process[6]for identifying the optimal operating parameters.With the radial flow and the hydrodealkylation of toluene coupled,a catalyst regeneration naphtha reforming process is proposed to prevent energy loss and enhance aromatics and hydrogen yields[7].However,no research studied the interaction among reactors of the processes connected in series.
As for the hydrogen network of refinery,a lot of research has been done,and great progress has been achieved.Alves and Towler[8]proposed the hydrogen surplus method for targeting the minimum fresh hydrogen consumption of the hydrogen network.To avoid the iterative plotting of hydrogen surplus diagram and increase the efficiency of targeting pinch point,the impurity-based composite-curve method[9],the gas cascade analysis method[10]and the tabular approach[11]are developed,respectively.For a hydrogen network with the reactors given,the minimum fresh hydrogen consumption and pinch can be targeted by these methods,and can be used to guide the match between sinks and sources.
Purification is generally used to increase the hydrogen reuse further,and can be optimized based on the integration of the hydrogen network.Ng and Foo[12]formulated a non-linear programming(NLP)model for automatically targeting the property-based network with process modification.Zhang et al.[13]proposed a graphical method to identify the minimum hydrogen utility,purification parameters and the pinch.With the traditional pinch method and mathematical programming method combined,Liao et al.[14]established a simplified mathematical model to optimize the hydrogen network,and extended it to the system with purification[15,16].Ng et al.developed an optimization-based automated targeting technique for single-impurity resource conservation networks with direct material reuse/recycle[17]and with wasteinterception(regeneration)placement[18].Its major advantage is its flexibility in setting the objective function.Deng et al.[19]used improved problem table to optimize the direct reuse hydrogen network and purification.Liu et al.[20]deduced the quantitative relation between hydrogen utility adjustment(HUA)and purification,analyzed the pinch location of the hydrogen network with purification[21],and proposed a graphical method to identify the pinch and limiting purification parameters.Later,this method is extended to identify the variation of HUA along the purification feed flowrate[22],purification feed and purified product purity[23],purification yield[24],respectively.Dai et al.[25]extended this method to identify the variation of maximum HUA and two optimal purification parameters.Considering the variation of coupling source and sink,Mao et al.[26]proposed a conception method for optimizing the reactor parameters.Later,this method is extended to optimize the residence time of the hydrogen consuming reactor[27]and the simultaneous optimization of purification and hydrogen-consuming reactor parameters[28].However,only single reactor is considered in these methods;the interaction among reactors connected in series is left out of consideration.
Besides,mathematical optimization methods are applied to optimize the hydrogen network.Wei et al.[29]extended the mixing potential concept to the hydrogen networks with multiple impurity,and proposed the model to identify the network with greater disturbance resistance ability.Lou et al.[30]presented a new method to design hydrogen networks with multiple contaminants and minimize the thermodynamic irreversibility of the satisfying process.Umana et al.[31]presented an integrated design approach with the correlations for sulfur prediction in liquid products modified and adopted to predict the hydrogen consumption of hydrotreaters.Lou et al.[32]introduced a robust method to optimize the hydrogen network under uncertainty and identify the less sensitive distribution network.Jhaveri et al.[33]developed a non-linear programming(NLP)model to optimize hydrogen distribution with new compressor and PSA incorporated.Birjandi et al.[34]presented the mixed integer non-linear programming(MINLP)and NLP problems for the optimization of hydrogen network.Umana et al.[35]evaluated the holistic interactions between hydrogen consumers and the hydrogen distribution-system.Considering the variation of suction and discharge pressures,Mahmoud et al.[36]proposed a new linearization method to optimize the hydrogen network,as well as the power of compressor.For the optimization of multiperiod hydrogen network,Liang et al.[37]proposed a subperiod partitioning method based on the dustering of uncertain operating parameters.Birjandi et al.[38]described a shortcut model to target the optimal operation of hydrogen consumers and hydrogen network design.
Although some methods mentioned above considered the integration between hydrogen network and reactors,no method considered the interaction among hydrogen consuming reactors based on their rigorous model.In this work,the effect of vacuum gas oil(VGO)hydrotreating reactor of a refinery is analyzed based on the integration of multiple series reactors and hydrogen network.The relation between the reactor temperature and hydrogen streams is first identified based on the rigorous simulation of multiple series reactors.Then,diagram is plotted to illustrate the variation of the hydrogen consumption along the temperature of VGO hydrotreating reactor.Based on this,the effect of the VGO hydrotreating reactor on the hydrogen consumption is analyzed,and the temperature corresponding the minimum fresh hydrogen consumption is identified.
2.Series Reactors and Hydrogen Network
2.1.Flowsheet of the studied refinery and multiple series reactors
In a refinery,raw material oil is processed through different units to improve product quality,and these units are connected in series.The scheme of a fuel oil refinery is shown in Fig.1.Crude oil is separated by the atmospheric distillation column and vacuum distillation column into naphtha,diesel kerosene and vacuum gas oil etc.Then,these streams are inlet into the naphtha hydrotreating,kerosene hydrotreating,diesel hydrotreating and vacuum gas oil hydrotreating(VGOHT)units,respectively,and are refined into different products.The refined wax oil is processed in the fluid catalytic cracking unit,and catalytic gasoline,catalytic diesel and bottom catalytic slurry are produced.The vacuum residue at the bottom of vacuum distillation column is sent to the visbreaker unit and processed into fuel gas,lowviscosity naphtha,low-viscosity diesel oil and low-viscosity fuel oil.Finally,catalytic slurry and low-viscosity diesel are further processed in the hydrocracking unit to obtain light gasoline,diesel and other product oil.

Fig.1.Scheme of a fuel oil refinery.ADU—Atmospheric Distillation Unit,VDU—Vacuum Distillation Unit,NHT—Naphtha Hydrotreating,KHT—Kerosene Hydrotreating,DHT—Diesel Hydrotreating,VGOHT—Vacuum Gas Oil Hydrotreating,CCR—Continuous Catalytic Reforming,FCCU—Fluid Catalytic Cracking Unit.
In each unit(exclude atmospheric distillation unit and vacuum distillation unit)shown in Fig.1,there are reactors,separators and heat exchangers.With the other equipment of these refining units taken unchanged and ignored,the reactors can be taken as connected in series,and the equipment and streams between them can be simplified as pseudo streams.Based on this,the units connected in series can be simplified into key reactors connected by these pseudo streams,and are referred to multiple series reactors.
Among these units,the fluid catalytic cracking unit,visbreaking unit,the VGO hydrotreating unit and hydrocracking unit are connected and can be analyzed together.Both VGO hydrotreating and hydrocracking units consume hydrogen to improve their product quality.The VGO hydrotreating and hydrocracking reactors are a pair of series reactors,and their operating parameters affect not only the product quality and yield,but also hydrogen sinks and sources.The feed of the hydrocracking unit includes the catalytic slurry and low-viscosity diesel.The former is produced in the fluid catalytic cracking unit,while the latter is from the visbreaking unit.Furthermore,the feed of the fluid catalytic cracking unit,wax oil,comes from the VGO hydrotreating unit.Hence,the fluid catalytic cracking reactor,visbreaking reactor,VGO hydrotreating reactor and hydrocracking reactor can be taken as series reactors.
Among these four reactors,the VGO hydrotreating reactor has the greatest influence on the hydrogen sinks and sources,as its operating parameters affect not only its hydrogen consumption,but also that of the hydrocracking reactor.Hence,the effect of the VGO hydrotreating reactor will be investigated.
2.2.Data of series reactors and hydrogen network
With the operating parameters of the catalytic cracking,visbreaking and hydrocracking units set as constant,the hydrogen feed and product of the VGO hydrotreating and hydrocracking reactors will change along the operating parameters of the VGO hydrotreating reactor.Petro-SIM software[39]is used to simulate these four units and the simplified flowsheet is shown in the Fig.2.
In the hydrogen network of this refinery,there are 36 hydrogen sources(SR)and 14 hydrogen sinks(SK);their flowrates and concentrations are listed in Tables 1 and 2,respectively;the connections from sources to units are shown in the Fig.3.SR1with the concentration of 99.60%is the utility,and its flowrate depends the requirement of the hydrogen network.
For the VGO hydrotreating reactor,its inlet temperature,inlet pressure and the space velocity are 350°C,8.749 MPa and 0.8286 h-1,respectively.At this operating condition,the hydrogen sources and sinks composite curves are shown in Fig.4.The concentration of the pinch is 50%,and the target of the minimum hydrogen utility consumption is 43548.26 m3·h-1,2.92%less than the original hydrogen utility consumption(44856.03 m3·h-1).
In the hydrogen purity versus flowrate diagram,there are 14 sinktie-lines.The hydrogen sinks connected by them and the hydrogen sources that might intersect them are listed in Table 3.
2.3.Variation of hydrogen sinks and sources
Two hydrogen sinks and three hydrogen sources are related with the studied series reactors,as shown in Fig.2.SK13represents the hydrogen demand of the VGO hydrotreating reactor,while SK14is that of the hydrocracking reactor.SR34and SR35are separated from the effluent of VGO hydrotreating reactor and SR36is separated from that of the hydrocracking reactor.
With these four reactors simulated at different inlet temperatures of the VGO hydrotreating reactor(T1),the simulation results are listed in Table 4.It can be seen that the flowrate of SK13increases significantly along T1,while that of SK14decreases slightly.The reason is that,the conversion of the VGO hydrotreating reaction increases along T1,as well as the hydrogen consumption.In addition,two factors affect the flowrate of SK14.One is that the feedstock of the hydrocracking reactor decreases and causes the flowrate of SK14decreases;the other is the space velocity of the hydrocracking reactor decreases and results in the flowrate of SK14increases.The general effect is that the flowrate of SK14decreases slightly along T1.In the simulation,the concentrations of both sinks are kept to be unchanged.The variations of three hydrogen sources along T1are shown in Table 5.It can be seen that the flowrates of SR34and SR35increase along T1,while their concentrations decrease.Both the flowrate and concentration of SR36decrease.

Fig.2.Simplified flowsheet of the four reactors.

Table 1 Data of hydrogen sources

Table 2 Data of hydrogen sinks

Fig.3.Hydrogen sinks and sources as well as models of flowsheet.

Fig.4.Hydrogen sinks and sources composite curve.
3.Relation between HUA and VGO Hydrotreating Temperature
3.1.Relation between HUA and uncertain streams
In this refinery,the connections among different units and series reactor do not change.For a hydrogen network with m hydrogen sinksand n hydrogen sources,the connection among them can be simplified with the specific structure of series reactors ignored,as shown by Fig.5.
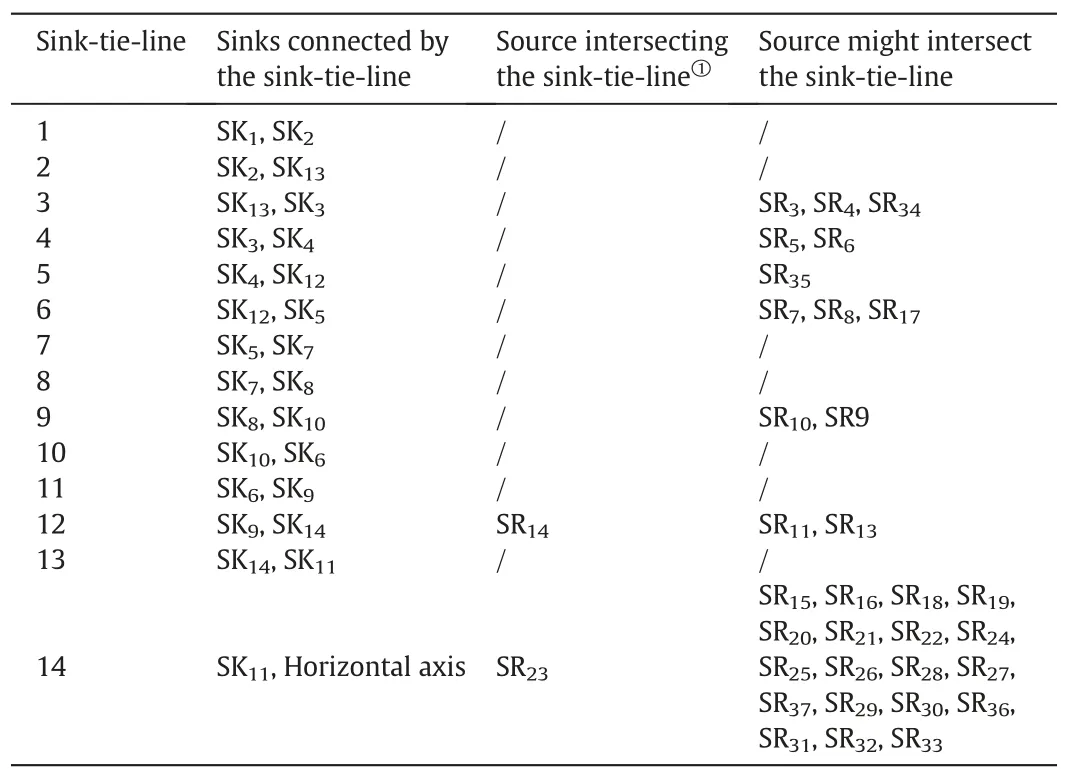
Table 3 Sources might intersect the sink-tie-line

Table 4 Variations of SK13and SK14along T1
A pair of hydrogen source and sink,which are connected to the same reactor and their flowrates and concentrations change along the inlet temperature of the reactor,are termed as uncertain sink and uncertain source,respectively.The relation between the inlet temperature of catalytic bed(T)and the flowrate of uncertain hydrogen source can be written in the form of Eq.(1).Similarly,that between T and the concentration of uncertain hydrogen source is written in the form of Eq.(2).

where,FSRiis the flowrate of source SRi,fi()denotes the corresponding relation.

where,cSRiis the concentration of source SRi,gi()denotes the corresponding relation.
The relation between HUA and uncertain hydrogen sink and source is affected by the location of pinch.In the hydrogen purity versus flowrate profile,the pinch can only appear at the sink-tie-line intersecting the source composite curve,and the sink-tie-line has three possible locations relative to the uncertain sink and source,i.e.above,between and below the uncertain sink and source.For a pair of uncertain hydrogen source and sink,their concentrations(cSRand cSK)have two possible relations,as shown by Eqs.(3)and(4),respectively.In these two situations,the relations between HUA and uncertain sink/source are different and can be analyzed respectively.

when cSR>cSK,the relation between HUA and uncertain sink and source can be written according to the derivation introduced in Ref.26.When the pinch appears at the sink-tie-line lies above the uncertain hydrogen source,the variation of the uncertain source and sink does not affect its hydrogen surplus,and its HUA can be calculated by Eq.(5)[26].When the sink-tie-line lies between the uncertain source and sink,its HUA is affected by the former,and can be calculated by Eq.(6)[26].For the sink-tie-line lies below the uncertain hydrogen sink,both uncertain hydrogen source and uncertain sink affect its HUA,and their relationship can be represented by Eq.(7).

where,ΔFu,iis the HUA when the pinch appears at the intersection point of the sink-tie-line and source SRi,and is defined by Eq.(8);Hiis the hydrogen surplus of the sink-tie-line intersecting SRi;cSRiand cuare the hydrogen purity of SRiand fresh hydrogen,respectively;ΔFSKand ΔFSRrepresent the flowrate variation of uncertain hydrogen sink and that of uncertain hydrogen source,and can be calculated by Eqs.(9)and(10),respectively.


Table 5 Variations of hydrogen sources along T1
when cSK>cSR,the relation between HUA and uncertain sink and source can also be written according to the derivation introduced in Ref.[26].If the pinch lies at the sink-tie-line between uncertain sink and source,the corresponding HUA can be calculated by Eq.(11)[26].When the pinch appears at the sink-tie-line lying above or below the uncertain hydrogen source,their relationship can be described by Eqs.(5)and(7),respectively.

The previous discussion is based on the assumption that the hydrogen source intersecting with the sink-tie-line does not change when the hydrogen utility flowrate and uncertain sink and source change.If this is not the case,the HUA calculated by Eqs.(5)-(7)and(11)should be corrected by the method introduced in Ref.[22].
According to the equations introduced above,it can be seen that the influence of uncertain hydrogen source and sink on HUA is independent.When there are multiple pairs of uncertain hydrogen sources and sinks,hydrogen concentration intervals can be divided according to the concentrations of uncertain sources and sinks.And for sink-tielines lying in different concentration intervals,the effect of all uncertain sinks and sources lying on its left should be summarized.Eqs.(12)and(13)can be used to calculate the variation of the hydrogen surplus of a sink-tie-line caused by an uncertain hydrogen sink and an uncertain hydrogen source,respectively.If there are w uncertain hydrogen sources and z uncertain hydrogen sinks lie on the left of the sink-tie-line,the HUA can be calculated by Eq.(14).

where,SRiiis one of the w uncertain hydrogen sources,and SKjjis one of the z uncertain hydrogen sinks.

Fig.5.Hydrogen sinks and sources in series reactors.
Based on the simulation results shown in Tables 4 and 5,it can be seen that the flowrate and concentration of the uncertain hydrogen source and sink increase nearly linearly along the inlet temperature of VGO hydrotreating reactor,and can be assumed to be linear,as represented by Eqs.(15)-(17),respectively.

where,ajjand pjjare the slope and intercept of the equation relating FSKjjwith T;biiand qiiare the slope and intercept of the equation relating FSRiiwith T;ciiand niiare the slope and intercept of the equation relating FSRiiwith T.
With Eqs.(14)-(17)combined,Eqs.(18)-(20)are obtained to reveal the relationship between HUA and the inlet temperature of VGO hydrotreating reactor for the system with multiple uncertain hydrogen sources and sinks.

where,T0is the initial inlet temperature of VGO hydrotreating reactor,ΔT=T-T0.
The hydrogen surplus of a sink-tie-line varies along the inlet temperature of the upstream reactor,and equals zero when the pinch appears at its intersection point with the source purity profile.The relationship between HUA and the variation of inlet temperature can be determined by Eq.(18).Besides,for the other sink-tie-lines,their hydrogen surplus should not be negative,as shown by Eq.(21).

3.2.Identifying the variation trend of HUA along temperature
In the HUA versus ΔT diagram,Eq.(18)can be represented by a curve.Since Hiis positive andis less than the concentration of hydrogen utility(cu),the intercept of this line is negative.While its coefficient of linear term,k1,can be determined according to Eq.(19).Since k1is affected by many parameters,including the concentration of uncertain sinks and sources,hydrogen utility,the source intersecting the studied sink-tie-line,bii,cii,qii,niiand ajj,whether it is positive or negative cannot be ascertained.Similarly,its coefficient of quadratic term,k2,is positive or negative cannot be ascertained either,as biiand ciiare uncertain.
In the hydrogen network,multiple sink-tie-lines exist,and their HUA versus ΔT lines can be plotted in the same diagram,as shown by Fig.6.These lines intersect at different points.Only when the hydrogen surplus of all sink-tie-lines are nonnegative,can the hydrogen network be feasible.Therefore,the points corresponding the feasible hydrogen network cannot lie below the HUA versus ΔT line of any sink-tie-line.Based on this,it can be identified that the upper broken line formed by all HUA versus ΔT lines is the lower limit of the feasible region.When the point lies on this curve,the fresh hydrogen consumption reaches the minimum,and the pinch of the hydrogen network exists and lies on the intersection point of the corresponding sink-tie-line and source.Furthermore,this curve indicates the variation of the minimum fresh hydrogen consumption along the inlet temperature,and is termed as the HUA-ΔT variation trend line.According to this line,the minimum HUA and the corresponding inlet temperature can be identified.

Fig.6.Variation trend line and feasible region of the hydrogen network.
Generally,the inlet temperature of a reactor cannot change randomly.Its variation is limited by the catalyst and product requirements in a certain interval;the lower and upper limits are represented by ΔTminand ΔTmax,respectively.Therefore,the region above the variation trend line and between upper and lower limit of the allowed inlet temperature is the feasible region.
In Fig.6,vertical line AB and GH correspond the lower limit and upper limit of ΔT,respectively;ABCDEFGH is the variation trend line.When the point(HUA,ΔT)lies in section AB or GH,the hydrogen network is feasible,while the pinch does not exist.When it lies in section BC,the pinch lies at the intersection point of the sink-tie-line and SR1.Similarly,when it lies in section CD,DE,EF and FG,the pinch is formed at the intersection point of the sink-tie-line and SR2,SR3,SR4and SR5,respectively.Point C is the intersection point of the HUA versus ΔT lines corresponding SR1and SR2,and there are two pinch points;one is the intersection point of the sink-tie-line and SR1,and the other is that of the sink-tie-line and SR2.Similarly,at point D,E and F,there are also two pinches,which appear at the intersection points of sink-tie-lines and corresponding sources.
In BCDE section of the variation trend line,HUA decreases along the inlet temperature,as well as the hydrogen utility consumption.While in the EFG section,HUA and the hydrogen utility consumption increase along the inlet temperature of reactor.Therefore,point E is the point corresponding the minimum HUA and the minimum hydrogen consumption.
3.3.Effect of the VGO hydrotreating reactor inlet temperature
The steps to analyze the effect of the VGO hydrotreating reactor inlet temperature is shown in Fig.7.According to the simulation results shown in Tables 4 and 5,Eqs.(22)-(29)are fitted to represent the relationship of the flowrate of SK13,SK14,the flowrate and concentration of SR34,SR35,SR36versus T,respectively.

Fig.7.Flow chart for analyze the effect of the VGO hydrotreating reactor inlet temperature.

Sink-tie-line 12 intersects SR14,as shown in Table 3.Its HUA is not affected by SK14as its concentration,0.88,is the value of lower endpoint of this sink-tie-line.However,the HUA of sink-tie-line 12 is influenced by SR34and SK13.With Eqs.(22),(24)and(27)substituted into Eq.(18),Eq.(30)is obtained to calculate ΔFu,14.When the hydrogen utility flowrate changes,the source intersecting sink-tie-line 12 might be SR11or SR13,instead of SR14.Since these two sources have the same concentration as SR14,their HUA versus ΔT relation can also be represented by Eq.(30).

Fig.8.Diagram of HUA versus the ΔT of VGO hydrotreating reactor.

Sink-tie-line 14 intersects source SR23,whose concentration is 0.5 and lower than that of SK13,SK14,SR34and SR35.SR15,SR16,SR18,SR19,SR20,SR21,SR22,SR24,SR25and SR26lie on the left of this sink-tie-line at the initial state and might intersect it when the hydrogen utility changes.With Eqs.(22)-(25)and(27)-(28)substituted into Eq.(18),Eqs.(31)-(41)are obtained to show the relation between HUA and ΔT when sink-tie-line 14 intersected these sources,respectively.


Similarly,SR27,SR28,SR29,SR30,SR31,SR32,SR36and SR33lie on the right of sink-tie-line 14,and might intersect it when the hydrogen utility decreases.With Eqs.(22)-(25)and(27)-(28)substituted into Eq.(18),Eqs.(42)-(49)are obtained to describe the relationship between HUA and ΔT of these sources,respectively.


Fig.9.Feasible region of the VGO hydrotreating reactor and hydrogen network.

Fig.10.Matching diagram of hydrogen network when T1is 345°C.

Table 6 Variations of the gasoline and diesel along T1

For the sources that may intersect sink-tie-line 3(SR3,SR4,SR34),sink-tie-line 4(SR5,SR6),and sink-tie-lie 5(SR35),sink-tie-line 6(SR7,SR8,SR17),sink-tie-line 9(SR9,SR10),the intercepts of the corresponding HUA versus ΔT lines are-28852.01 m3·h-1,-13002.01 m3·h-1,-8442.013 m3·h-1,-33770.2 m3·h-1,and-31093.8 m3·h-1,respectively.Since these intercepts are very small,these HUA versus ΔT lines will not influence the feasible region.
The lines corresponding Eqs.(31)-(49)are plotted in Fig.8.In this figure,the lines are close to each other.However,it is identified that the feasible region is determined by lines corresponding SR23,SR26,SR22and SR18.To show the feasible region clearly,these lines are plotted in Fig.9,together with the lower and the upper limit of ΔT.The lower and the upper limits on the inlet temperature of VGO hydrotreating reactor are 345°C and 445°C,respectively,and the corresponding lower and the upper limits on ΔT are-5 °C and 95 °C.In this figure,line ABCDE is the variation trend line,and its mathematical relation is shown by Eq.(50).The region above ABCD is the feasible region.
In line ABCDE,HUA increases along ΔT.In section AB,the pinch is formed at the intersection point of sink-tie-line 14 and source SR23.While in section BC,CD and DE,the pinch appears at the intersection point of sink-tie-line 14 and source SR26,the intersection point of sink-tie-line 14 and source SR22,and the intersection point of sink-tieline 14 and source SR18,respectively.At point B,two pinches exist;one is that appears in AB section,the other is that appears in BC section.Similarly,there are two pinches at point C and D.At point A,the inlet temperature of the VGO hydrotreating reactor is the lowest(345°C),the hydrogen network has the minimum HUA,-341.152 m3·h-1,and the minimum hydrogen consumption is 43207.108 m3·h-1,3.68% less than the original hydrogen utility consumption(44856.03 m3·h-1).When T1is 345 °C,the matching diagram of the hydrogen network is shown in Fig.10.It can be seen that,at the minimum hydrogen consumption,the requirement of all sinks can be satisfied.That means,the minimum hydrogen consumption identified by the HUA versus ΔT is feasible.

3.4.Analysis of economic benefits
The variation of VGO hydrotreating reactor inlet temperature affects the products of the VGO hydrotreating reactor and the hydrocracking reactor,while its effect on fluid catalytic cracking reactor and visbreaking reactor can be ignored.Table 6 shows the variation trend of gasoline and diesel products of the VGO hydrotreating reactor and the hydrocracking reactor along T1.As T1increases,the flowrates of gasoline and diesel separated from the product of the VGO hydrotreating reactor increase.Correspondingly,the feedstock of the hydrocracking reactor decreases,as well as the amount of gasoline and diesel product from the hydrocracking reactor.Since the increment of gasoline and diesel produced in the VGO hydrotreating reactor is greater than their decrement in the hydrocracking reactor,the total amount of gasoline and diesel products increases along T1.Correspondingly,more hydrogen is consumed to convert the feed into light gasoline and diesel products in the VGO hydrotreating and hydrocracking reactors,and the total flowrate of two hydrogen sinks increases,as shown in Table 6.This is in good agreement with the variation shown in Table 4.

Fig.11.Variation of H2and product profit along ΔT.
Besides,the octane number of gasoline product increases and the solidifying point of the diesel product decrease along T1.Therefore,the quality of gasoline and diesel products increases along the inlet temperature,as well as their values.The octane number is used to measure the value of gasoline product,and its price is linearly fitted according the price of different grades of gasoline.Similarly,the solidifying point is used to measure the value of diesel product.In this paper,the prices of 89#gasoline,92#gasoline,95#gasoline are taken as 6.4 CNY·L-1,6.9 CNY·L-1and 7.4 CNY·L-1,respectively,and those of 0#and-10#diesel are taken as 6.9 CNY·L-1and 7.5 CNY·L-1.The total value of the gasoline and diesel products increases significantly along T1,as shown in Table 6.
Since lower T1is beneficial to the hydrogen consumption,has the opposite effect to the products value,the economic benefits of T1is further analyzed quantitatively.With the price of hydrogen utility is taken as 1.5 CNY·(m3·h-1)-1.The variation of the product profit along ΔT can be plotted according to the data shown in Table 6,and that of hydrogen cost can be plotted according to Eq.(50),as shown in Fig.11.According to this figure,the effect of the temperature can be evaluated quantitatively.However,the temperature cannot be optimized with only these two factors considered,as the inlet temperature of the reactor also affect the reactor's outlet temperature and the energy consumption of the heat exchanger network.To achieve this,the two exchange networks and the reactors should be considered together.This will be studied in the future work.
4.Conclusions
In this work,the hydrotreating temperature of vacuum gas oil(VGO)of a refinery is analyzed based on the rigorous simulation of multiple series reactors and their integration with the hydrogen network.The simulation of the VGO hydrotreating and hydrocracking series reactors shows that,as the temperature of VGO hydrotreating reactor increases,the flowrate and concentration of some related streams change significantly in linear relation.Furthermore,the flowrate of the hydrogen inlet into the VGO hydrotreating reactor increases,while that inlet into the hydrocracking reactor goes down;the amount of gasoline and diesel product increases.
The relation between HUA and sources and sinks can be derived based on the fitted data of the series reactor,and the quantitative diagram between HUA and the inlet temperature of VGO hydrotreating reactor can be applied to identify the feasible region,variation trend line,and the minimal HUA of the hydrogen network.The inlet temperature with the minimum hydrogen consumption of the studied VGO hydrotreating reactor is identified to be 345°C.
Although the effect of the inlet temperature of the VGO hydrotreating reactor can be evaluated quantitatively by the method proposed in this work,it cannot be optimized,as the inlet temperature of the reactor also affect the reactor's outlet temperature and the energy consumption of the heat exchanger network.To achieve this,the hydrogen network,heat exchange network and the reactors should be considered together.Besides,only four reactors are simulated and the temperature of VGO hydrotreating reactor is analyzed.While the reactors of naphtha hydrotreating,kerosene hydrotreating,diesel hydrotreating and continuous catalytic reforming are not taken into consideration.These reactors affect the hydrogen network as well.Although there is no reactor in the atmospheric distillation unit and vacuum distillation unit,the operation of these two units affects the hydrotreating reactors and hydrogen network,as they provide feed oil to these downstream units.Based on the method proposed in this work,all these factors will be studied in the future.
Nomenclature
cuconcentration of hydrogen utility
FSK′ flowrate of uncertain hydrogen sink after the variation
FSR′ flowrate of uncertain hydrogen source after the variation
Fuflowrate of hydrogen utility
Fu′ flowrate of hydrogen utility when the hydrogen surplus of sink-tie-line i becomes zero
Hihydrogen surplus of sink-tie-line intersecting source SRi
SK,SKjjuncertain hydrogen sink
SKjhydrogen sink j
SR,SRiiuncertain hydrogen source
SRihydrogen source i
T1,T0inlet temperature of VGO hydrotreating reactor after and before variation
ΔFu,ihydrogen utility adjustment when the pinch appears at the intersection point of the sink-tie-line and source SRi
ΔT temperature variation of VGO hydrotreating reactor
ΔTmaxupper limit of a reactor's inlet temperature
ΔTminlower limit of a reactor's inlet temperature
杂志排行

Chinese Journal of Chemical Engineering的其它文章
- A review of low-temperature heat recovery technologies for industry processes☆
- Current scenario and potential of biodiesel production from waste cooking oil in Pakistan:An overview☆
- Structure and synthesis of graphene oxide☆
- Co-firing of coal and biomass in oxy-fuel fluidized bed for CO2capture:A review of recent advances
- Effects of internals on phase holdup and backmixing in a slightlyexpanded-bed reactor with gas-liquid concurrent upflow☆
- Distribution performance of gas-liquid mixture in the shell side of spiral-wound heat exchangers☆