Influence of temperature and Ca(OH)2on releasing tar and coal gas during lignite coal pyrolysis and char gasification☆
2019-02-09SunelKumarZhihuaWangZhangKangJunXiaRonaldWhiddonYongHeJaffriGulRanaZainAliSalehBairqKefaCen
Sunel Kumar,Zhihua Wang,*,Zhang Kang,Jun Xia*,Ronald Whiddon,Yong He,Jaffri Gul-e-Rana,Zain Ali Saleh Bairq,Kefa Cen
1State Key Laboratory of Clean Energy Utilization,Zhejiang University,Hangzhou 310027,China
2 Department of Mechanical,Aerospace and Civil Engineering,Brunel University London,Uxbridge UB8 3PH,UK
3 Fuel Research Centre,PCSIR,Karachi 75280,Pakistan
4 College of Chemistry and Chemical Engineering,Hunan University,Changsha 410082,China
Keywords:Catalyzed coal pyrolysis Release volatiles of tar and coal gas Surface area Pore volume
ABSTRACT The yield of tar and syngas has been investigated by catalytic pyrolysis of Pingzhuang lignite(PZL)over Ca(OH)2catalyst in temperature range of 600°C-1000°C in a tube furnace.The results show that the yield of volatile pyrolysis increases and char decreases with rising temperature for both raw and catalyzed Pingzhuang lignite.The hydrogen fraction(H2)increased from 20%to 40%for the PZL sample;but,for the PZL-Ca(OH)2sample,H2fraction fluctuated randomly between 35% to 42%,with the maximum H2fraction found at 1000 °C.The Gaschromatography mass-spectroscopic(GC-MS)analysis revealed that the maximum tar yield at 800°C and 700°C was obtained for PZL and PZL-Ca(OH)2,respectively.The surface morphology of PZL and PZL-Ca(OH)2chars underwent different transformation in the presence of catalyst as illustrated by SEM/EDX,FTIR,and BET analysis.Furthermore,char sample was investigated for the carbon conversion and reactivity index using TGA analysis under N2and CO atmosphere.
1.Introduction
Coal is the primary source of energy in China,accounting for 64%of the total energy utilization in 2015.Coal can be used to produce oil and gas because it contains high volatile proportion,in addition to provide thermal power through combustion[1].Integrated pyrolysis and combustion is a unique technique which allows transformation of lignite into liquid,gas and solid fuels that may be utilized more cleanly than direct combustion of the low-quality coal.Additionally,pyrolysis can be used to produce value-added compounds,i.e.,char,tar,and coal gas,which are basic material of numerous products such as petrochemicals,dyes,agricultural chemical material,synthetic fiber,and rubbers[2,3].The obtained char from coal pyrolysis can be utilized as a fuel in direct combustion.The potential value of pyrolysis derivatives and the possible improvement in combustion quality provides strong motivation for detailed study of the composition and chemical structure of coal tar,coal gas,and char.
The pyrolysis of coal involves a complex sequence of changes as the temperature increases that result in the sequential release of physically retained compounds,weakly bound compounds,active groups attached to the carbon backbone and finally the decomposition of the carbon structure itself.The process of coal pyrolysis,including primary decomposition and secondary modification of compounds before volatilization,is influenced by multiple factors,such as duration of pyrolysis,heating rate,coal particle size,coal rank,peak pyrolysis temperature,carrier gas medium,etc.[4].The catalytic effect of calcium in partial coal pyrolysis is widely known;however,research often generates conflicting data regarding the promoting and inhibiting effects of calcium on important pyrolysis characteristics such as char conversion,syngas(CO,CO2,H2)yield,light hydrocarbon yield and tar yield[5,6].The process by which calcium is expected to decompose the coal carbon matrix is by the promotion of oxygen transfer to reactive carbon sites by the following reaction series[7]:

Additionally,it is suggested that CaO catalyzes the decomposition of phenol groups at temperatures above 750°C by reducing the activation energy of the first step in phenol thermal degradation,the keto-enol shift and subsequently product compounds,e.g.,polycyclic furans[8].

Table 1 Ultimate and proximate analyses of coal

Table 2 The mineral composition for PZL coal sample
Recently,appreciable research has been conducted on various aspects of catalyzed coal pyrolysis.For example,Liang et al.[9]investigated the optimal catalyst concentration during depolymerization of lignite coal for increasing tar yield.Chen et al.[10]used Ca(OH)2in a fluidized bed and found that catalyst improved the quality of coal gas but did not affect the CH4yield.Lin et al.[11]pyrolyzed coal with Ca(OH)2and CaO at different pressure using fixed bed reactor and found that Ca(OH)2and CaO produce more coal gas as elevating the pressure.Further research on the process of catalyzed coal pyrolysis is found in references[12-17].
However,there is still plenty of research gap remains for catalytic pyrolysis,so in the current research we focus on the effect of temperature and Ca(OH)2on pyrolysis products.Herein,the effect of Ca(OH)2on the characteristics of gas,tar,and char during coal pyrolysis using a tube furnace at different temperature.Gas chromatography(GC)was used to measure the composition of pyrolysis gases,and a water displacement method was used to analyze the release rate and quantity of gas evolved.Tar fractions were collected for further analysis with GC-MS to identify the tar composition at different temperature.The char and raw coal were examined by FTIR analysis for the functional groups,scanning electron microscope (SEM)to observe the surface structure,energy dispersive X-ray(EDX)for the presence of elemental distribution on coal surface,and Brunauer-Emmett-Teller (BET)for pore size and volume analysis.Furthermore,char was investigated by Thermogravimetric analysis(TGA)in the presence of N2and CO environment to describe the carbon conversion and reactivity index.
2.Experimental
2.1.Coal samples
Pingzhuang lignite was taken from Inner Mongolia,which represents a low-quality coal sample in the measurement.The coal was ground and then sieved to select sub 75 um particle size.Coal-catalyst samples were prepared by mixing 20 g of ground coal with Ca(OH)2catalyst at a ratio of 10% by mass.120 ml of deionized water and coalcatalyst mix to form a homogenous mixture by kneading method[18,19]which was stirred for 24 h.After this,the coal catalyst mixture was dried for 12 h at 60°C under vacuum.The raw coal and calciumloaded coal is referenced as PZL and PZL-Ca(OH)2,respectively.The ultimate and proximate analyses of the PZL were shown in Table 1.Furthermore,mineral composition of PZL is listed in Table 2;the addition of Ca catalyst increases the CaO content from 4.77 wt% (dry)in the PZL sample to 28.60 wt%in the PZL-Ca(OH)2sample.
2.2.Experimental procedure
Experiments on pyrolysis of PZL and PZL-Ca(OH)2were performed in a 1.5-m long,10-cm diameter quartz tube reactor heated by a 5500-W horizontal tubular heater(GSL-1600X).A schematic of the experimental system is shown in Fig.1.At the start of the pyrolysis experiment,a quartz boat was loaded with 3 g of the selected sample and placed in the quartz reactor tube at a position outside the hightemperature zone of the furnace.Next,the furnace was purged with N2at the rate of 500 ml·min−1for 2 h.The furnace was heated at the rate of 5°C·min−1to desired temperate(600-1000°C in 100°C increments).The flow of nitrogen gas was closed when the required temperature reached and the quartz boat transfer into the heated section of the quartz reaction chamber for fast pyrolysis.The coal was retained in the furnace for 15 min to ensure the temperature,and catalytic action were the principle variables affecting results.Each experiment performs three steps;first measure the gas volume,and then,measure the gas composition for gas analysis;furthermore,collect the tar.
2.3.Measurement methods
The water displacement method was used to measure the volatile release volume (VRV)during the pyrolysis process.In this method,an electronic balance is used to measure the mass of water displaced by the released gas to determine the volume of gas produced.Low molecular weight volatile gases (LVG)were measured by (Agilent Micro GC 490)gas chromatography.The pyrolysis gas passed through three conical flasks which were filled with dichloromethane to make sure complete absorption of tar.After complete pyrolysis,experiment tube was removed from the furnace and washed using dichloromethane because some tar also sticks inside the surface of the tube.GC/MS (Thermo Scientific ISQ)used for the analysis of tar sample.The surface of raw samples and char samples were analyzed by (EDX)and (SEM).BET (Brunauer-Emmett-Teller)analysis was performed on char to characterize physical parameters including average pore diameter,specific surface area,and pore volume.BET equation was used to find the surface area,and for calculation of pore size and volume,Barret-Joyner-Halenda (BJH)model was used.FTIR analysis was used to elaborate the functional groups of char and raw coal sample.Thermo scientific Nicolet 6700 infrared spectrometer was used for measurement of FTIR.Sample was analyzed at room temperature and air atmosphere,the scan range 400-4000 cm−1with 32 scan per spectrum at the resolution of 4 cm−1.Peak Fit 4.12 used for peak separation based Gauss fitting of the FTIR spectrums,peak fitting analysis given in supplementary material.The FTIR spectrum mainly divided into four regions,--OH groups (3600-3000 cm−1),aliphatic C--H groups(3000-2800 cm−1),O-containing groups (1800-1000 cm−1),aromatic,aromatic C--H groups,and ash matter (900-700 cm−1)as shown in Fig.6.The quantitative analysis of oxygen-containing,aliphatic and aromatic structure is given as:

Fig.1.Schematic diagram for experimental setup.

Fig.2.Effect of catalytic pyrolysis on Pingzhuang coal VRV at different temperature.

During coal pyrolysis,the transformation of oxygen-containing functional group can be expressed as given in Eqs.(4)and (5),the ratio of (Ahy/Aet)hydroxyl oxygen/ether group and the ratio of(AC=O/Aar)carboxyl-oxygen/aromatic hydrocarbon.The changes of the aliphatic group can be determined from Eq.(6);the ratio of (CH3/CH2)methyl and methylene,Eq.(7)shows the ratio of(Aar/Aal)aromatic/aliphatic-hydrocarbon.

Fig.4.SEM images of PZL coal and char:(a)PZL coal;(b)PZL-600°C;(c)PZL-700°C;(d)PZL-800°C;(e)PZL-900°C;(f)PZL-1000°C.
The yield of char and tar were determined by measuring the mass difference after the experiment (tar yield determined from the mass balance of the three conical flasks).Since the precision scale was used for measuring the volatile release volume(VRV)and GC used for analysis of gas composition,the pyrolysis gas yield was approximated by the following equations:

Whereas V and Vmrepresent the volume of release volatile and molar volume of ideal gas,Mirepresents the molar mass and volume percentage denoted by Pi.
TGA experiment was performed in N2and CO2atmosphere for measuring the carbon conversion and gasification reactivity index of char sample.The char sample from the pyrolysis of PZL-1000°C and PZL-Ca(OH)2-1000°C were selected for further TGA experiment under nitrogen atmosphere from room temperature to 800°C,900°C,and 1000°C temperature,then switch the gas to the CO2atmosphere for gasification.However,carbon conversion and gasification reactivity can be calculated as follows:

where mt,moand m∞are the mass at time t,initial mass,and final mass after experiment,respectively.On other hand,τ0.5is the gasification time acquired to achieve 50%carbon conversion.
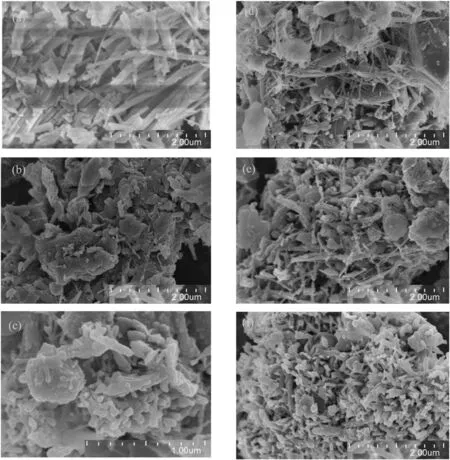
Fig.5.SEM images of catalytic coal and char.(a)PZL-Ca(OH)2(b)PZL-Ca(OH)2-600°C(c)PZL-Ca(OH)2-700°C(d)PZL-Ca(OH)2-800°C(e)PZL-Ca(OH)2-900°C(f)PZL-Ca(OH)2-1000°C.

Table 3 Effect of temperature and catalyst on pyrolysis char
3.Results and Discussion
3.1.Effect of temperature on volatile release volume
The cumulative VRV during the first 500 s of pyrolysis for PZL and PZL-Ca(OH)2at pyrolysis temperatures from 600 to 1000 °C were shown in Fig.2.As a rule,the increase the pyrolysis temperature results in the higher VRV yield.The addition of the calcium catalyst induces a clear discernable change in the releasing rate of gases during pyrolysis;however,a general trend is not readily evident.For some temperature cases,the catalyst with coal shows an earlier onset of gas production,e.g.,600°C.Conversely,the samples at 800 and 1000°C experienced bring tardy in pyrolysis gas production.At 800°C,the pyrolysis gas production shows the appreciable difference with addition of catalyst until the production rate of the PZL-Ca(OH)2sample outstrips the PZL sample.At elevated temperature,volatiles are produced from the coal through the disruption of bonds.In the absence of catalyst,methane production peaks at 450°C,and hydrogen release peaks at 725°C[20].According to Zhu et al.[6],CO2is produced by the decomposition of carboxyl groups below 650°C and the previously described catalytic decomposition of active C sites on the coal structure.As the temperature increases,the primary products of pyrolysis may be further converted such as the polymerization of tars[21]or alternatively the catalytic decomposition of tars.Thus,the observed variation in total VRV with temperature is not unexpected and may be attributed to the different processes that become dominant as the respective threshold temperatures are reached.

Fig.6.GC/MS analysis of coal tar(a)PZL−600°C(b PZL-Ca(OH)2-600°C.
3.2.Effect of temperature on LVG

Fig.7.Influence of catalytic pyrolysis on Pingzhuang coal tar at different temperature a)PZL coal(b)PZL-Ca(OH)2.
The LVG compositions,measured at different pyrolysis temperatures,for the PZL and PZL-Ca(OH)2samples are shown in Fig.3.The low molecular mass species,H2,CH4,CO,and CO2,are given in Fig.3(a)-(b);higher order hydrocarbons,C2H4,C2H6,C3H6,and C3H8,are given in Fig.3(c)-(d).As the pyrolysis temperature increases,there is an appreciable shift in LVG composition to favor the production of H2and CO as the CO2,CH4and higher order hydrocarbons,in general,decrease.The exception to this trend is C2H4which does not decrease in concentration as quickly as the other multi-carbon compounds when the pyrolysis temperatures were increased.Production of hydrogen initially comes from the breakdown of hydrogen contained heterocyclic and aromatic compound at 300°C and 450°C respectively due to hydrogenation and condensation reaction.As a result of the many different production processes,the maximum hydrogen yield rate occurs at higher temperature[22,23].The cleavage of an aliphatic hydrocarbon and aromatic hydrocarbon are the main sources for CH4 compound[24].Additionally,at high-temperature,CH4may be produced from secondary reactions involving primary products[23].
The addition of Ca(OH)2with coal results in obviously altered composition of LVG.For example,comparing Fig.3(a)and(b),the proportion of CO2and CO in the non-catalyzed coal shows little change in concentration until the 600-700°C step,but the catalyzed coal shows a constant decline of CO2and increasing CO apparent from 600 to 1000°C.Due to increasing the temperature,cleavage of the aromatic ring that produces hydrocarbon gases as well as C2-C3content also decreases,it may be observed that the breakdown of complex hydrocarbon is the main cause for gases production from Pingzhuang coal pyrolysis.
3.3.Characteristics of coal pyrolysis char at different temperature
3.3.1.SEM and EDX analyses
For the understanding of coal pyrolysis at different temperatures,and the impact of Ca(OH)2catalyst on the morphological structure of coal,and the surface texture properties of PZL and PZL-Ca(OH)2pyrolysis char measured by SEM.The resulting images were shown in Figs.4 and 5,for PZL and PZL-Ca(OH)2,respectively.Figs.4(a)and 5(a)show PZL and PZL-Ca(OH)2,respectively,before being undergoing pyrolysis.The surface of raw coal is smooth and no crystalline structure,on the other hand,catalyzed coal surface covered with filamentous structure.Fig.4(b-f)shows that as the pyrolysis temperature increases from 600°C to 800°C,the porosity also increases,but further increase in pyrolysis temperature does not induce any further dramatic changes in the char.The thin filaments seen in the char images,Fig.5(b-f),are Ca bearing phases that develop during the catalytic pyrolysis,as the temperature increases from 600°C to 1000°C,the size of filaments decreases.EDX analysis,attached in the supplementary documents,shows the elemental breakdown of various surface textures in the pyrolyzed char.By comparing the surface morphology of raw coal and catalyzed coal pyrolysis char,it can be found that addition of catalyst has great influence on surface texture properties of pyrolyzed char.
3.3.2.Effect of temperature and catalyst on pore of pyrolysis char
The effect of catalyst and temperature on texture of pyrolysis char was shown in Table 3.For PZL coal samples,there is a single step decrement in pore diameter seen when increasing the pyrolysis temperature from 600 °C to 700 °C where the average pore diameter drops from~3 nm to~2 nm.In the PZL-Ca(OH)2sample,there are two step decrements in average pore diameter;the first occurs from~17 nm to~6 nm when temperature rose from 600 °C to 700 °C and a further size decrease to~2 nm above 800°C.As the temperature increases,the pore volume and specific surface area also increases,yielding recognizable trends.As in contrast,the PZL-Ca(OH)2sample also shows a very ordered increase in the pore volume and surface area with stepwise increase of temperature up to 1000°C.
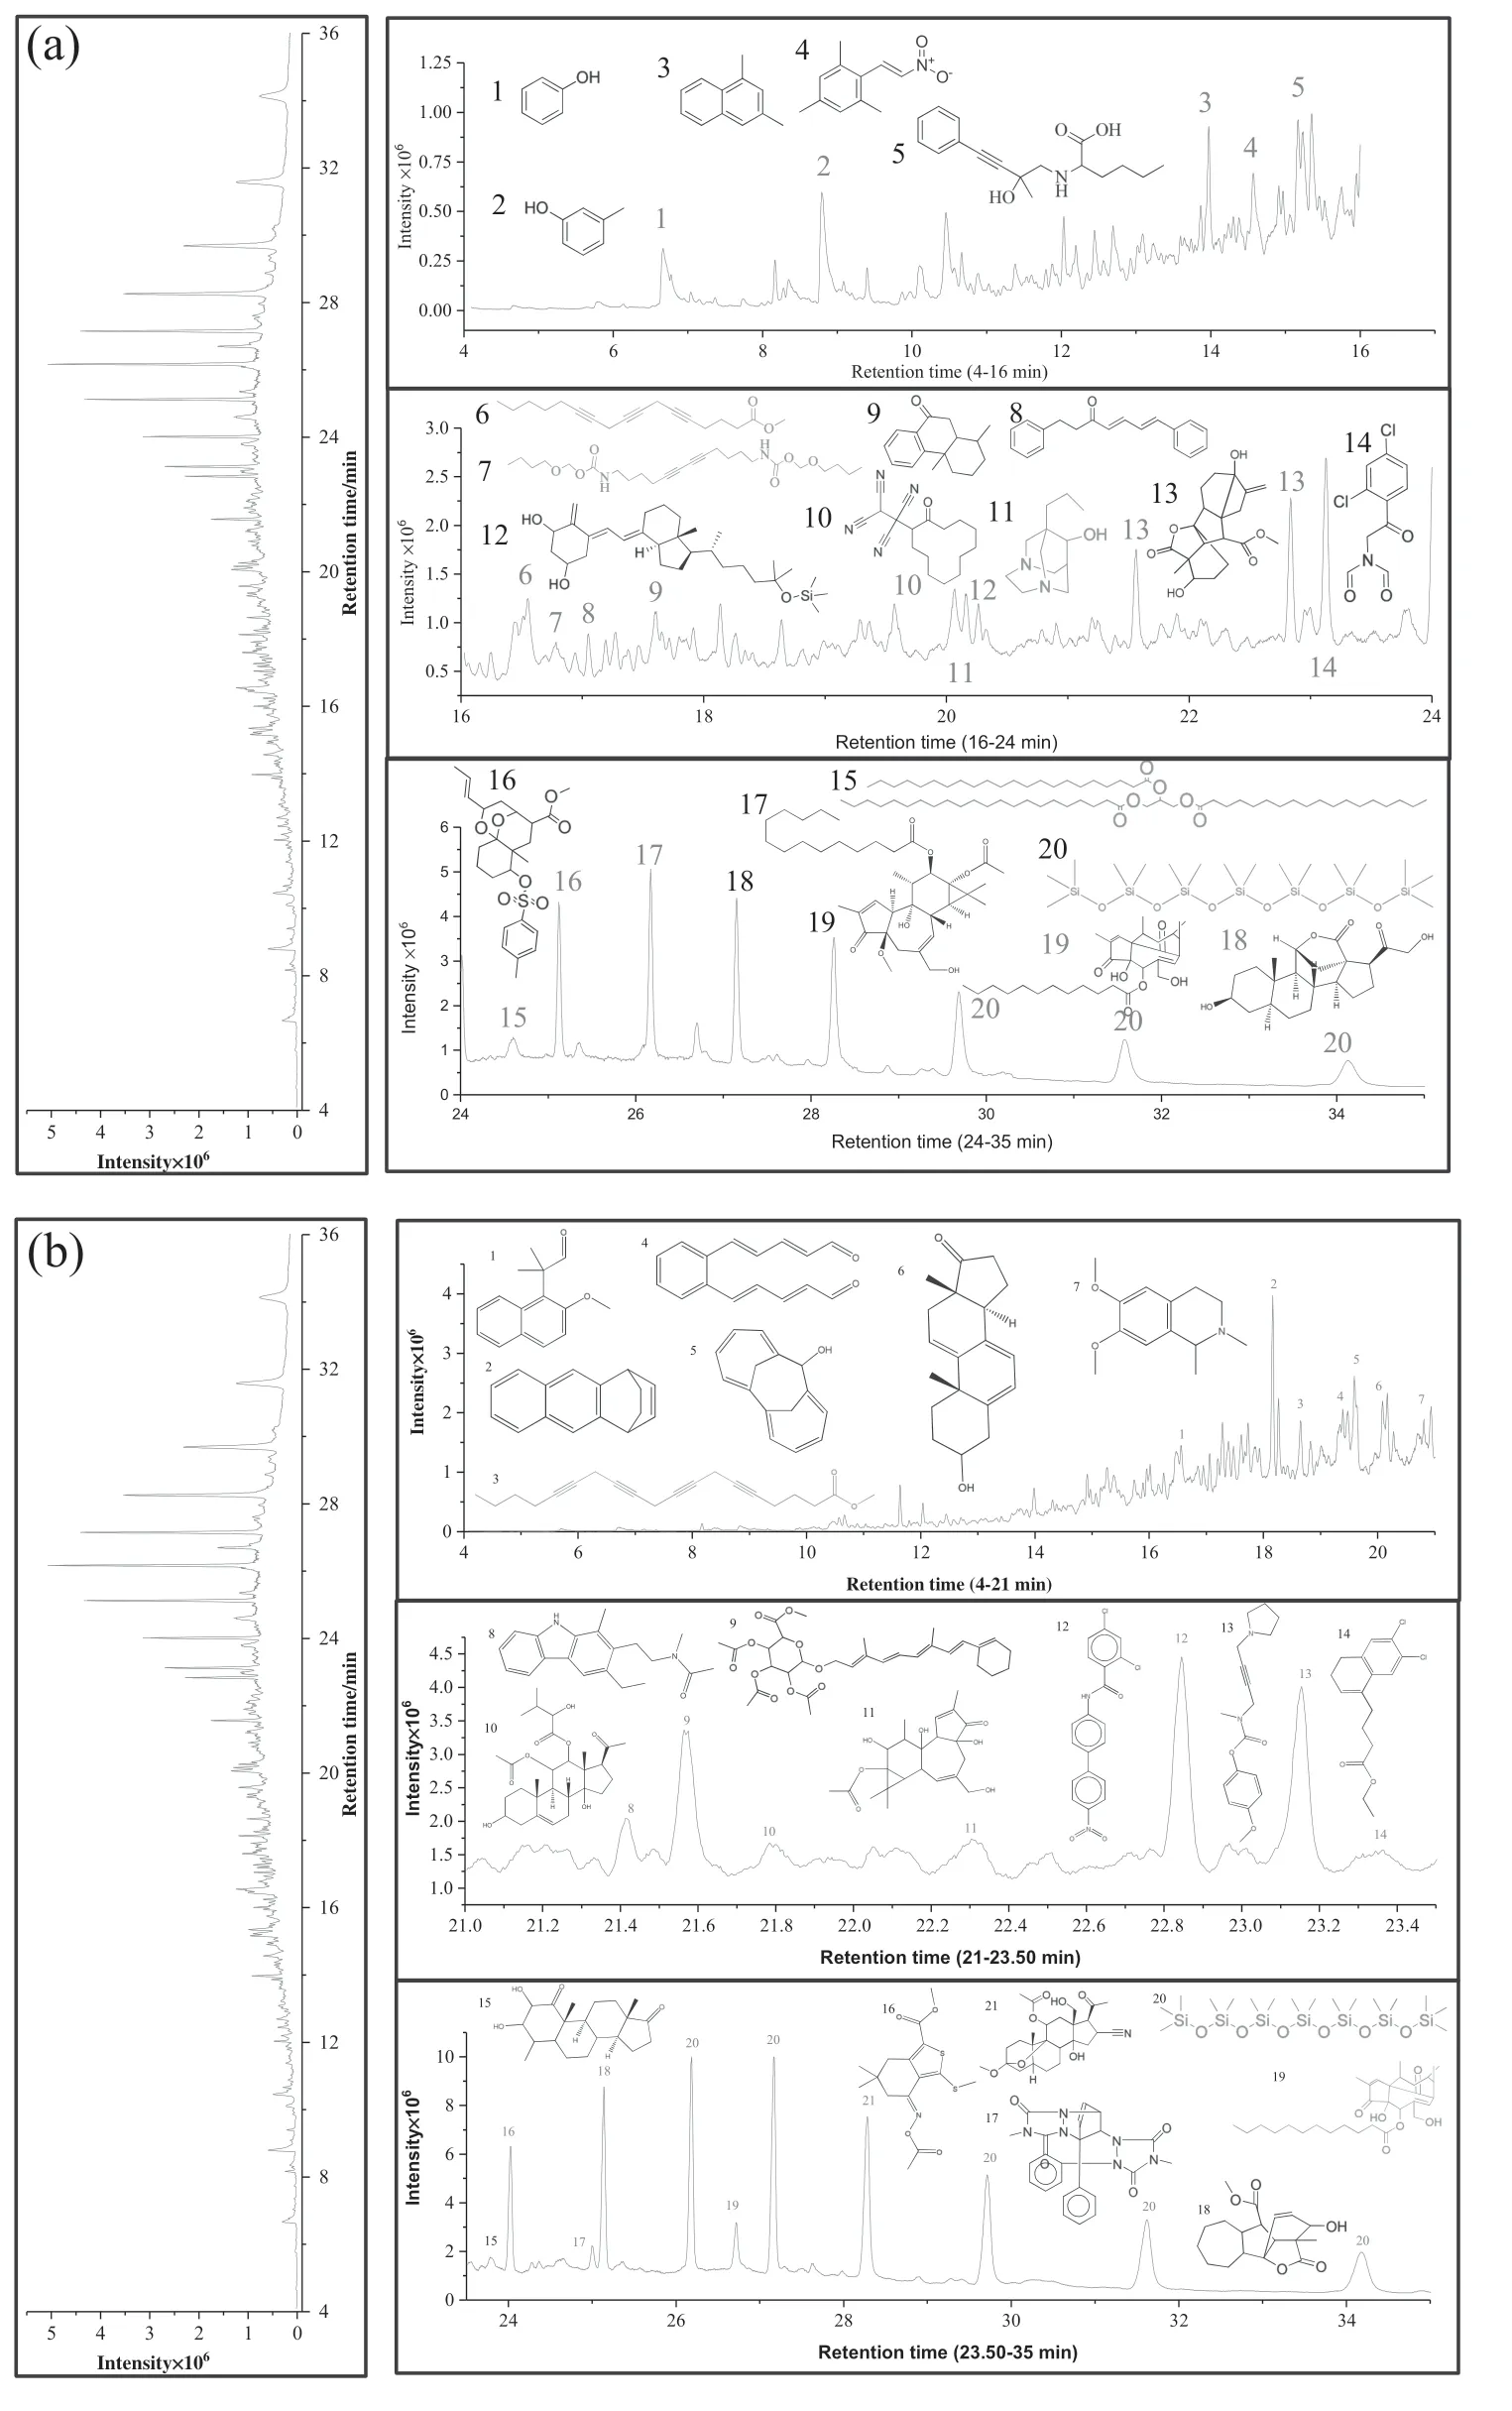
Fig.8.FTIR analysis of raw and raw coal with catalyst at different temperature:(a and d)400-600 cm−1;(b and e)1600-3000 cm−1;(c and f)3000-3600 cm−1.
As the pyrolysis temperature rises,unstable functional groups are broken down,and large volumes of volatiles are released leading to creating new holes,increasing specific area and pore volume[25].As the temperature increases,volatilized tars clear the plugged pores.Simultaneously poly-condensation reaction produces H2and leads to creating many holes [22,23].The net outcome is an increase in specific area and pore volume rapidly.
3.3.3.FTIR analysis of char at different temperature
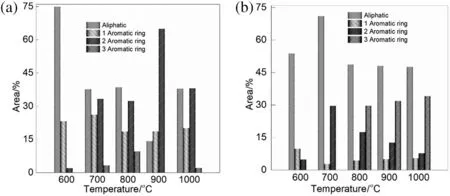
Fig.9.The effect of temperature and catalyst on the ratio of different peak area range:(a)Ratio of Ahy/Aet(b)ratio of Ac=o/Aar(c)ratio of CH3/CH2(d)ratio of Aar/Aal.
Fig.6(a-f).shows the FTIR analysis at a different range of wavelength;mainly,there are three wave ranges like 400-600 cm−1for ash and C--H group,1600-3000 cm−1for aliphatic and oxygencontaining group,and 3000-3600 cm-1for--OH group.The catalytic effect on the oxygen-containing functional group after pyrolysis was shown in Fig.7(a-b).It is clear from Fig.7 that char with catalyst has higher Ahy/Aetratio,which reveals that the transformation of hydroxyl to ether is lower in char with catalytic except at 600°C temperature.On the other hand,Ac=o/Aarratio was also higher as compare to char from raw coal pyrolysis except for 900°C of temperature,which reveals that breakdown of active oxygen-containing carboxyl and carbonyl group was lower in char with catalyst [26].Fig.7(c-d),shows the ratio of methyl/methylene(CH3/CH2)and aromatic/aliphatic hydrocarbon(Aar/Aal).A higher ratio of CH3/CH2represents the long aliphatic branches and lower unsaturated bond bridge[27].Fig.7(c)shows that the higher CH3/CH2ratio was found at PZL-Ca(OH)2-600°C,but 700-1000 °C shows a slightly lower ratio of CH3/CH2.On the other hand,Aar/Aalratio was higher at PZL-Ca(OH)2-600 °C,then suddenly the ratio decreases like raw coal at different temperature[28].However,at 1000 °C,PZL-Ca(OH)2has a lower Aar/Aalratio that reveals that lower aromaticity was found at higher temperature in catalytic coal pyrolysis.
3.4.GC-MS of tar at different temperature
Chromatograms of tar samples from pyrolysis of PZL and PZL-Ca(OH)2samples at 600°C were shown in Fig.8(a-b),respectively.Molecular compounds that are attributed for selected peaks are included in the figure space.Fig.9(a-b)shows the composition of tar sample fraction for PZL and PZL-Ca(OH)2.From a comparison of the general specie inventories in Fig.9,it is evident that the addition of catalyst causes a decrease in single aromatic ring compounds and a consistent increase at all pyrolysis temperatures in aliphatic compounds.Longwell et al.[29]studied the tar with calcium oxide favorable for the breakdown of aromatic compounds thus decreasing the amount of aromatic compound.
The maximum aliphatic compound is found in PZL,which indicates that there are more aliphatic bond fragment at a lower temperature.However,in PZL-Ca(OH)2,a maximum aliphatic compound was found at 700°C,and furthermore,it slightly decreases as temperature increase up to 1000°C.This reflects that reactivity of calcium oxide reduces for cracking the complex aromatic compound.Furthermore,one ring and two ring aromatic compounds showed highest percentage in PZL than PZL-Ca(OH)2as a temperature increase from 700°C to 1000°C.On the other hand,in PZL-Ca(OH)2,the percentage of three ring aromatic compounds is not found at the lower temperature,and it increases as temperature increases from 800 °C to 1000 °C.The results of GC/MS measurement shows that most aliphatic compounds produce at a lower temperature,as temperature increase the amount of aromatic compound also increases.
3.5.Mass balance of pyrolysis product

Fig.10.Pyrolysis product distribution at different temperature(a)PZL(b)PZL-Ca(OH)2.

Fig.11.Carbon conversion of char obtained by TGA at 800°C,900°C,and 1000°C.
The total mass of all pyrolysis products is shown in Fig.10.The amount of pyrolysis volatile product increases and the yield of char reduces with increasing pyrolysis temperature for both PZL and PZL-Ca(OH)2.For PZL,the increase in pyrolysis gas from 27%to 39%and char reduce from 61%to 56%as temperature increase from 600°C to 1000°C in PZL coal.In PZL-Ca(OH)2,pyrolysis gas increase from 24%to 40%and char reduce from 63%to 55%as temperature increased from 600°C to 1000°C.The maximum tar yield for PZL and PZL-Ca(OH)2samples were found at 800°C and 700°C respectively.The reason for the drop in tar product above these maximum temperatures is that the complex tar molecules begin to convert to smaller chain molecules thermolytically.However,in previous studies,the maximum tar yield was obtained at a temperature range of 500 °C and 550°C[30].Similarly,a study by Jmail et al.[31]stated that the highest production of tar should be found at a temperature below 600°C.During pyrolysis,low temperature helps to release light molecules due to cleavage of the weak bond,then as temperature increases,the cleavage of macromolecular network releases more gases,and further,gases are converted into the tar[22,23,32,33].Consequently,first tar increases up to maximum yield then decreases due to the secondary reaction.
3.6.Carbon conversion and reactivity index of char sample
Fig.11(a)shows the carbon conversion as a function of time at different temperature(800°C,900°C,and 1000°C)for char sample.It is clear from Fig.11(a)that increasing the temperature reduces the time needed for carbon conversion.The minimum time required is 4.5 min for 100%carbon conversion which is achieved in PZL-Ca(OH)2-1000°C at 1000°C TGA temperature.The maximum time required for carbon conversion was around 60 min at PZL-800°C at 800°C TGA temperature.From the above discussion,the temperature and catalyst have significant impacts during gasification.However,Fig.11(b)shows the reactivity index at 50%carbon conversion achieved,the maximum and minimum reactivity index are found for PZL-Ca(OH)2-1000 °C and PZL-1000°C at 1000°C and 800°C temperature,respectively.
4.Conclusions
Our experimental results demonstrate that the pyrolysis of PZL with Ca(OH)2catalyst have a significant impact on releasing volume of gas at a temperature range of 600°C to 1000°C as compared to PZL.The surface characterizations reveal that the specific surface area and pore volume of catalyzed coal rises as temperature increases up to 1000 °C.However,the surface of PZL is smooth and no crystalline structure was found,while PZL-Ca(OH)2has a relatively rough surface covered with many filamentous structures.Additionally,the GC-MS measurements indicate that aliphatic,one ring and two ring aromatic compounds have less percentage in PZL-Ca(OH)2than PZL.Furthermore,the yield of pyrolysis gas increased and char yield decrease with increasing temperature in PZL-Ca(OH)2.In PZL-Ca(OH)2,pyrolysis gas increases from 24% to 40% and char decrease from 63% to 55% with increasing temperature from 600 °C to 1000 °C.The maximum tar yield for PZL-Ca(OH)2was found 10%at 700°C which is higher than PZL.The maximum carbon conversion and reactivity index during gasification was found at PZL-Ca(OH)2at 1000 °C TGA temperature.Therefore,Ca(OH)2loaded into the coal can become an active catalyst for the pyrolysis as well as for gasification of the char.
Supplementary Material
Supplementary data to this article can be found online at https://doi.org/10.1016/j.cjche.2019.05.013.
杂志排行

Chinese Journal of Chemical Engineering的其它文章
- Scaling of the bubble/slug length of Taylor flow in a meandering microchannel☆
- Analyzing of mixing performance determination factors for the structure of radial multiple jets-in-crossflow☆
- Particle-resolved simulation of packed beds by non-body conforming locally refined orthogonal hexahedral mesh☆
- Visual study on the characteristics of liquid and droplet in a novel rotor-stator reactor☆
- Molecular dynamics simulation of supercritical CO2microemulsion with ionic liquid domains:Structures and properties☆
- Modeling bubble column reactor with the volume of fluid approach:Comparison of surface tension models☆