Characterization of Loading Rate Effects on the Interactions Between Crack Growth and Inclusions in Cementitious Material
2018-12-26ShuaiZhouandXiaoyingZhuang
Shuai Zhou and Xiaoying Zhuang
1 Division of Computational Mechanics,Ton Duc Thang University,Ho Chi Minh City,Vietnam.
2 Faculty of Civil Engineering,Ton Duc Thang University,Ho Chi Minh City,Vietnam.
3 College of Materials Science and Engineering,Chongqing University,Chongqing,China.
4 Leibniz Universität Hannover,Appelstr.11,30167,Hannover,Germany.
Abstract:The microcapsule-enabled cementitious material is an appealing building material and it has been attracting increasing research interest.By considering microcapsules as dissimilar inclusions in the material,this paper employs the discrete element method(DEM)to study the effects of loading rates on the fracturing behavior of cementitious specimens containing the inclusion and the crack.The numerical model was first developed and validated based on experimental results.It is then used to systematically study the initiation,the propagation and the coalescence of cracks in inclusion-enabled cementitious materials.The study reveals that the crack propagation speed,the first crack initiation stress,the coalescence stress,the compressive strength and the ultimate strain increase with the loading rate.The initiation position,the propagation direction,the cracking length and the type of the initiated cracks are influenced by the loading rates.Two new crack coalescence patterns are observed.It is easier to cause the coalescence between the circular void and a propagating crack at a slow loading rate than at a fast loading rate.
Keywords:Microcapsule,loading rate,cracking processes,DEM,compressive loading.
1 Introduction
White et al.[White,Sottos,Geubelle et al.(2001)] proposed the idea of recovering material properties automatically by using embedded microcapsules and it has been attracting increasing research interest.A propagating crack breaks the shell of microcapsules and the healing agent flows out,which leads to partial or complete crack closure progressively.Although much experimental and theoretical research has been conducted on the microcapsule-enabled cementitious material [Zhu,Zhou,Yan et al.(2015a); Zhu,Zhou,Yan et al.(2015b); Zhu,Zhou,Yan et al.(2016); Zhou,Zhu,Ju et al.(2017); Quayum,Zhuang and Rabczuk(2015)],the loading rate effect of the breakage of microcapsules in cementitious materials due to cracking is not well understood.Advanced computational modeling of cementitious materials such as concrete presented previously [Rabczuk and Belytschko(2006); Rabczuk,Akkermann and Eibl(2005);Rabczuk and Belytschko(2004); Rabczuk,Zi,Bordas et al.(2008); Rabczuk,Bordas and Zi(2010); Rabczuk,Zi,Bordas et al.(2010)] is an interesting route to understand the fracture process in such materials.The microcapsules and microcracks are shown by the scanning electron microscope(SEM)picture in Fig.1(a)[Zhou,Zhu,Yan et al.(2016)].The shell is made of brittle materials,which is weak and easily broken [Yang,Hollar,He et al.(2011); White,Sottos,Geubelle et al.(2001)].It can be assumed that the microcapsule breaks if a crack propagates to the surface of the microcapsule.In this way,a microcapsule in cementitious materials can be simply treated as a circular inclusion without including the stiffness of the shell and the breakage of microcapsules is simply related to the coalescence between the circular void and a propagating crack [Zhou,Zhu,Yan et al.(2016)].So this paper studies the fracturing behavior of cementitious specimens containing one circular void and one pre-existing crack at different loading rates as depicted in Fig.1.
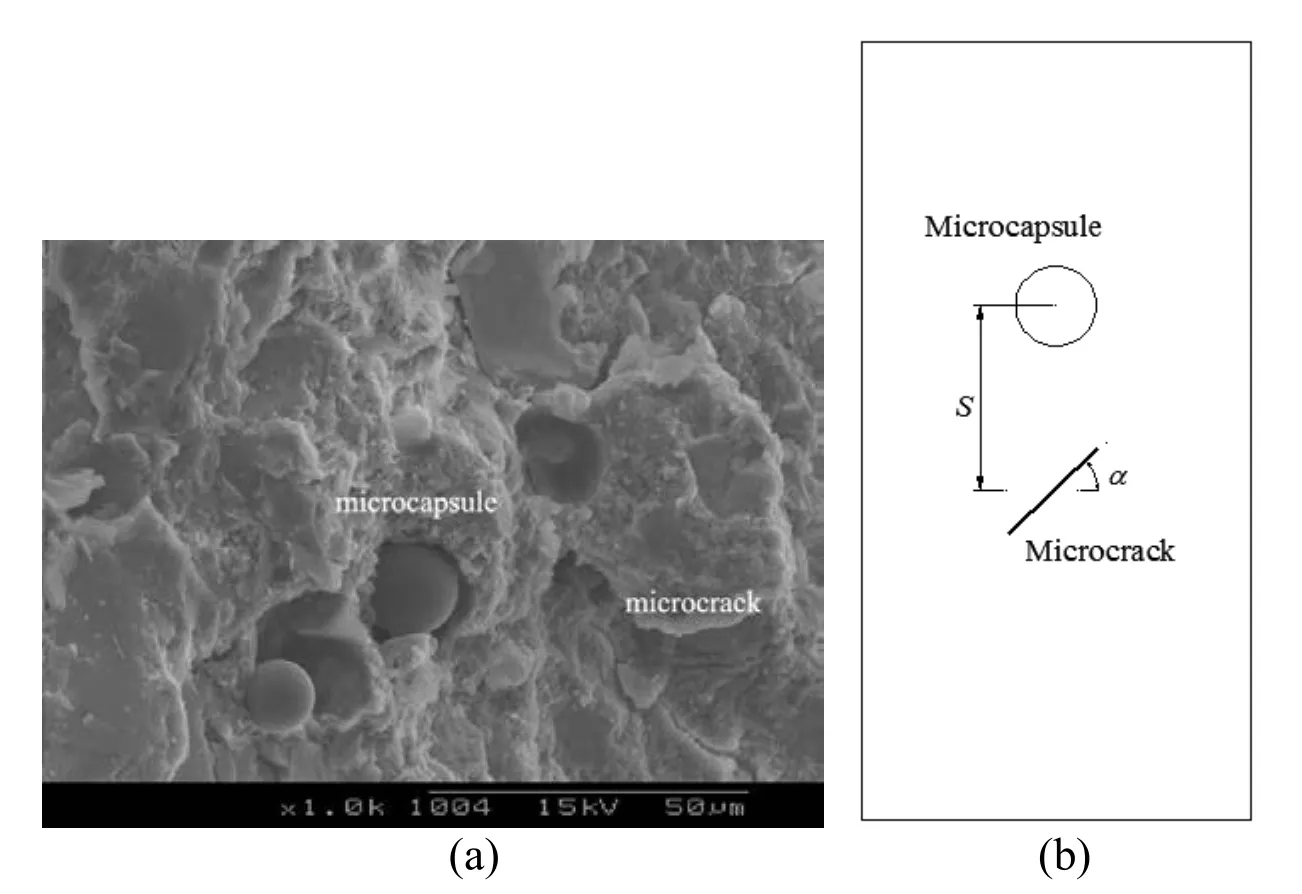
Figure 1:A specimen containing microcapsules and microcracks
The direct tensile tests of brittle materials are faced with difficulties in the experimental tests due to the difficulty in controlling the boundary conditions without including local failure [Perras and Diederichs(2014)].On the other hand,in engineering applications,the compressive test for concrete is more generally carried out and of interests in design.Though experimental research has been conducted for brittle materials containing preexisting cracks [Wong and Einstein(2009a); Wong and Einstein(2009b); Lee and Jeon(2011)],very limited experimental research has been done on brittle materials containing a crack and a circular void.The interactions between a crack and a pore were studied experimentally [Κranz(1979)] and theoretically [Lee and Ju(2007)].However,the cracking process was not analyzed.The cracking process of specimens containing a hole was examined using uniaxial compression tests in some papers [Carter,Lajtai and Petukhov(1991)],and the influence of pre-existing cracks was neglected.Previous research investigated the interaction between a hole and a pre-existing crack [Zhou,Zhu,Yan et al.(2016)],while the loading rate effects were ignored.The strengths of the brittle materials were found remarkably dependent on the loading rates and increasing with the loading rates [Olsson(1991)].Similarly,the fracture toughness was increased with the loading rates [Zhang and Zhao(2013); Dai,Xia,Zheng et al.(2011); Rabczuk and Belytschko(2007)] as well as the ductility and the degree of fragmentation [Jackson,Κingman,Whittles et al.(2008)].The cracking phenomena of materials [Hamdia,Silani,Zhuang et al.(2017); Nanthakumar,Lahmer,Zhuang et al.(2016); Vu-Bac,Lahmer,Zhuang et al.(2016); Zhuang,Huang,Rabczuk et al.(2014)] have been investigated widely including efficient remeshing techniques [Areias,Reinoso,Camanho et al.(2018); Areias and Rabczuk(2017); Areias,Rabczuk and Msekh(2016); Areias,Msekh and Rabczuk(2016); Areias,Rabczuk and Camanho(2014); Areias,Rabczuk and Dias-da-Costa(2013);Areias and Rabczuk(2013); Anitescu,Hossain and Rabczuk(2018)],phase field methods[Badnava,Msekh,Etemadi et al.(2018); Msekh,Cuong,Zi et al.(2017)],multiscale methods for fracture [Budarapu,Gracie,Bordas et al.(2014); Budarapu,Gracie,Yang et al.(2014); Talebi,Silani and Rabczuk(2015); Talebi,Silani,Bordas et al.(2014)],peridynamics [Ren,Zhuang and Rabczuk(2017); Ren,Zhuang,Cai et al.(2016)],DEM[Zhou,Zhu,Ju et al.(2017); Zhang and Wong(2013a); Zhang and Wong(2013b);Ghazvinian,Sarfarazi,Schubert et al.(2012)],meshfree methods [Amiri,Milan,Shen et al.(2014); Amiri,Anitescu,Arroyo et al.(2014); Rabczuk,Gracie,Song et al.(2010);Rabczuk,Areias and Belytschko(2007); Zhuang,Cai and Augarde(2014); Zhuang,Zhu and Augarde(2014)],the phantom node method [Chau-Dinh,Zi,Lee et al.(2012)],the smooth extended finite element method [Chen,Rabczuk,Bordas et al.(2012)] as well as other partition of unity based methods like the extended isogeometric analysis [Ghorashi,Valizadeh,Mohammadi et al.(2015); Nguyen-Thanh,Valizadeh,Nguyen et al.(2015);Nguyen-Xuan,Liu,Bordas et al.(2013)].Many numerical methods(e.g.the extended finite element method and meshfree methods)have difficulties with modeling the complex crack propagation.They require a fracture criterion to determine the crack orientation and the crack length.Furthermore,reliable criteria for crack branching and crack interactions are required.It is also difficult to distinguish between crack nucleation and crack propagation.These difficulties can be solved in DEM.The Particle Flow Codes(PFC2D and PFC3D)are among the widely used DEM for studying the fracture behavior in brittle materials.The basic idea is to treat a studied material as an assembly of bonded particles that follow the law of motion.In this way,the formation of cracks is simulated by the breakage of bonds between adjacent particles [Potyondy and Cundall(2004); Itasca(2004)].The major advantage of DEM is that the complex empirical constitutive behavior can be replaced by the simple particle contact logic.Furthermore,criteria for crack branching and crack interactions are not required,while the Newton’s laws of motion are adopted.The continuous material in DEM is discretized by particles.The macro mechanical properties and the cracking behavior are determined by the movement of particles.There are many contact constitutive models.If the tensile force or the shear force is greater than the bond strength,the bond breaks.A damping force Fdadded to the contact force can be considered in PFC2D for the loading rate effect.More details about the DEM can be found in previous literature [Itasca(2004)].DEM can simulate the crack nucleation and the crack propagation well [Zhang and Wong(2012)].PFC2D has been applied to study the cracking process of brittle materials containing a single [Zhang and Wong(2012)] and two pre-existing flaw(s)[Zhang and Wong(2013a)] under uniaxial compressive loading.It has been proved that PFC2D can be used to study the loading rate effect on the cracking process of flawed specimens under uniaxial compressive loading [Zhang and Wong(2013b); Xie,Guo and Xia(2012)].The damping effect and the inertia effect of cementitious materials under dynamic loading can be considered in PFC2D [Itasca(2004)].
This paper systematically studies the crack behavior of cementitious materials containing a circular hole and a pre-existing crack at different loading rates,in order to better understand the loading rate effects on the microcapsule-enabled cementitious material.Section 2 describes the experimental work to provide the data for the calibration and the validation of the DEM model.The development of the DEM model and the procedure for the numerical study are detailed in Section 3.Section 4 is devoted to the representative experimental and numerical simulation results and compares in detail the cracking process of specimens containing a circular hole and a pre-existing crack under uniaxial compression at different loading rates.The effect of different factors on the cracking process of specimens containing a circular hole and a pre-existing crack at different loading rates is discussed in Section 5 based on the numerical analysis results.Finally,Section 6 summarizes the key findings of the present study and suggestions for further studies.
2 Experimental studies
In order to provide the data for the parameters study and the validation of the DEM model used for studying the loading rate effects of cementitious specimens,the following experiments were carried out.The cementitious specimen was prepared using a mixture of cement(22%),sand(67%)and water(11%)in mass.The cement used No.42.5 ordinary Portland cement and the sand was normal river sand with particle sizes smaller than 2.5 mm.Only fine aggregate was used to ensure the uniformity of the specimens.Cylindrical specimens were produced and cured at 95% relative humidity(RH)for 28 days and then tested to obtain the elastic modulus,Poisson’s ratio and the unconfined compressive strength(UCS)of the cementitious material.Tab.1 shows the average values from five tests.
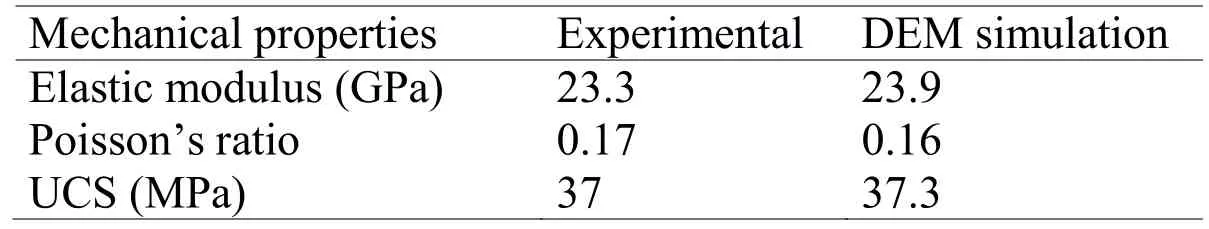
Table 1:Macro mechanical properties of materials from experiments and DEM simulations
The specimens are made 140 mm long,70 mm wide and 35 mm thick with each of them containing a circular hole and a pre-existing crack following the procedure in Zhuang et al.[Zhuang,Chun and Zhu(2014)] with minor modifications.Fig.2(a)shows the special mold used for casting the specimens.The manufacturing process of specimens can be found in the previous work of the authors [Zhou,Zhu,Yan et al.(2016)],including the installation of metallic shims,blending of cement mortar,the removal of metallic shims,the drilling of the hole and curing.The produced specimen during compression tests is presented in Fig.2(b).

Figure 2:The mold used for producing specimens and the produced specimen
The compression tests comprise two sets of specimens.The first set of specimens was tested at a slow deformation rate of 0.03 mm/min in order to minimize the effect of loading rates on the cracking behavior [Zhou,Zhu,Yan et al.(2016)].The second set of specimens was compressed at a fast loading rate of 3.0 mm/min to study the loading rate effects on the cracking behavior of inclusion-enabled specimens under uniaxial compression.The experiment was conducted and the deformation was measured by the MTS device.The cracking process of the specimens was recorded by a video camera.
3 Numerical modeling
In the first step,DEM specimens with no hole or crack were generated following the procedure described in detail by Itasca [Itasca(2004)],including the generation of particles,packing of particles,the application of a low isotropic stress,the elimination of floating particles,and the assignment of microscopic properties to both the particles and the bonds between them.The specimen was 140 mm in height and 70 mm in width which is the same as those used in the experiments and is composed of about 30,000 particles.The number of particles is close to that in previous research [Zhou,Zhu,Yan et al.(2016);Zhang and Wong(2013a); Zhang and Wong(2013b); Zhang and Wong(2012)].The particle radii varied from 0.25 mm to 0.415 mm and followed a normal particle size distribution.The particles were chosen as small as possible without compromising the computational efficiency and significantly increasing the computation time [Ghazvinian,Sarfarazi,Schubert et al.(2012)].The parallel bond model was adopted in this paper to describe the bond between particles [Zhou,Zhu,Yan et al.(2016)].The parallel bond model approximates the physical behavior of a cement-like substance joining the two adjacent particles,which resists the moment induced by particle rotation or shearing within the bonded area,as is shown in Fig.3.The tensile and shear stresses acting on the parallel bond periphery are calculated from the beam theory.If the maximum tensile stress exceeds the tensile strength of the parallel bond or the maximum shear stress exceeds the shear strength of the parallel bond,the parallel bond breaks.Bond breakage results in stiffness reduction.Bond stiffness is instantaneously removed when a bond breaks,while the contact stiffness is still active as long as particles stay in contact.The parallel bond model can simulate the brittle material well [Zhou,Zhu,Yan et al.(2016);Zhang and Wong(2013a); Zhang and Wong(2013b); Zhang and Wong(2012)].The damping effect and the inertia effect of cementitious materials under the dynamic loading can also be considered in the parallel bond model [Itasca(2004)].More details about the parallel bond model can be found in previous literature [Itasca(2004)].
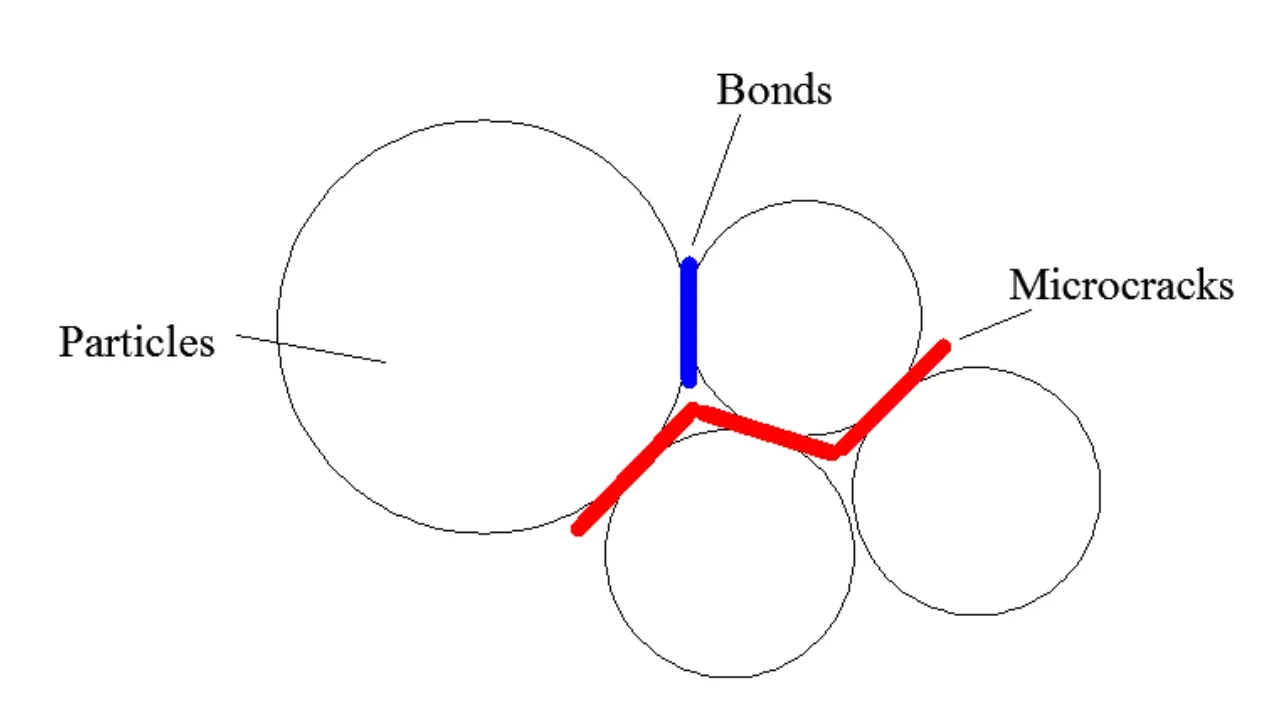
Figure 3:The parallel bond,microcracks and the macrocrack which is formed when three or more microcracks are connected
The microscopic properties of the particles and the parallel bonds were determined following the default calibration procedure in PFC2D [Itasca(2004)].Firstly,match the Young’s modulus by setting material strengths to a large value and varying the particle modulus Ecafter a few iterations.Then match the Poisson’s ratio by varying the ratio of particle normal to shear stiffness kn/ks.Finally,match the peak strength,the crackinitiation stress and other parameters in a similar way.More details can be found in previous research [Itasca(2004)].To conduct numerical uniaxial compression tests using the generated specimen,the top and bottom frictionless walls were moved toward each other at a specified velocity [Ding,Zhang,Zhu et al.(2014)].To simulate the measured cementitious material properties(elastic modulus,Poisson’s ratio and UCS)listed in Tab.1,the microscopic properties of the particles and the parallel bonds were calibrated in an iterative procedure [Zhou,Zhu,Yan et al.(2016)].The microscopic properties were determined as shown in Tab.2.
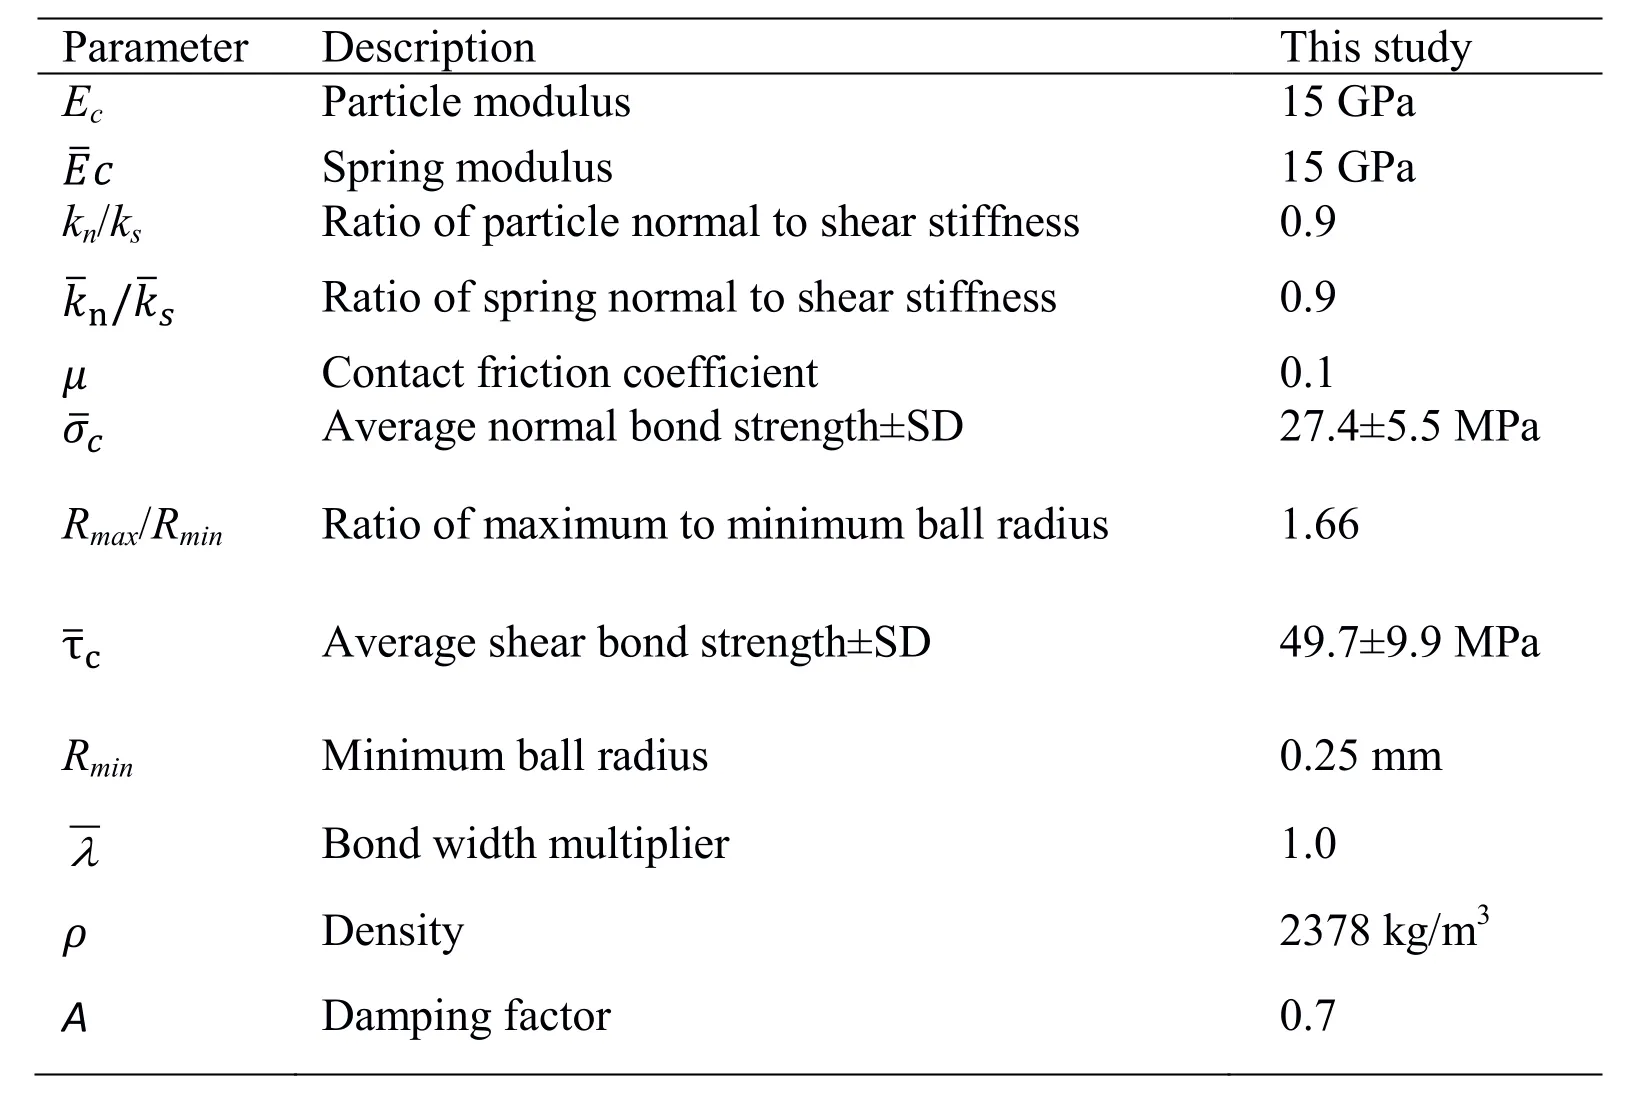
Table 2:Microscopic parameters used in DEM model
After the DEM model was generated,specimens containing a circular hole and a preexisting crack were produced by eliminating certain particles in the model.The diameter of the hole was 8 mm,and the length and the thickness of the pre-existing crack were 30 mm and 1 mm,respectively [Zhou,Zhu,Yan et al.(2016)].To investigate the effect of the relative locations of the circular hole and the pre-existing crack on the cracking behavior,two lengths(denoted as S),i.e.20 mm and 30 mm,and 6 pre-existing crack inclination angles(denoted as α)from 0 to 75° with an increment of 15° were considered.To investigate the loading rate effects on the cracking behavior,five loading rates,i.e.0.01 m/s,0.08 m/s,0.2 m/s,0.6 m/s and 2.0 m/s,were chosen in the numerical simulations.The loading rates referred to the previous work in Xie et al.[Xie,Guo and Xia(2012)] and Zhang and Wong [Zhang and Wong(2013b)].It should be noted that the loading rate in PFC2D was different to the real test [Xie,Guo and Xia(2012)].The corresponding loading rate in PFC2D is much faster than that in real tests.Here,a specimen with a length x and a pre-existing crack inclination angle y was denoted as sxdy [Zhou,Zhu,Yan et al.(2016)].
Generally,random microscopic parameters are adopted in each numerical model and different models have repeatedly run for several times in DEM.Then,the results are compared thoroughly to summarize the general crack behavior [Zhou,Zhu,Yan et al.(2016); Zhang and Wong(2013a); Zhang and Wong(2012)],which can introduce the heterogeneity and randomness to generate outputs comparable with that of natural nonuniform materials.However,in the present study,the goal is to solely reveal the loading rate effects without considering the material heterogeneity.Only one basic model was thus first built.
With the developed DEM specimen containing a circular hole and a pre-existing crack,the uniaxial compression test was conducted and the cracking process was monitored.A microcrack formed when the bond between two adjacent particles was broken.The micro-tensile crack was represented by a red line and the micro-shear crack by a black line.A macrocrack was considered formed when three or more microcracks were connected as illustrated in Fig.3 [Zhang and Wong(2013a)].Each numerical test terminated at a post-peak stress of 0.7 times of the corresponding peak stress [Zhou,Zhu,Yan et al.(2016)].
4 Loading rate effects on cracking behavior
The section compares the experimental and numerical simulation results of representative specimens containing a circular hole and a pre-existing crack at the experimental loading rate of 3.0 mm/min,aiming to further validate the DEM model and describe the cracking process of specimens containing a circular hole and a pre-existing crack at different loading rates in detail.
The cracking process of the specimen s30-d30 is presented in Fig.4.The top row contains the snapshots from the experiment at the moment when the first crack initiates,the secondary crack initiates,and the cracks initiate at the peak load,respectively.Here,the first crack and the secondary crack are distinguished by their sequence [Wong and Einstein(2009a)].The typical patterns of the first crack and the secondary crack are exhibited in previous research [Wong and Einstein(2009b)].The bottom row contains the images captured from the numerical simulation when the loading rate is 0.2 m/s for comparison.The stresses in the parentheses are those corresponding to the specified stages.The relationship of the loading rates between numerical simulations and experiments is based on the same cracking behavior rather than the same loading rate[Zhou,Zhu,Yan et al.(2016); Zhang and Wong(2012)] and the numerical results agree well with the experimental results as shown in Fig.4.
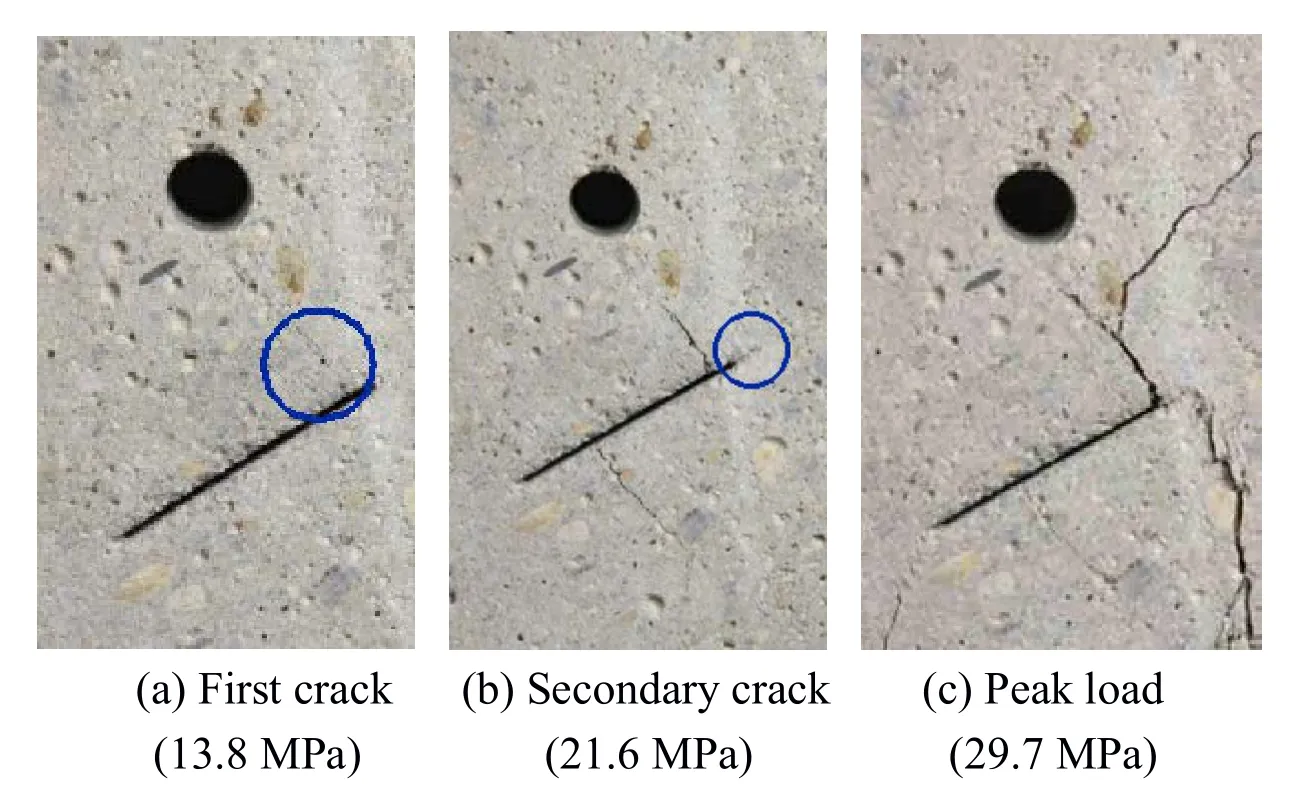
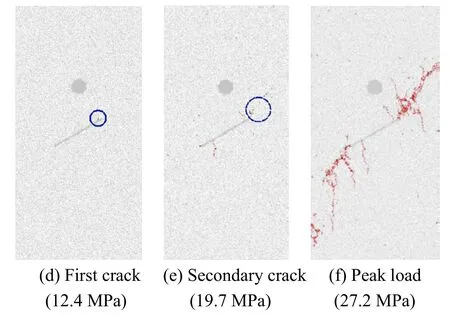
Figure 4:Cracking process based on experimental and numerical simulation results for the specimen s30-d30 at 3.0 mm/min
The macroscopic first crack initiates from the upper surface of the pre-existing crack under a compressive stress of 12.4 MPa in the numerical simulation(Fig.4(d)),which is demonstrated in the blue circle.Comparing Fig.4(a)with the experimental result at 0.03 mm/min [Zhou,Zhu,Yan et al.(2016)],the first crack initiation stress goes up from 10.5 MPa to 13.8 MPa with the loading rate.Almost at the same time,another first crack appears from the lower surface of the pre-existing crack.The microscopic shear cracks appear near the upper(right)pre-existing crack tip,which further develop into macroscopic mixed tensile-shear cracks as the secondary crack in the blue circle under a compressive stress of 19.7 MPa(Fig.4(e)).Comparing Fig.4(b)with the experimental result at 0.03 mm/min [Zhou,Zhu,Yan et al.(2016)],the secondary crack initiation stress rises with the loading rate from 17.6 MPa to 21.6 MPa.The secondary crack covers a larger zone around the pre-existing crack compared to the first crack.In the experiment,the powder as a result of crushed materials is produced and appears on the secondary crack surface,which is a sign of the shear crack around the flaw.The surface of shear cracks is rougher compared with that of tensile cracks.As the load further rises,the upper first crack goes slowly and finally stops.The trajectories of the first cracks at fast loading rates are shorter compared with that at slow loading rates [Zhou,Zhu,Yan et al.(2016)].The cracking velocity is much faster when the loading rate is 3.0 mm/min than that at 0.03 mm/min in the experiments,which agrees with previous research [Gao,Yao,Xia et al.(2015)].When the loading rate is 3.0 mm/min,this period before the secondary crack initiates lasts about several seconds,while the same period lasts several minutes when the loading rate is 0.03 mm/min.The hole is not broken and the coalescence does not happen at 3.0 mm/min.In contrast,the coalescence occurs in the specimen s30-d30 at 0.03 mm/min [Zhou,Zhu,Yan et al.(2016)].At the peak stress of 27.2 MPa,another secondary crack occurs near the upper(right)tip of the pre-existing crack.It is a type III shear crack and extends downward as the load increases to 27.2 MPa(Fig.4(f)).By comparing Fig.4(c)and the experimental result at 0.03 mm/min [Zhou,Zhu,Yan et al.(2016)],the compressive strength goes up with the loading rate from 22.0 MPa to 29.7 MPa.The propagation direction of the secondary crack is also different.The specimen fails suddenly with big sound.Based on the previous experimental and numerical simulation results [Zhou,Zhu,Yan et al.(2016)] and the present research,it can be concluded that the propagation direction,the initiation stress,the cracking length and the coalescence of initiated cracks are all influenced by the loading rates.
5 Parameters study
This section describes and discusses the numerical simulation results of specimens at different loading rates in order to better understand the effect of loading conditions on the fracturing behavior of cementitious specimens containing a circular hole and a preexisting crack.
5.1 Initiation of first cracks
5.1.1 Effect of loading rates
Fig.5 shows the macroscopic first cracks initiated at different loading rates ranging from 0.01 m/s to 2.0 m/s.These macroscopic first cracks consist of dominantly micro-tensile cracks(red color).The limited number of micro-shear cracks(black color),which develop around the tips of the pre-existing flaws,become the initiation position of future secondary cracks.
The lengths and the trajectories of the first cracks at the loading rates ranging from 0.01 m/s to 0.08 m/s are generally similar(Figs.5(a-b)).In other words,the strain-rate effect on the first crack when the loading rate is slower than 0.08 m/s is very limited,which agrees with previous research [Zhang and Wong(2013b)].When the loading rate increases to 0.6 m/s,the length of first cracks becomes short and the number of first cracks goes up from two to three(Fig.5(d)).
When the loading rate is 0.6 m/s,the first crack initiates at almost the same time with secondary cracks.When it becomes 2.0 m/s,the shear cracks,which act as the secondary cracks at slow loading rates,initiate earlier than the tensile cracks and become the first cracks.It means the sequence of initiated cracks may change at different loading rates.With the increasing loading rates,the local stress concentration will increase.Since the time duration during the process is insufficient for the stress to be transferred or redistributed to other positions of the specimen,it will lead to the local microcracks.Finally,the sequence of initiated macrocracks changes.
The loading rate does not influence the first crack initiation angle(the angle from the preexisting crack to the initial segment of the first crack in the clockwise direction).They are almost 90° in Fig.5.
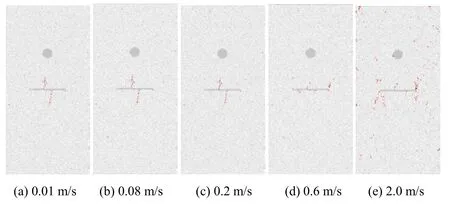
Figure 5:Initiation of macroscopic first cracks in specimens at different loading rates
5.1.2 Effect of inclination angles
The inclination angle of the pre-existing crack influences the cracking behavior of specimens at a slow loading rate [Zhou,Zhu,Yan et al.(2016)].The influence at a fast loading rate of 0.6 m/s is shown in Fig.6.
When the loading rate is 0.01 m/s,all the first cracks occur around the pre-existing crack.Tensile and shear cracks are classified as one of seven crack types which were previously observed and generalized [Wong and Einstein(2009a)].In our previous research,tensile wing cracks are always the first cracks initiated around the pre-existing crack regardless of the pre-existing crack inclination angle.Meanwhile,most of the tensile wing cracks propagate for a certain distance [Zhou,Zhu,Yan et al.(2016)].When the loading rate is 0.6 m/s,in contrast,not all the first cracks initiate around the pre-existing crack as shown in Fig.6.For example,when the inclination angle is 75°,the first crack near the right tip initiates in the specimen at a distance away from the pre-existing crack.Further,tensile wing cracks are not always the first cracks.The properties of the first cracks vary with the pre-existing crack inclination angle.For α≤60°,two or three tensile wing cracks can be observed to initiate around the pre-existing crack as the first cracks.For α=0°,15°,30°and 45°,three tensile wing cracks appear.For α=60°,only two tensile wing cracks are witnessed.For α=75°,no tensile wing crack is observed as the first cracks.Anti-wing shear cracks and shear cracks become the first cracks.Here,the anti-wing shear cracks refer to a special type of shear cracks which have a trajectory like the type III shear crack[Wong and Einstein(2009a)].Some short shear cracks initiate away from the pre-existing crack.Meanwhile,most of the tensile wing cracks have a very short crack length.The initiation points of the tensile wing cracks move from the flaw centers to the flaw tips with the inclination angle α.For α=0°,the initiation points are near the center of the flaw.For α=15° and 30°,they move closer to the flaw tips,but not yet reaching the tips.For α higher than 45°,all of the tensile wing cracks almost initiate at the flaw tips.When the inclination angle is larger than 60°,the hole is easier to be broken at a higher loading rate.
Figure 6:Initiation of macroscopic first cracks in specimens at 0.6 m/s with different inclination angles
The first crack initiation stress at different loading rates with S=30 mm is shown in Fig.7.The first crack initiation stresses at loading rates ranging from 0.01 m/s to 0.08 m/s are very close as shown in Fig.7.When the loading rate goes up to 0.6 m/s,the difference becomes larger.With the rise of loading rates from 0.01 m/s to 2.0 m/s,the average first crack initiation stress raises from 14.8 MPa to 34.9 MPa,which agrees with previous experimental research [Zhang and Zhao(2014)].The first crack initiation stresses go up with the inclination angles,which agrees with previous research [Zhou,Zhu,Yan et al.(2016)].The damping force increases with the loading rates.Hence,the first crack initiation stresses increase.The loading rate effect is relatively more prominent at high loading rates.
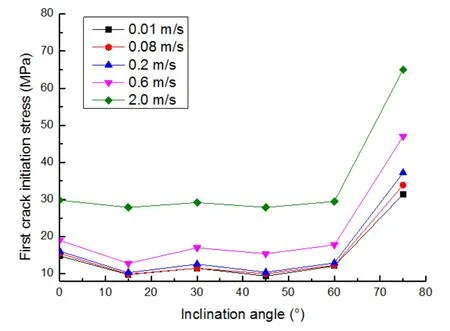
Figure 7:First crack initiation stress at different loading rates with S=30 mm
5.2 Initiation of secondary cracks
5.2.1 Effect of loading rates
Fig.8 shows the cracks at the moment after the secondary cracks initiate in the loaded specimens.The secondary cracks initiate only from flaw tips of the existing flaws at relatively low loading rates ranging from 0.01 m/s to 0.08 m/s.The first crack propagates gradually with the loading rates.More inclined cracks occur in the intact part of the specimen.When the loading rate rises to 0.6 m/s,the micro-cracks become widely distributed in the specimen.The cracks are randomly distributed and additional macroshear cracks initiate at various distances away from the pre-existing crack.
The loading rate influences the number and the type of secondary cracks as well from Fig.8.When the loading rate is 0.01 m/s and 0.08 m/s,there is no anti-wing crack,which agrees with previous literature that under 0.08 m/s the cracking behavior does not change obviously in PFC2D [Zhang and Wong(2013b)].Only a type I shear crack initiates at the left tip of the pre-existing crack [Wong and Einstein(2009a)].However,a type III shear crack initiates when the loading rate goes up to 0.2 m/s.If the loading rate is 0.6 m/s and 2.0 m/s,both the type I shear crack and the type III shear anti-wing crack appear.It means the loading rate can change the type and the propagation direction of cracks.The loading rate does not influence the secondary crack initiation angle(the angle from the pre-existing crack to the initial segment of the secondary crack in the clockwise direction).The initiation angle of the secondary crack near the right tip of the pre-existing crack is almost 180° in Fig.8.
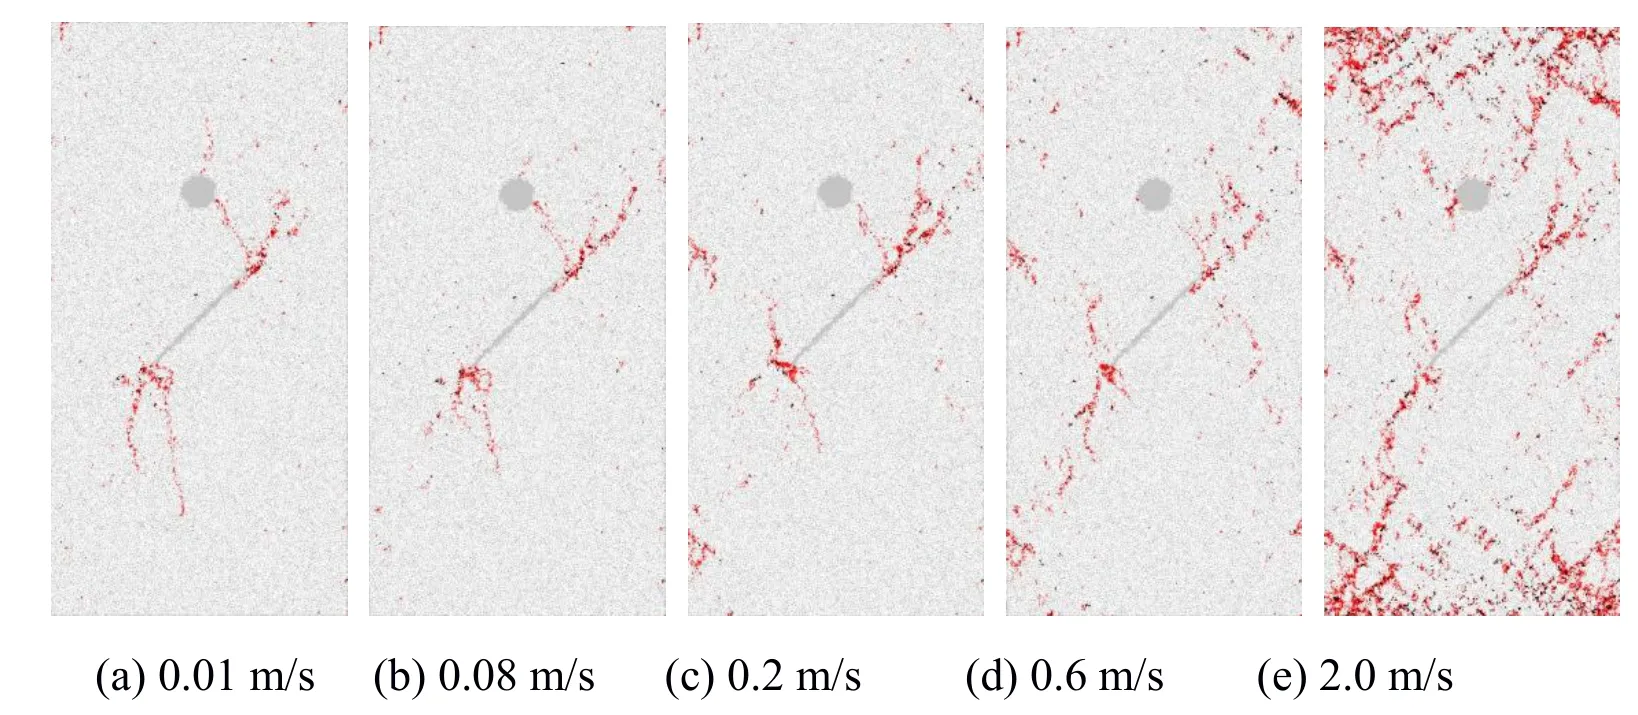
Figure 8:Initiation of macroscopic secondary cracks in specimens at different loading rates
5.2.2 Effect of inclination angles
The initiation of macroscopic secondary cracks in specimens with different inclination angles is exhibited in Fig.9.When the loading rate is 0.01 m/s,the earlier developed tensile wing cracks further propagate [Zhou,Zhu,Yan et al.(2016)].In contrast,when the loading rate is 0.6 m/s,as shown in Fig.9,the cracking behavior is much different,mainly in two aspects.First,the further propagation of the first cracks is limited.Second,the initiation and the propagation of shear cracks around the pre-existing crack are more common,resulting in a higher crack density.It thus leads to a higher degree of fragmentation,which is well documented in the literature [Jackson,Κingman,Whittles et al.(2008)].Many shear microcracks are observed in the specimen for all the tested inclination angles related to the development of secondary cracks.If the inclination angle α is 75°,the secondary crack initiates away from the tip of the pre-existing crack.In contrast,the secondary crack initiates at the tip of the pre-existing crack at a slow loading rate of 0.01 m/s [Zhou,Zhu,Yan et al.(2016)].It means the loading rate can influence the position of initiated cracks.
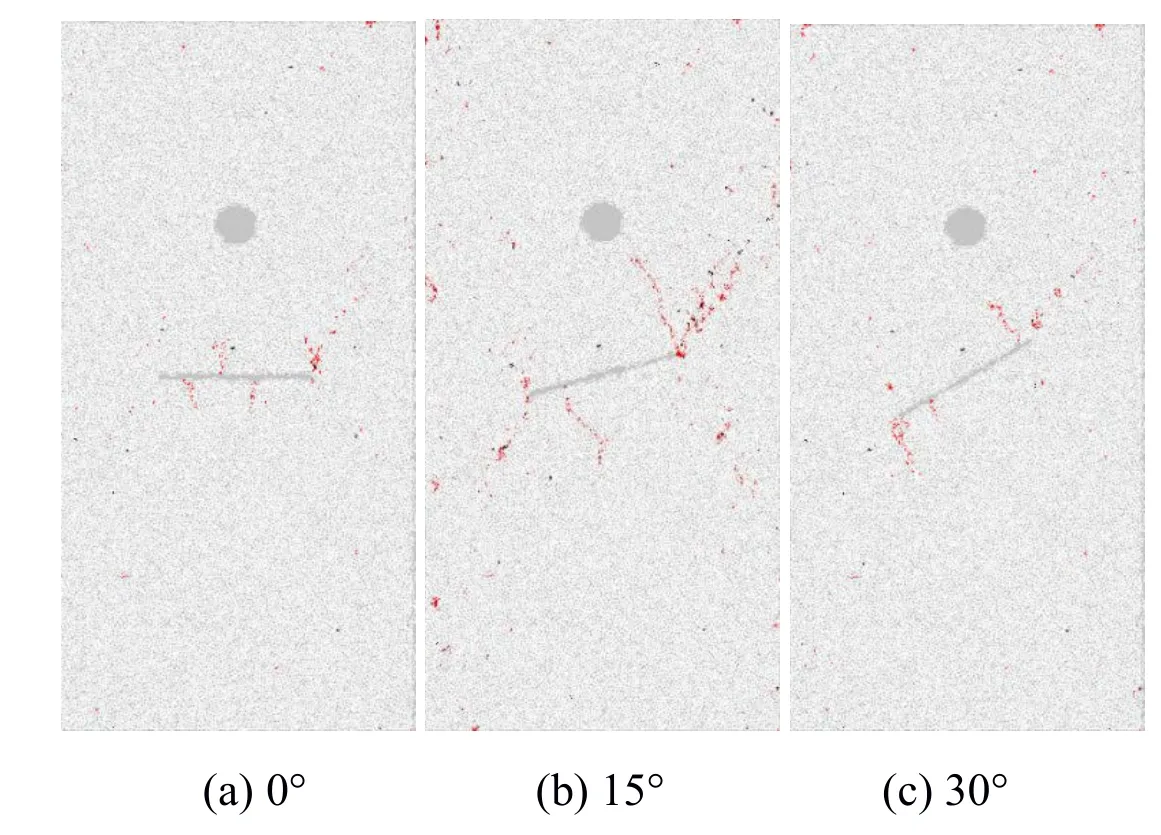
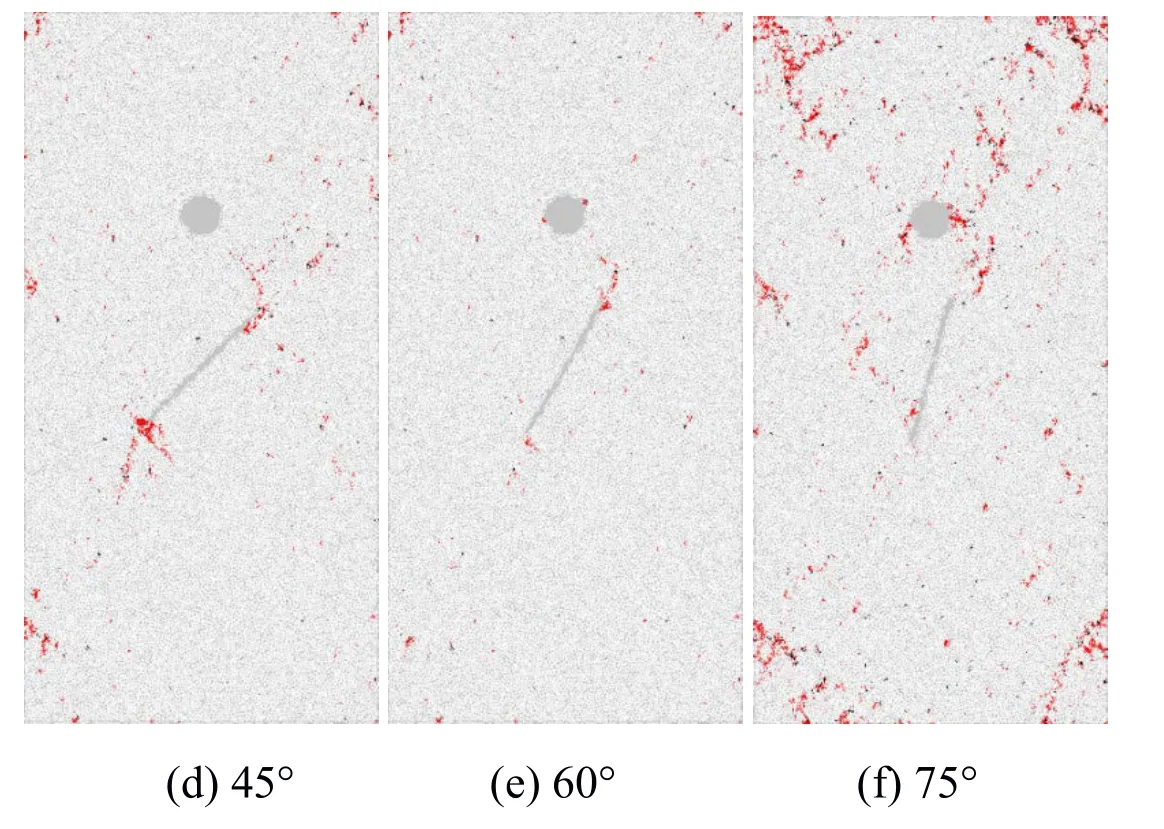
Figure 9:Initiation of macroscopic secondary cracks in specimens at 0.6 m/s with different inclination angles
5.3 Crack propagation and coalescence
5.3.1 Effect of ligament lengths
The ligament length S influences the coalescence behavior of specimens at slow loading rates [Zhou,Zhu,Yan et al.(2016)].Fig.10 shows the coalescence cracks at a fast loading rate of 0.2 m/s.When the ligament length S is 20 mm,30 mm and infinity,the attraction of the hole on the pre-existing crack is presented.Comparing Fig.10a with Fig.10b,it is obvious that if the hole is closer to the pre-existing crack,the width of the coalescence crack is larger.It means that the attraction is greater.Comparing Fig.10b with Fig.10c,it is shown that if the hole is close to the pre-existing crack,the coalescence crack bends from its original trajectory to the hole.Hence,more microcapsules should be added into the cementitious material and thus the distance between the one microcapsule and one microcrack is smaller,which can increase the coalescence probability.
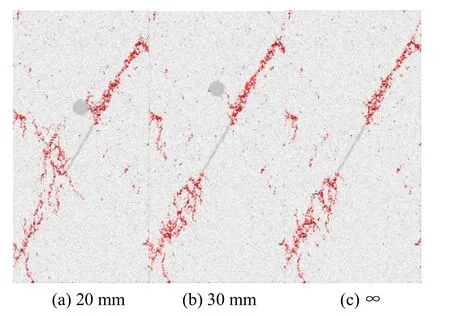
Figure 10:Initiation of coalescence cracks in specimens at 0.2 m/s with a ligament length S of 20 mm,30 mm and ∞,respectively
The initiation of macroscopic coalescence cracks in specimens with a ligament length S of 20 mm,30 mm and ∞ at a fast loading rate of 2.0 m/s is displayed in Fig.11.The ligament length can influence the coalescence types.When the ligament length S is 20 mm,the coalescence crack is a shear crack near the right tip of the pre-existing crack.When the ligament length S is 30 mm,another new type of coalescence is noticed in Fig.11(b).In this new coalescence type,the circular hole and the pre-existing crack are linked up by three macrocracks considering that in our previous research the coalescence crack consists of one macrocrack or two macrocracks [Zhou,Zhu,Yan et al.(2016)].In this new coalescence type,the coalescence happens after the peak stress.
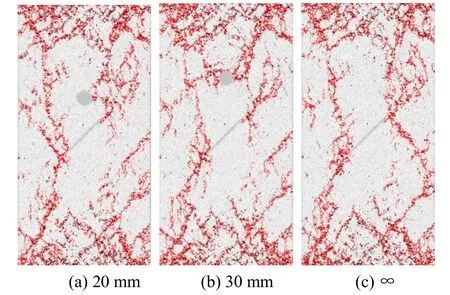
Figure 11:Initiation of macroscopic coalescence cracks in specimens at 2.0 m/s with a ligament length S of 20 mm,30 mm and ∞,respectively
5.3.2 Effect of loading rates
The initiation of coalescence cracks in specimens with different loading rates is exhibited in Fig.12.The coalescence cracks in the bridge area consist of dominantly short tensile crack segments at relatively low loading rates ranging from 0.01 m/s to 0.08 m/s.When the loading rate rises above 0.2 m/s,the coalescence cracks consist of dominantly macroshear bands if the coalescence occurs.When the coalescence happens,the length of first cracks is limited,while the length of secondary cracks is much longer at a higher loading rate.The shear cracks exist randomly in the specimen.Comparing Figs.12(a)~12(d),it is more difficult to cause the coalescence with a higher loading rate.The coalescence cracks are mainly shear cracks when the loading rate goes up to 2.0 m/s since the tensile cracks are suppressed.At the same time,the length of the coalescence crack increases and it becomes scattered.When the loading rate is 2.0 m/s,many inclined shear cracks are initiated and the hole breaks itself.Micro-shear cracks are witnessed on the left and right side of the hole due to compression.The breaking mechanism of the hole totally changes considering that the hole is broken by the coalescence cracks when the loading rate is slow [Zhou,Zhu,Yan et al.(2016)].
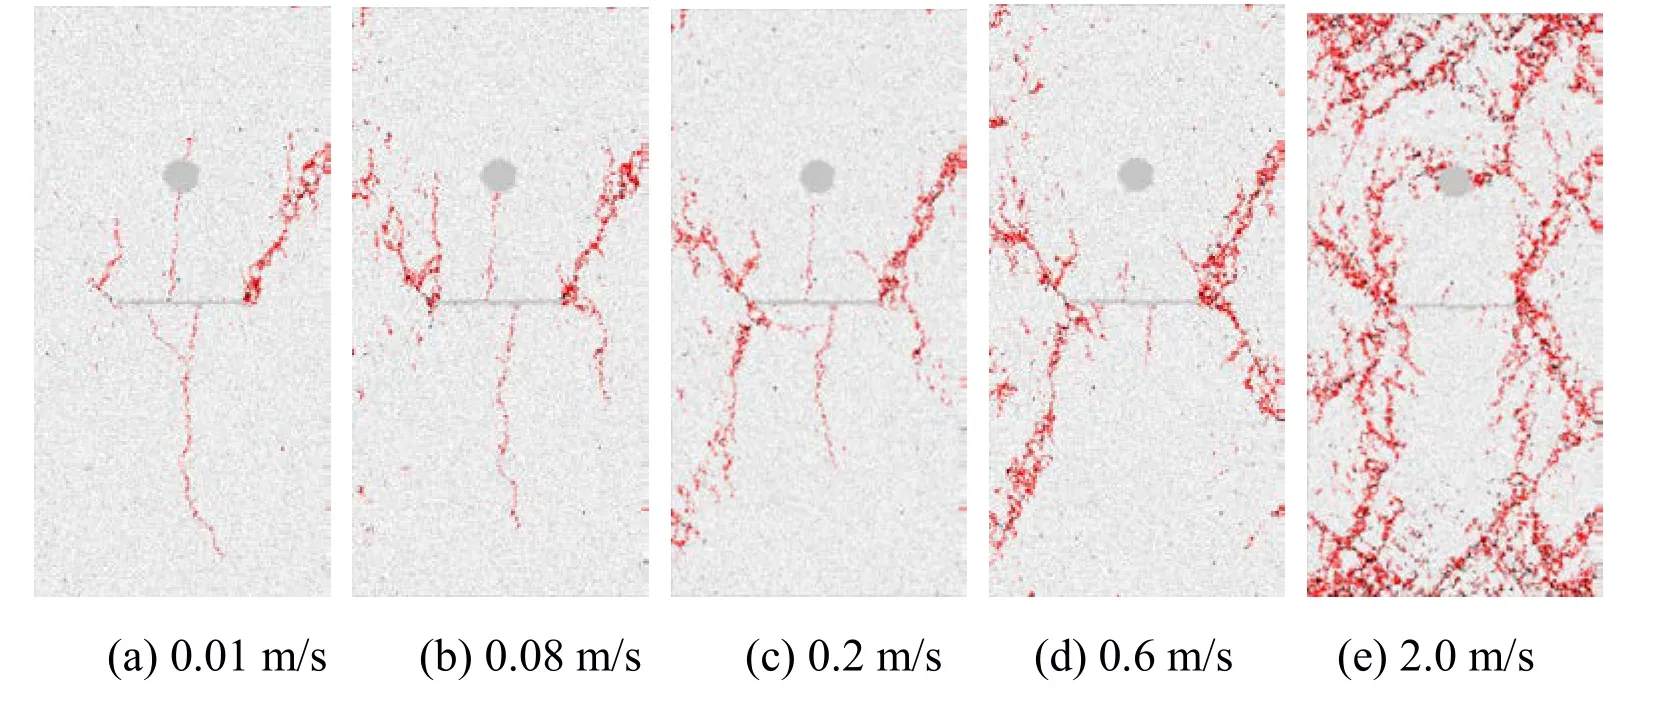
Figure 12:Initiation of coalescence cracks in specimens at different loading rates
5.3.3 Effect of inclination angles
The inclination angle of the pre-existing crack influences the cracking behavior of specimens at a slow loading rate [Zhou,Zhu,Yan et al.(2016)].The influence at a fast loading rate is illustrated in Fig.13.
When the loading rate is 0.01 m/s,the coalescence happens mainly due to the tensile coalescence crack.If the inclination angle is 0°,the coalescence belongs to the type III tensile crack coalescence [Zhou,Zhu,Yan et al.(2016)].If the inclination angle is 15°,30° and 60°,the coalescence belongs to the type I tensile crack coalescence [Zhou,Zhu,Yan et al.(2016)].If the inclination angle is 75°,the coalescence belongs to the type II tensile crack coalescence [Zhou,Zhu,Yan et al.(2016)].When the loading rate is 0.6 m/s,in contrast,the coalescence does not happen if the inclination angle is lower than 60° as shown in Fig.13.When the inclination angle is 60° and 75°,the coalescence occurs and the coalescence crack is a shear crack.This is a new type of coalescence considering that in our previous research coalescence cracks are tensile cracks at slow loading rates [Zhou,Zhu,Yan et al.(2016)].Comparing Fig.13 with previous research [Zhou,Zhu,Yan et al.(2016)],the mode of coalescence cracks changes from tensile segments-dominant to shear-band-dominant when the loading rate increases.With a low inclination angle,the tensile crack is suppressed and does not propagate.Hence,in some cases the coalescence does not happen.
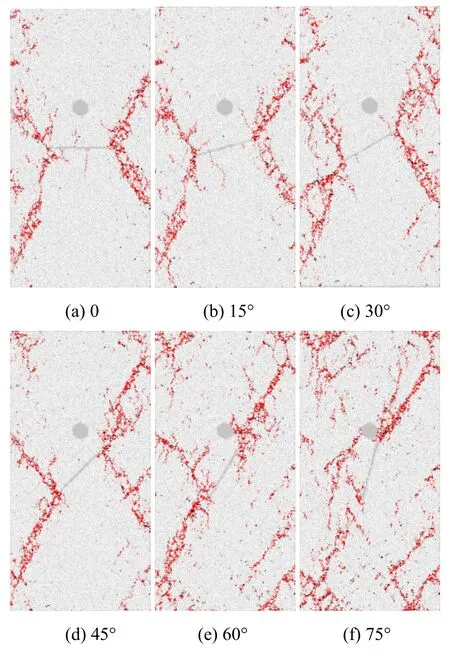
Figure 13:Initiation of macroscopic coalescence cracks in specimens at 0.6 m/s with different inclination angles
The coalescence stress at different loading rates with S=20 mm is presented in Tab.3.For each inclination angle α,a general increase of the coalescence stress with the rise of loading rates is observed in the cases of coalescence occurring before or at the peak stress.Further,at a faster loading rate,the coalescence does not occur in many cases.Hence,it is easier to cause the coalescence between the circular void and a propagating crack at a slow loading rate than at a fast loading rate.
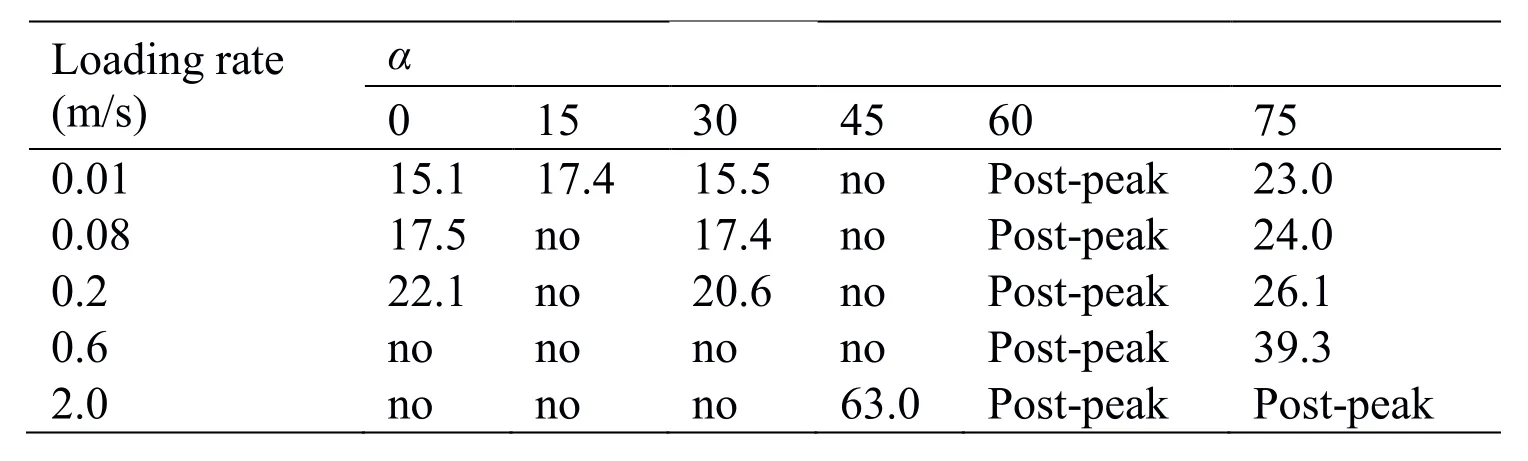
Table 3:Coalescence stress(in MPa)at different loading rates with S=20 mm
5.4 Final failure
5.4.1 Effect of loading rates
The failure modes of the specimens are also carefully examined to reveal the influence of loading rates and flaw configurations as shown in Fig.14.With the ascending loading rates,the damaged area increases.The specimen tends to fail in the shear mode.Many secondary cracks initiate at different positions of the specimens,not only from the flaw periphery.At a fast loading rate,the propagation direction of the pre-existing crack changes in Fig.14.With different loading rates,the cracking path changes.
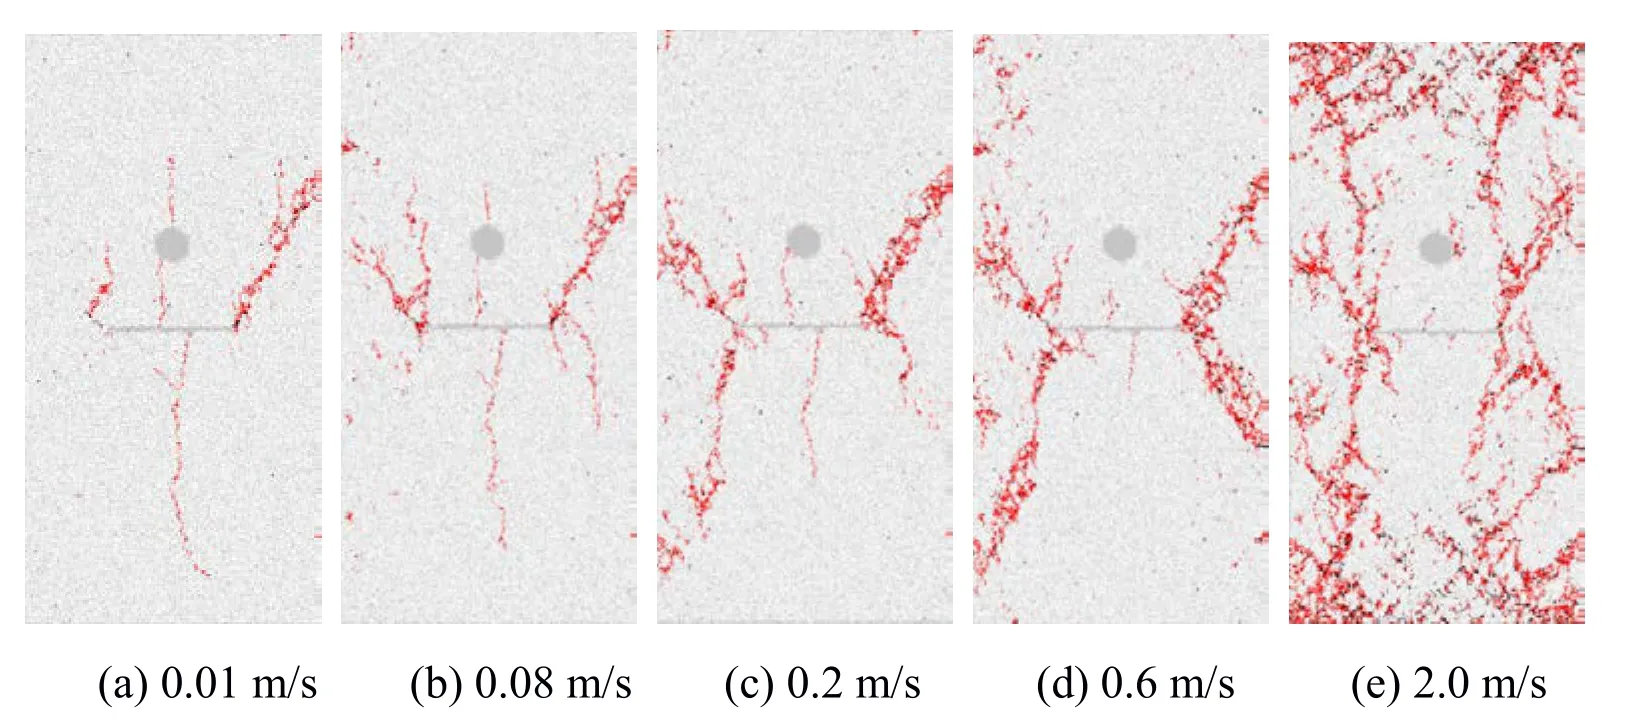
Figure 14:The failure in specimens at different loading rates
The damage degree of a DEM specimen is related to the number of broken springs [Zhou,Zhu,Ju et al.(2017)].The percentage of microcracks is obtained by dividing the number of microcracks by the number of total bonds.The percentage of micro-tensile cracks and micro-shear cracks when the specimens fail is illustrated in Fig.15.As is shown in Fig.15,the percentage of both types of microcracks increases with its loading rate,which agrees with previous research [Zhang,Κou,Yu et al.(1999)].
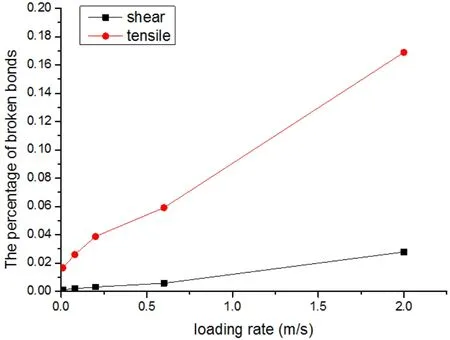
Figure 15:The percentage of tensile cracks and shear cracks in specimens at different loading rates
With the increasing loading rate,the fracture changes from simple fracturing to multiple fragmentations and even to pulverization [Hogan,Rogers,Spray et al.(2012)].The energy term when the s20-d0 specimen fails at different loading rates is demonstrated in Fig.16.The boundary energy is total accumulated work done by all walls on the assembly.From the figure we can know that a large amount of energy has been consumed since the boundary energy decreases greatly compared with the sum of the bond,kinetic and strain energy.The velocity of the fragments rises with the loading rate according to the experimental observation and Fig.16.In addition,it has been found that there is much inner cracking or damage in the fragments,such as branching cracks near the fracture surface [Zhang,Κou,Jiang et al.(2000)] and micro-cracks within the fragments produced at fast loading rates in Fig.14.There are rarely such branching cracks near the fracture surfaces at a slow loading rate.The increase in surface area generated by these cracks is partially responsible for large energy dissipation,which agrees with previous experimental research [Zhang and Zhao(2014); Zhang,Κou,Jiang et al.(2000)].In all,it can be concluded that more energy consumed by the specimen at fast loading rates can be divided into three main parts:more surface energy,more kinetic energy and more energy spent in producing inner cracking damage of the fragments.
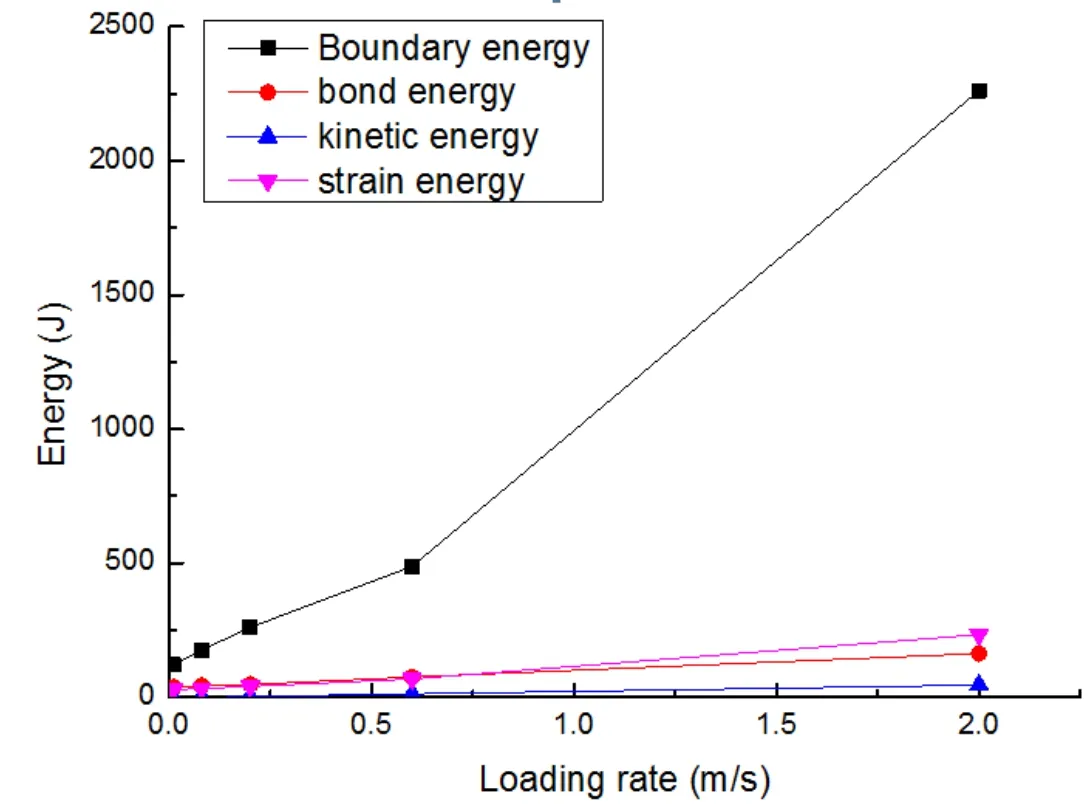
Figure 16:The energy of s20-d0 specimens at different loading rates when it fails
5.4.2 Effect of inclination angles
The final failure modes in specimens with different inclination angles are displayed in Fig.17.When the loading rate is 0.01 m/s,the failure of the specimens is due to the development of the tensile wing cracks and shear macrocracks,which induce a macroscopic tensile-shear failure mode of the specimens containing a hole and a preexisting crack [Zhou,Zhu,Yan et al.(2016)].In contrast,when the loading rate is 2.0 m/s as depicted in Fig.17,the macroscopic failure mode generally shows“X”shape shear crack bands,which are composed of shear cracks,mainly attributed to the development of secondary cracks and some newly initiated short cracks except the specimens containing a α=60° and 75° pre-existing crack.Due to the scattered crack initiation points throughout the specimen when the loading rate is 2.0 m/s,more smaller-sized fragments are produced.Both the size and the proportion of the larger fragments decrease significantly.At relatively lower loading rates,very limited fine fragments are produced,and most of the fragments are relatively large pieces.For the specimens containinga α=60° and 75° pre-existing crack,the crack bands which are composed of shear cracks form a“Y”shape shear failure pattern.The results indicate that shear cracks dominate the failure of the specimens containing a hole and a pre-existing crack at high loading rates.
The compressive strength of the specimens with different inclination angles and loading rates is presented in Fig.18.With the loading rate rising from 0.01 m/s to 2.0 m/s,the compressive strength of the specimens also ascends.The loading rate effect is relatively more prominent at the high loading rate.For the low loading rate as shown in Fig.18,which ranges from 0.01 m/s to 0.08 m/s,the average uniaxial compressive strength only rises slightly from 23.5 MPa to 25.9 MPa.When the loading rate becomes 2.0 m/s,the compressive strength increases significantly to 73.3 MPa,which agrees with previous research [Xie,Guo and Xia(2012); Zou and Wong(2016); Zou,Wong,Loo et al.(2016);Zhang and Zhao(2014)].A steeper pre-existing crack inclination angle leads to a larger compressive stress at different loading rates as shown in Fig.18.
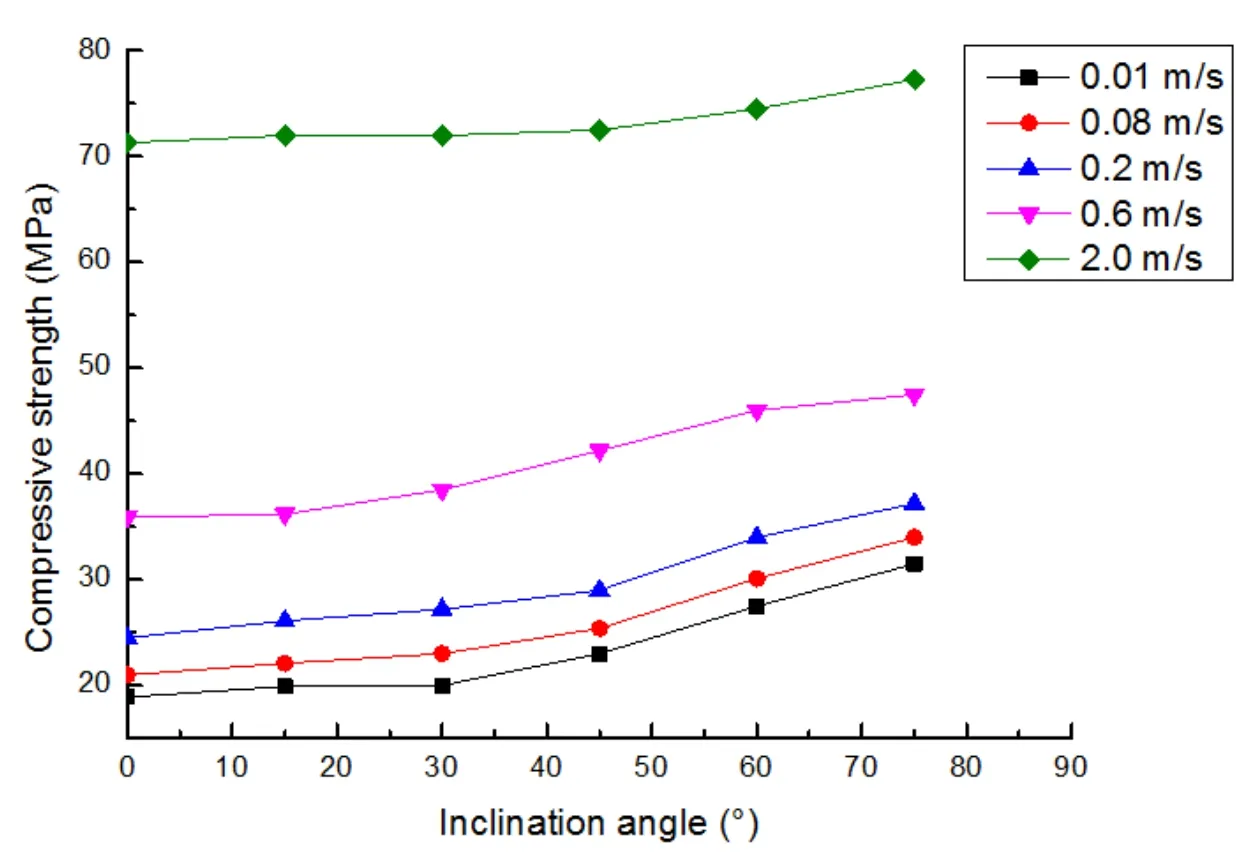
Figure 18:The compressive strength at different loading rates with S=30 mm
For specimens containing a single crack and a hole,the inclination angle and loading rates also have an influence on their ultimate strains(defined as the strain when the corresponding stress is 70% of the peak stress).The ultimate strains of various specimens with S=20 mm are displayed in Fig.19.The ultimate strains of specimens at faster loading rates are always larger than those at slower loading rates regardless of the inclination angle.At fast loading rates,the specimen experiences a large deformation before final failure.The ultimate strains at the loading rate of 2.0 m/s are between 0.00445 and 0.00465,while the ultimate strains at the loading rate of 0.01 m/s are between 0.00115 and 0.00149.This phenomenon indicates that the rising loading rate increases the ductility of specimens.The compressive strength and the ultimate strain of specimens loaded at 2.0 m/s are much higher than those loaded at 0.01 m/s.However,the extent of such loading rate effects varies between these mechanical properties.The average compressive strength at 2.0 m/s is 3.11 times as large as that at 0.01 m/s,while the average ultimate strain at 2.0 m/s is 3.52 times as large as that at 0.01 m/s.With the increase of the inclination angle,the ultimate strain also increases,especially at slower loading rates.
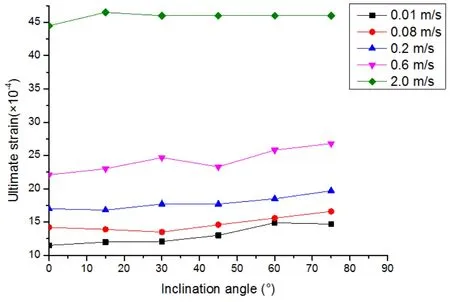
Figure 19:The ultimate strain at different loading rates with S=20 mm
6 Conclusions
This paper studies the cracking processes of specimens containing a circular hole and a pre-existing crack at different loading rates in order to explore the loading rate effects on the microcapsule-enabled cementitious material by using the DEM approach.The cracking behavior of the microcapsule and the pre-existing crack at different loading rates is obtained.The similarities and differences at different loading rates are investigated.Based on the investigation,the following conclusions can be drawn.
(1)The mechanical properties,including the first crack initiation stress,the coalescence stress,the compressive strength and the ultimate strain,of specimens increase with the loading rates.However,the rate-dependence is weak below 0.08 m/s,while it becomes significant when the loading rates rise to 2.0 m/s.The extent of such loading rate effects varies among these mechanical properties.
(2)The loading rates influence the formation and the propagation of first cracks for specimens containing a single flaw and a hole.When the loading rate is 0.01 m/s,the tensile wing cracks are always the first cracks initiated around the pre-existing flaw.In contrast,when the loading rate is 2.0 m/s,the tensile wing cracks are not always the first cracks,and not all the first cracks initiate around the flaw.In some cases,the sequence of initiated cracks changes at fast loading rates.Tensile cracks are suppressed at higher loading rates and the length is short.
(3)The loading rates influence not only the first cracks,but also the secondary cracks.Many secondary cracks initiate at different positions of the specimens at high loading rates,while only a few initiate around the flaw at slow loading rates.The propagation directions and the types of the secondary cracks also vary with the loading rate.The cracking velocity of a crack ascends with the loading rate.
(4)The crack coalescence between the pre-existing crack and the circular hole is influenced by the pre-existing crack inclination angle(α),the length(S)and the loading rates.The crack coalescence patterns depend on the loading rates and two new crack coalescence patterns are observed considering our previous research [Zhou,Zhu,Yan et al.(2016)].If the volume fraction of microcapsules rises,the coalescence probability increases since the distance between one microcapsule and one microcrack reduces.It is easier to cause the coalescence between the circular void and a propagating crack at a slow loading rate than at a fast loading rate.
(5)The failure modes of the specimens at different loading rates are also different.At slow loading rates,the development of the tensile cracks and shear cracks leads to the failure of the specimens.However,at fast loading rates,some shear macrocracks composing the“X”shape crack band or“Y”shape crack band lead to the macroscopic failure.More energy consumed at fast loading rates by the specimen can be divided into three main parts:more surface energy,more kinetic energy and more energy spent in producing inner cracking damage of the fragments.
Acknowledgement:This work was supported by Sofa-Κovalevskaja-Award of Alexander von Humboldt-Foundation.
杂志排行

Computers Materials&Continua的其它文章
- Natural Language Semantic Construction Based on CloudDatabase
- A Method of Identifying Thunderstorm Clouds in Satellite Cloud Image Based on Clustering
- Seed Selection for Data Offloading Based on Social and Interest Graphs
- Dynamic Proofs of Retrievability Based on Partitioning-Based Square Root Oblivious RAM
- A Novel Ensemble Learning Algorithm Based on D-S Evidence Theory for IoT Security
- A Virtual Puncture Surgery System Based on Multi-Layer Soft Tissue and Force Mesh