Functional characterization of a Δ6 fatty acid desaturase gene and its 5′-upstream region cloned from the arachidonic acidrich microalga Myrmecia incisa Reisigl (Chlorophyta)*
2018-12-22ZHANGLi张利CAOHaisheng曹海生NINGPu宁璞ZHOUZhigang周志刚
ZHANG Li (张利) CAO Haisheng (曹海生) NING Pu (宁璞) ZHOU Zhigang (周志刚)
1 Key Laboratory of Exploration and Utilization of Aquatic Genetic Resources Conferred by Ministry of Education, Shanghai Ocean University, Shanghai 201306, China
2 National Demonstration Center for the Experimental Teaching of Fisheries Science, Shanghai Ocean University, Shanghai 201306, China
3 International Research Center for Marine Biosciences Conferred by Ministry of Science and Technology, Shanghai Ocean University, Shanghai 201306, China
Abstract It is suggested that Δ6 fatty acid desaturase (FAD) plays a critical role in the biosynthesis of polyunsaturated fatty acids in plants and microalgae. But why does it adapt to the changed environments such as nitrogen starvation is seldom understood. One Δ6 FAD gene ( MiD6fad) from an arachidonic acidrich microalga Myrmecia incisa Reisigl (Chlorophyta) was first heterologously expressed in Saccharomyces cerevisiae for the identification of function. The fatty acid profile of transgenic yeast detected by gas chromatography-mass spectrometry illustrated that the enzyme MiD6FAD could convert linoleic and αlinolenic acids to γ-linolenic and stearidonic acids, respectively, demonstrating that MiD6fad encoded a Δ6 FAD. A 1 965-bp fragment of the cloned 2 347-bp 5′-upstream region of MiD6fad was next subcloned and fused upstream with green fluorescent protein (GFP) gene to replace the GAL1 promoter of the vector pYES2. The generated construct was transformed into S. cerevisiae for function determination. Confocal microscopic images of the transformed line illustrated that this inserted fragment could drive GFP expression,which was further verified by fluorescence intensity quantification and Western blot analysis using anti-GFP antibody. The conversion efficiency (approximately 2%- 3%) of MiD6FAD was much lower than the reported ω 3 FAD and Δ6 elongase in this microalga, suggesting that MiD6FAD catalysed the possible ratelimiting step for ArA biosynthesis. The presence of several putative cis-acting regulatory elements in this identified promoter sheds new light on the regulation mechanism research of Δ6 FAD transcription for the ArA production in M. incisa in changing environmental factors.
Keyword: arachidonic acid (ArA); fatty acid desaturase (FAD); green fluorescent protein (GFP); green microalga; Saccharomyces cerevisiae; 5′-upstream region (5′-USR)
1 INTRODUCTION
Long-chain polyunsaturated fatty acids (LCPUFAs), for example, arachidonic acid (ArA,20:4Δ5,8,11,14), eicosapentaenoic acid (EPA,20:5Δ5,8,11,14,17), and docosahexaenoic acid (DHA,22:6Δ4,7,10,13,16,19), have received increasing attention for their beneficial effects on human health (Wallis et al., 2002; Leonard et al., 2004; Harwood and Guschina, 2009). There are two main pathways to LC-PUFA biosynthesis in microalgae: the ω-6 pathway and ω-3 pathway (Laoteng et al., 2005;Guschina and Harwood, 2006; Meesapyodsuk and Qiu, 2012). In the first step of the ω-6 pathway,linoleic acid (LA, 18:2Δ9,12), as a precursor in microalgal cells, is desaturated by a Δ6 fatty acid desaturase (FAD) to generate γ-linolenic acid (GLA,18:3Δ6,9,12). Subsequently, the resulting GLA is elongated to dihomo-γ-linolenic acid (DGLA,20:3Δ8,11,14) by Δ6 fatty acid elongase (FAE), and the product is then desaturated by Δ5 FAD to yield ArA.With the help of Δ15 FAD, LA can also be converted to α-linolenic acids (ALA, 18:3Δ9,12,15), thus entering the ω-3 pathway. The produced ALA is further desaturated by Δ6 FAD to yield stearidonic acid(SDA, 18:4Δ6,9,12,15) (Khozin-Goldberg et al., 2016). It is thus accepted that Δ6 FAD plays an important role in the ω-6 and ω-3 pathways for PUFA biosynthesis in microalgae (Nwankwo et al., 2003; Na-Ranong et al., 2005; Wan et al., 2011).
The ability of Δ6 FAD and other FADs to synthesize PUFAs in microalgae and plants varies dramatically depending on changing environmental factors such as temperature (Murata and Wada, 1995; Tocher et al.,1998; Laoteng et al., 2005; Mansilla et al., 2008).Low temperature can be detected as a signal by higher plants and microalgae and then transmitted to regulatory molecules that can interact with the regulatory regions of desaturase genes (Los and Murata, 1998). As a result, an appropriate number of unsaturated bonds onto the fatty acids of membrane glycerolipids are induced to transition from the gel(solid) to liquid-crystalline phase, thus providing membranes with the necessary fluidity (Russell, 1984;Hazel, 1995; Los et al., 2013). The fluidity of membranes is, in turn, important for the activation of certain membrane-bound enzymes including Δ5, Δ6,and Δ12 FADs (Houslay and Gordon, 1983;Thompson, 1989). Δ6 FAD is proposed to be one of rate-limiting enzymes in the synthesis of PUFAs (Qi et al., 2004; Iskandarov et al., 2010; Wu et al., 2013).It appears that the upstream regulatory regions of the Δ6 FAD gene are responsible for its transcription, to help plants and microalgae adapt to the changed temperature.
In an ArA-rich green microalgaMyrmeciaincisaReisigl H4301 (Reisigl, 1964), an increased gene transcriptional level of Δ6 FAD has been found in the culture under nitrogen starvation stress, whereas replenishment of nitrogen can lead to a decrease in transcription of this gene (Liu et al., 2012). In accordance with this change, the levels of ArA, a major terminal product of LC-PUFAs inM.incisa,begin to decline while shifting from nitrogen starvation to replenishment of the culture in a related study (Tong et al., 2011). It is reasonable to assume that this Δ6 FAD gene may have upstream regulatory regions that enableM.incisato respond to nitrogen starvation stress, analogous to the response to low temperature as described above in other plants and microalgae.
To provide evidence for this assumption, this study will focus on the cloning of the 5′-upstream region(USR) of the Δ6 FAD gene fromM.incisaby a genome walking approach, after functional characterization of this Δ6 FAD gene by heterologous expression inSaccharomycescerevisiae. Based on computation analysis, the function of this 5′-USR as a promoter is determined by fusing it with a green fluorescent protein (GFP) gene as a reporter inS.cerevisiae, too. To our knowledge, this is the first report about the identification of FAD promoter in function from microalgae which is a promising feedstock for PUFA and even biodiesel production(Guschina and Harwood, 2006; Harwood and Guschina, 2009; Khozin-Goldberg et al., 2016). This research suggests that the Δ6 FAD gene works as a possible rate-limiting enzyme in ArA biosynthesis,and thecis-acting regulatory elements in its 5′-USR might provide insight into the transcriptional regulation mechanism of Δ6 FAD in the production of ArA inM.incisa.
2 MATERIAL AND METHOD
2.1 Strains and culture conditions
The strain H4301 ofMyrmeciaincisaReisigl(Reisigl, 1964), an ArA-rich green microalga (Tong et al., 2011; Ouyang et al., 2013b), was commercially provided by the Culture Collection of Algae of Charles University of Prague (CAUP) via Prof. C.-W.ZHANG (Ji’nan University, Guangzhou, China). This microalga was cultured in a BG-11 medium (Stanier et al., 1971) in 500-mL glass flasks at 25°C and illuminated from one side with a light:dark regime of 12 h:12 h by Phillips (Yizheng, Jiangsu, China) coolwhite fluorescent tubes (36 W) at a light irradiance of 115 μ mol photons/(m2·s) (Tong et al., 2011; Ouyang et al., 2013b; Chen et al., 2015). During the incubation,flasks were manually shaken several times per day at regular intervals. Algal cells were harvested at the late logarithmic growth phase (about 2 weeks) by centrifugation at 5 500 r/min for 10 min and then stored in liquid nitrogen for total RNA and DNA extraction (Ouyang et al., 2013a; Chen et al., 2015;Xue et al., 2016).
Yeast strains ofS.cerevisiaeused throughout this study were INVSc1 (genotypehis3Δ1/his3Δ1leu2/leu2trp1-289/trp1-289ura3-52/ura3-52) and BY4741 (Matahis3Δleu2Δmet15Δura3Δ), both of which were uracil auxotrophic mutants from Invitrogen (Carlsbad, CA, USA) and Euroscarf(Frankfurt, Germany), respectively. Prior to transformation,S.cerevisiaewas cultured at 28°C in Yeast Extract Peptone Dextrose (YPD) medium containing 1% yeast extract, 2% peptone, and 2%glucose in a shaker at 200 r/min. For functional expression, transformants were cultured in minimal medium SC-U containing a 0.67%-yeast nitrogen base without amino acids, as well as the appropriate nutrients according to the protocol (Invitrogen,Carlsbad, CA, USA). The carbon source was provided with 2% glucose or galactose.

Table 1 Sequences of primers employed in the present study
2.2 Functional characterization of M. incisa Δ6 FAD gene in S. cerevisiae
On the basis of the nucleotide sequence of theΔ6 fadcDNA cloned fromM.incisaas designatedMiD6fadin a previous study (Liu et al., 2012), a pair of primers, pYF and pYR (Table 1; lowercase letters indicating theEcoRI andXbaI digestion sites), was designed for polymerase chain reaction (PCR)amplification of the 1 443-bp open reading frame(ORF) ofMiD6fad. A 25-μL reaction contained cDNA 1.0 μL,ExTaq(5 U/μL) 0.25 μL, Mg2+(25 μmol/L)1.5 μL, dNTPs (2.5 μmol/L) 2 μL, forward and reverse primers 1 μL, 10×PCR buffer 2.5 μL, and RNase-free H2O 16.75 μL. The reaction was performed in a gradient Mastercycler (Eppendorf,Hamburg, Germany) and programmed as follows:predenatured at 95°C for 4 min; followed by 35 cycles of denaturation at 94° C for 30 s, annealing at 67° C for 90 s, and extension at 72°C for 2 min; and a final extension at 72°C for 10 min. The PCR products were fractionated via 1.0% agarose gel electrophoresis,purified using the Agarose Gel DNA Purification Kit Ver.2.0 (TaKaRa, Dalian, China) and were then ligated into a pMD19-T vector at 16° C overnight and transformed intoEscherichiacoliDH5 α competent cells (Biocolor BioScience & Technology Company,Shanghai, China). Positive clones were selected by using blue-white and colony PCR estimation employing the same primers asMiD6fadORF cloning. The presence of the insert in the vector in the correct orientation and reading frame was confirmed using nucleotide sequencing (Sangon, Shanghai,China).
Both the construct pMD19T-MiD6FAD and the yeast expression plasmid pYES2 (Invitrogen,Carlsbad, CA, USA) were dually digested withEcoRI andXbaI as described previously (Yu et al., 2012).The cloned 1 443-bp ORF ofMiD6fadwas ligated with the digested pYES2 to generate pY-MiD6FAD by T4 DNA ligase. After transformation intoE.coliDH5 α competent cells, positive clones were selected and verified by colony PCR and sequencing as described above. The constructed vector pYMiD6FAD was transformed into theS.cerevisiaestrain INVSc1 by electroporation (Bio-Rad, USA).Transformants were plated on minimal media lacking uracil (Kaiser et al., 1994), and the positive clone Y-MiD6FAD was verified and cultivated in the SC-U liquid medium as described above. The appropriate yeast culture (1:1 000, v/v) was inoculated in YPD medium for cultivation at 28°C until the optical density (OD) value at 600 nm reached 0.3.Subsequently, Tergitol type NP-40 (Sigma, St. Louis,MO, USA) as a surfactant, galactose as an inducer,and exogenous fatty acids as substrates were added in final concentrations of 1%, 2% and 0.005%,respectively. The yeast culture was incubated at 10°C in a shaker at 160 r/min (Li et al., 2012) for 120 h prior to centrifugation for harvesting. The yeast cell pellets were washed three times with distilled water to remove the unincorporated fatty acids from the cell surface as much as possible. The empty pYES2 transformants and wild-type yeast cells were included as controls throughout all of the experiments.
2.3 Yeast fatty acid analysis
The cellular fatty acids were extracted from lyophilized yeast powder as described previously (Yu et al., 2012). Approximately 25 mg of the lyophilized yeast cells, 2 mL of H2SO4-methanol solution (1:50,v/v) and 0.125 mg of heptadecanoic acid (HA) as an internal standard were mixed in a test tube for the transesterification of fatty acids. After charging with nitrogen gas, the tube was stirred and heated for esterification in an 85°C water bath for 1 h. The tube was mixed by vortexing after the addition of 1 mL distilled water and 1 mL hexane, followed by centrifugation at 5 500 r/min for 10 min. The supernatant was transferred to a new tube, concentrated by bubbling nitrogen, dissolved by adding 500 μ L hexane, and stored in a 4°C freezer for gas chromatography and mass spectrometry (GC-MS)analysis.
The fatty acid methyl ester derivatives were subjected to GC-MS on a very polar column HP-88(88%-cyanopropyl) aryl-polysiloxane (60 m×250 μm× 0.2 μm) connected to an MS Engine quadrupole mass spectrometer (Agilent 5977A, USA). The column temperature was held at 70°C for 1 min and then heated to 235°C at a rate of 10°C/min and held again for 8 min. The injection volume was 1 μL without split.Helium was used as a carrier gas at a flow rate of 0.6 mL/min, and the pressure was programmed at a constant flow mode. The mass spectrometer was operated in electron impact mode at the ionization energy of 70 eV (Qi et al, 2004). Fatty acids were identified based on the comparison of their mass spectra with those stored in NIST 08MS libraries. The mole number of fatty acid methyl esters was calculated with peak area of the internal standard. In case of desaturated substrates, the conversion rate was expressed as % desaturation (product/(product+substrate)× 100) (Iskandarov et al., 2010; Li et al, 2012; Yu et al., 2012).
2.4 Cloning of the 5′-USR of MiD6fad using a genome walking approach
Three gene-specific primers, GSP1, GSP2, and GSP3 (Table 1), were designed according to the cloned cDNA sequence ofMiD6fadfromM.incisa(Liu et al., 2012). The 5′-USR ofMiD6fadwas cloned following the description of the Genome Walking Kit(TaKaRa, Dalian, China). Three rounds of PCR were carried out in a gradient Mastercycler (Eppendorf,Hamburg, Germany) using the product of the previous round of PCR as a template for the next, as well as a universal adaptor primer (AP1) and the designed gene-specific primer in a consecutive manner. The first round of PCR amplification (1stPCR) was conducted with the primers GSP1 and AP1 in a 50-μL reaction system containing H2O 33.5 μL, 10×LA PCR Buffer II (Mg2+plus) 5.0 μL, DNA template 1.0 μL,each primer (100 pmol/μL) 1.0 μL, dNTP (2.5 mmol/L each) 8 μL, andLATaq(5 U/μL) 0.5 μL. The 1stPCR product mixture was diluted (1:10, v/v), and then 1 μL dilution was pipetted as a template for the 2ndround of PCR amplification with the primers AP1 and GSP2.The other compositions in the reaction system were the same as those in the 1stround of PCR. The 3rdround of PCR was performed in the same way. The amplification program for the three rounds of PCR was performed as shown in Table S1.
The first, second, and third rounds of PCR products were fractionated via 1.0% agarose gel electrophoresis,and the distinct band was purified using the Agarose Gel DNA Purification Kit Ver.2.0 (TaKaRa, Dalian,China). Subsequently, the cloned sequence was verified by colony PCR with the primer GSP3 and then sequencing as described above.
2.5 Bioinformatics analysis of the 5′-USR of MiD6fad
The neural network web server BDGP (http://www.fruitfly.org/seq_tools/promoter.html) was employed to predict the promoter regions ofMiD6fad.Regulatory features such as transcription factor binding sites, the TATA-box, CCAAT-box, and GC-box were analysed online using PlantCARE (http://bioinformatics.psb.ugent.be/webtools/plantcare/html)(Lescot et al., 2002) and PLACE 30.0 (plantcisacting regulatory DNA elements, http://www.dna.affrc.go.jp/PLACE/) (Higo et al., 1999). The tandem repeat sequence was searched online by RepeatMasker(http://www.repeatmasker.org/cgi-bin/WEBRepeatMasker).
2.6 Construction of yeast expression plasmid carrying 5′-USR of MiD6fad
GFP is usually used as a reporter in biotechnological research. To construct a co-expression vector composed ofgfpand 5′-USR ofMiD6fad,gfpwas amplified with one pair of primers, GFPF and GFPR(Table 1; lowercase letters indicating theBamHI andEcoRI digestion sites), from the vector pCAMBIA1304(Marker Gene Technologies, Inc., Oregon, USA). The reaction was programmed for pre-denaturation at 94°C for 3 min; followed by 35 cycles of denaturation at 94°C for 45 s, annealing at 56.5°C for 45 s, and extension at 72°C for 1 min; and a final extension at 72°C for 10 min. The amplifiedgfpfragment and the plasmid pYES2 were dually digested withBamHI andEcoRI and then ligated by T4 ligase to generate pY-GFP that was also regarded as a positive control.
To avoid the possible expression of target genes under the control of the GAL1 promoter without the addition of galactose as an inducer, the promoters GAL1 and T7 were deleted by digestion withSpeI andKpnI. The resulting sticky ends were ligated with a 448-bp fragment dually digested by these two nucleases. This 448-bp fragment, without any predicted basic elements of a core promoter, was amplified with one pair of primers, DT6F and DT6R(Table 1; lowercase letters denoting theSpeI andKpnI digestion sites), which was designed on the basis of the sequence ofMiD6fad. The recombinant plasmid was named pY-448-GFP which was also regarded as a negative control.
Based on the constructed negative control vector,one pair of primers, DT5F and DT5R (Table 1;lowercase letters indicating theKpnI andBamHI digestion sites), was designed to subclone a 1 965-bp fragment from the cloned 5′-USR ofM.incisaD6fad.The reaction was programmed as described above for GFP gene cloning, except the annealing temperature at 63.8°C and the extension time for 2 min. The amplified fragment was dually digested withKpnI andBamHI and ligated intoKpnI- andBamHI-digested pY-448-GFP to generate pY-448-1965-GFP.
During the recombinant plasmid construction, all of the PCR products were purified, ligated into the pMD19-T vector at 16° C overnight, and then transformed intoE.coliDH5 α. Positive clones were selected and verified by colony PCR using the corresponding cloning primers and sequencing as described above forMiD6fadcloning. The constructed vectors pY-GFP, pY-448-GFP, and pY-448-1965-GFP were separately transformed into theS.cerevisiaestrain BY4741 by electroporation, and transformants were plated for screening on SC-U solid minimal media lacking uracil at 28°C for 48- 72 h.
2.7 Detection of fluorescent signal and intensity of GFP
The selected positive transformed lines Y-448-1965-GFP, Y-448-GFP, and Y-GFP were inoculated separately into an SC-U liquid medium for cultivation at 28°C until the OD value at 600 nm reached 0.3.Subsequently, the transgenic lines Y-448-1965-GFP and Y-448-GFP were inoculated (1:100, v/v) in the SC-U liquid medium with 2% glucose as the carbon source; the Y-GFP was also inoculated in this medium but with 2% galactose as the carbon source to induce the GAL1 promoter. These were incubated at 28°C for an additional 72 h. The GFP fluorescence signal of the transgenic lines was captured by a laser confocal microscope (Carl Zeiss LSM 710, Germany) with an excitation filter of 485 nm and an emission filter of 520 nm.
The fluorescence intensity (FI) of the transgenic lines was estimated by a multi-mode microplate reader (BioTek SynergyTMH1, USA) with the excitation filter at 476 nm and the emission filter at 512 nm (Sheff and Thorn, 2004). Prior to estimation,the OD values at 600 nm of all of the fresh yeast cells were adjusted to an identical level by a NanoDrop spectrophotometer (Thermo Scientific, USA).Following the pipetting of 200 μ L of yeast culture into black 96-well plates (DragonLab, Beijing,China), the FI was detected by the multi-mode microplate reader and expressed as the mean± SD of triplicate wells. Statistical analysis was performed using the SPSS statistical package (SPSS Inc.,Chicago, IL, USA). One-way ANOVA statistical analysis was applied, and statistical significance was achieved whenP<0.05.
2.8 Western blot of the expressed GFP in yeast cells
GFP expressed in the transformed yeast cells was detected by Western blot following the detailed procedure as described by Ye et al. (2014). Total proteins were extracted from the transgenic lines,Y-448-1965-GFP, Y-448-GFP, and Y-GFP, using the Yeast Protein Extraction Reagent (TaKaRa, Dalian,China) and were separated by 12% sodium dodecyl sulfate-polyacrylamide gel electrophoresis after adjusting the protein concentration to an identical level. After electrophoresis, the proteins were electronically transferred onto a nitrocellulose membrane. The protein blot was blocked with 5%skim milk powder in Tris-buffered saline Tween-20 buffer (TBST) (0.137 mol/L NaCl, 2.7 mmol/L KCl,0.025 mol/L Tris, and 0.05% Tween 20 at pH 7.4) and incubated with the primary antibody, anti-GFP rabbit IgG antibody (1:500, Life Technologies, New York,USA), in TBST at room temperature for 1 h.Subsequently, the membrane was washed in TBST for several times and incubated with the secondary antibody, horseradish peroxidase-labeled anti-rabbit IgG antibody (1:8 000, Youke Biotechnology Co.,Ltd., Shanghai, China), in TBST at room temperature for 1 h and washed again. The color reaction was visualized with diaminobenzidine following the manufacturer’s instructions (Tiangen Biotech Co.,Ltd., Beijing, China).
3 RESULT
3.1 Construction of the vector pY-MiD6FAD for functional characterization
One 1 443-bp ORF fragment coding for Δ6 FAD(GenBank accession No. JN205756) was cloned fromM.incisausing two designed primers, pYF and pYR(Table 1), with theEcoRI andXbaI digestion sites,and measured approximately 1.5-kb in length (Fig.S1, lanes 1–2) as expected. Following TA cloning,plasmid digestion (Fig.S1, lanes 3–4 and 5–6), colony PCR and sequencing analysis, this ORF sequence was identical to the cloned Δ6 FAD gene as designatedMiD6fadin a previous study (Liu et al., 2012). After transformation into the strain INVSc1 ofS.cerevisiae(genotypehis3Δ1/his3Δ1leu2/leu2trp1-289/trp1-289 ura3-52/ura3-52), the construct pY-MiD6FAD was verified by dual digestion withEcoRI andXbaI (Fig.S1, lanes 7–8) and sequencing. These results (Fig.S1)indicated that theMiD6fadORF was correctly inserted into the expression vector pYES2 and that the selected transgenic line carried the generated construct pY-MiD6FAD.
3.2 Heterologous expression of MiD6fad in yeast
The putative function ofMiD6fadwas examined by comparing the fatty acid compositions between the transgenic and wild-typeS.cerevisiaecultured with the addition of appropriate substrates. GC-MS analysis of yeast lipids (Fig.S2) revealed the presence of four major species of fatty acids inS.cerevisiae,i.e., palmitic (PA, 16:0), palmitoleic (PoA, 16:1Δ9),stearic (SA, 18:0), and oleic (OA, 18:1Δ9) acids, which was consistent with a previous report (Yu et al., 2012).These fatty acids were unaltered regardless of whether the yeast strain was wild-type or transgenic (Fig.S2),highlighting thatS.cerevisiaedid not have any PUFAs. When the transgenic yeast carrying the target gene was inoculated in YPD medium and induced by galactose, there was no new peak (Fig.S2) present in the GC-MS profile of fatty acids compared to the wild-type one. This result indicated that the transformed geneMiD6fadcould not utilize the yeast’s four major species of fatty acids as substrates,suggesting that none of these fatty acids could be desaturated by the enzyme encoded byMiD6fad.
Compared with the wild type, it was clear that the transgenic line expressing the recombinantMiD6fadwas able to desaturate exogenous LA (Fig.1a) and ALA (Fig.1c) for PUFA production. Their corresponding desaturated products were identified by GC-MS analysis as GLA (Fig.1b) and SDA(Fig.1d) acids. The production of GLA and SDA at the expense of LA and ALA, respectively, in the transgenic line (Fig.1) indicated thatMiD6fadencoded a Δ6 FAD involved in both the ω-3 and ω-6 biosynthesis pathways. When the amount of LA and ALA was added to the media at the same final level(0.005%), 3.14% and 2.21%, respectively, of these precursors (Table 2) were catalysed by MiD6FAD in the transgenic line. This similar desaturation efficiency(Table 2) demonstrated that MiD6FAD probably had no substrate specificity. The efficiency of Δ6 FAD was comparable to that of the microalgaParietochloris incisa(4.5%- 5.1%) (Iskandarov et al., 2010) as well as that of the cyanobacteriumSynechococcussp.PCC7002 (1.25%- 11.36%) (Dong et al., 2016) and the fungusConidiobolusobscurus(approximately 6%) (Tan et al., 2015).
3.3 Cloning and bioinformatics analysis of the 5′-USR of MiD6fad
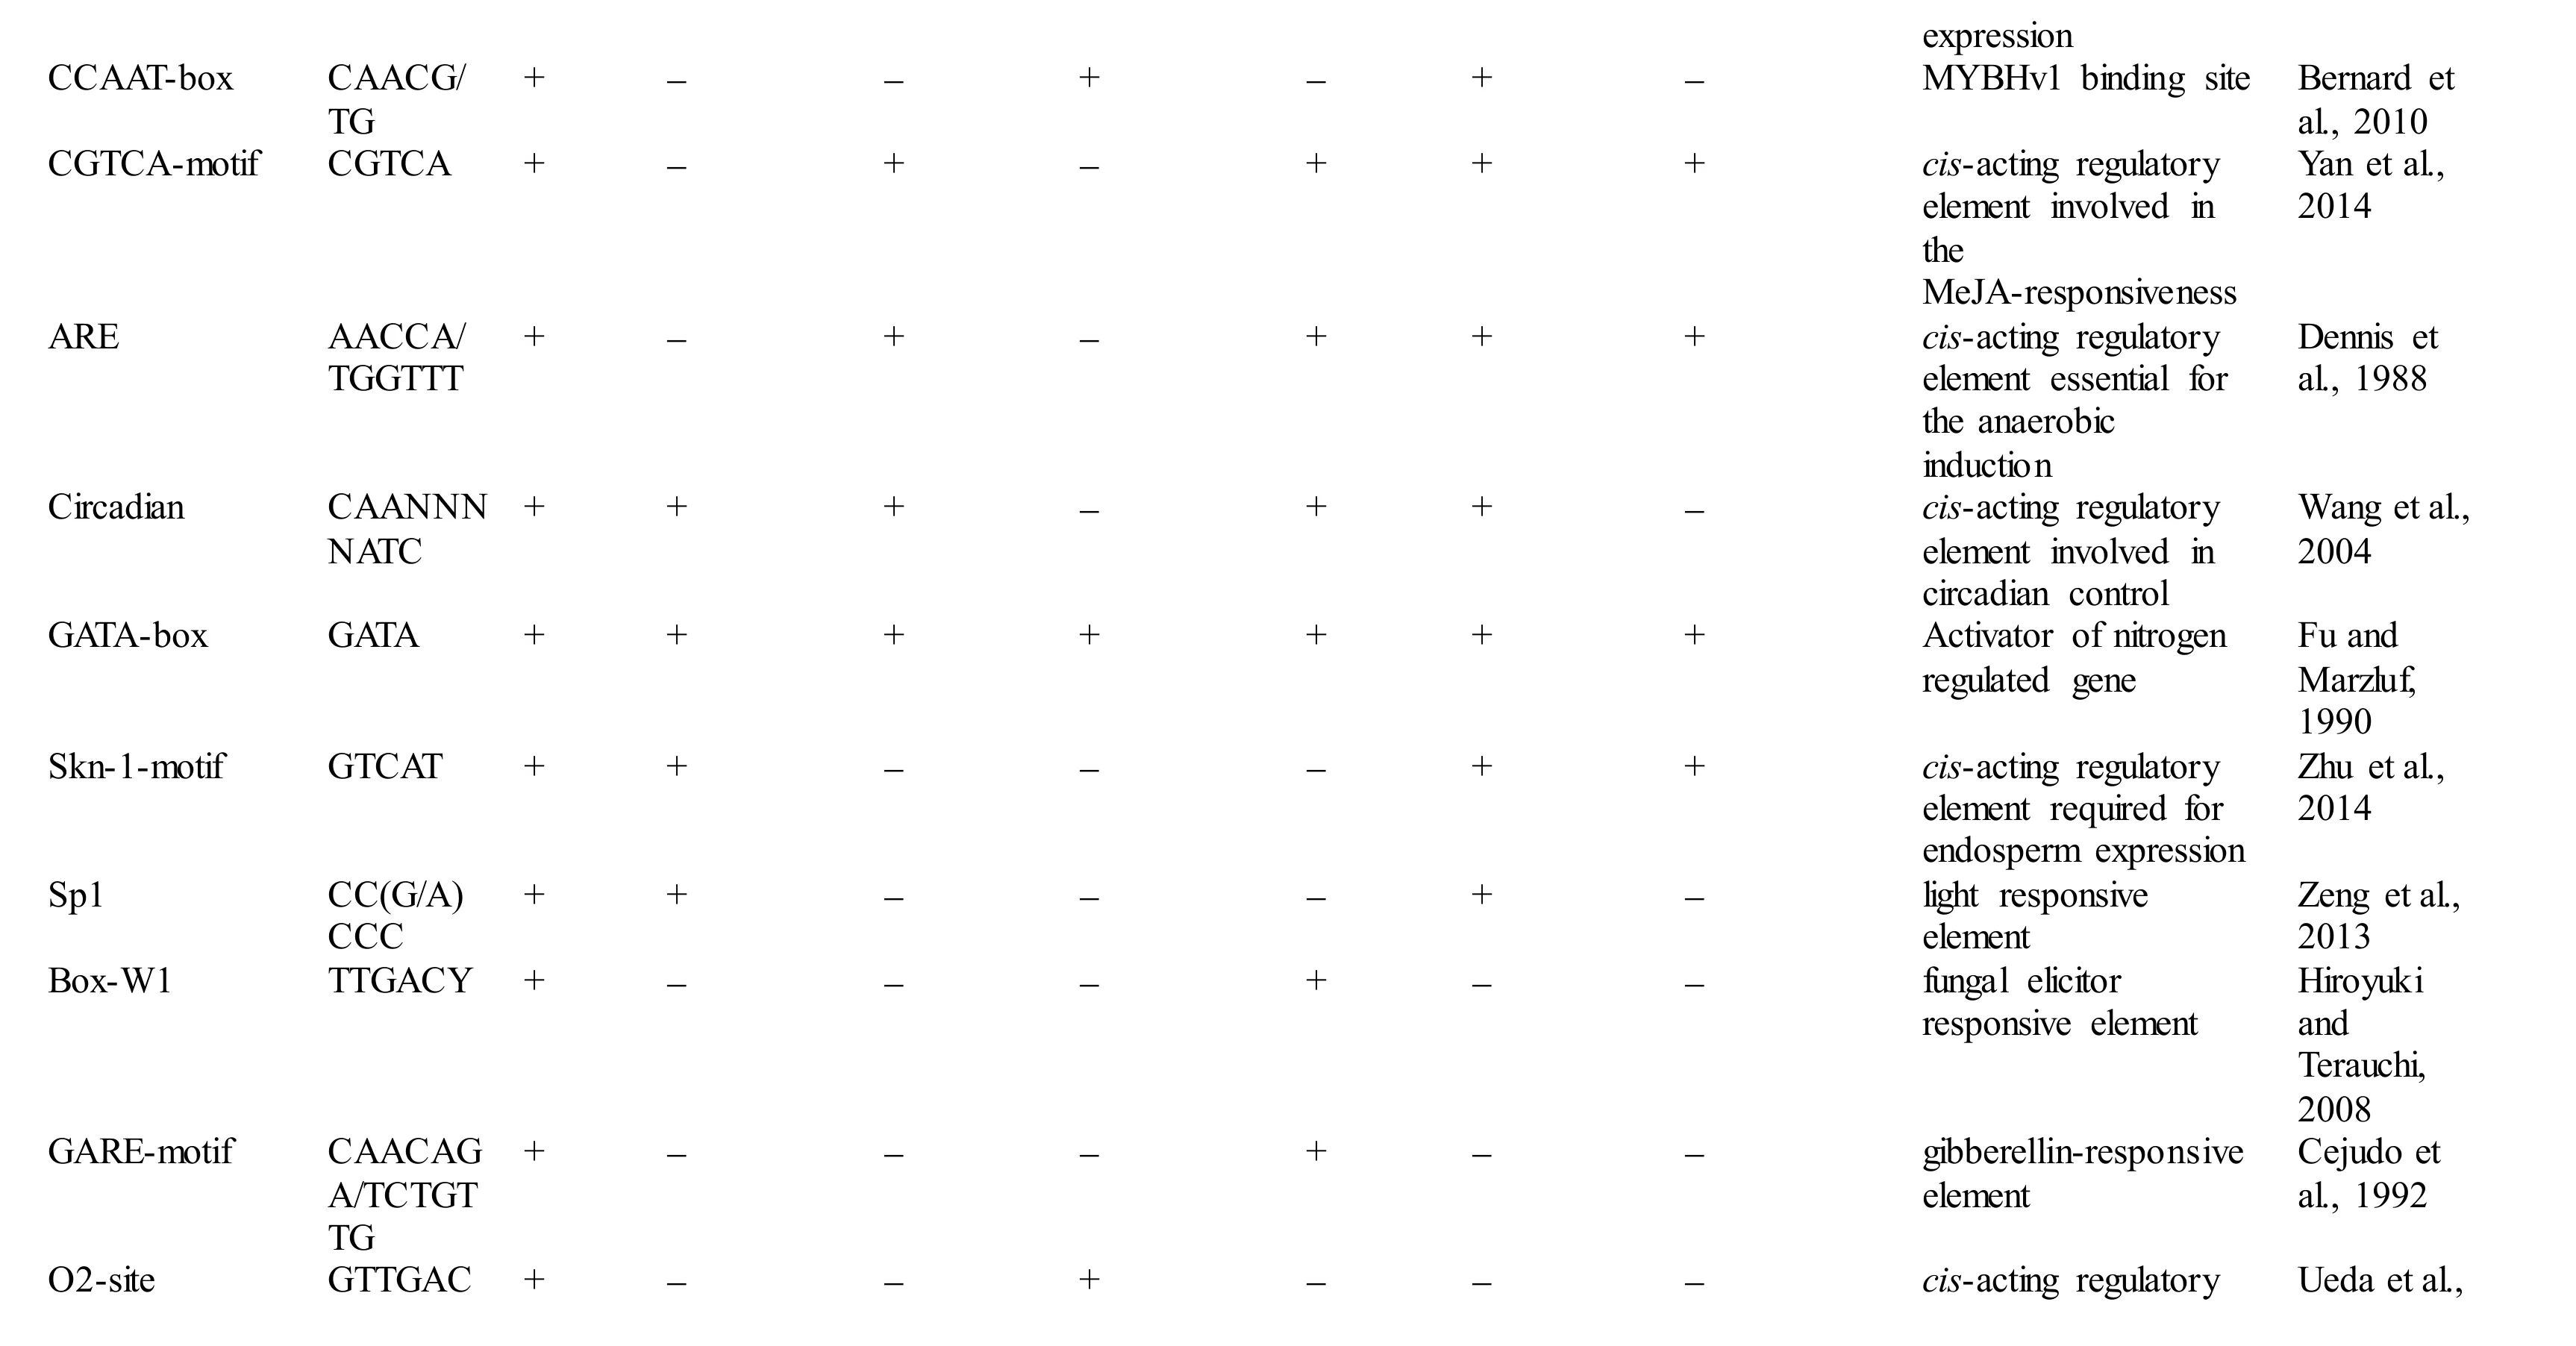
With 3 designed primers (GSP1, GSP2, and GSP3,Table 1) according to the cDNA sequence ofMiD6fad,a 2 347-bp fragment from upstream of the start codon ATG ofMiD6fadwas cloned fromM.incisaby a genome walking approach (Fig.S3). This cloned 5′-USR sequence was online analysed by PlantCARE(http://bioinformatics.psb.ugent.be/webtools/plantcare/html/) (Lescot et al., 2002) and PLACE (http://www.dna.affrc.go.jp/PLACE/signalscan.html) (Higo et al.,1999). Computational analysis revealed that it contained several basic transcriptional regulation elements, including the TATA-box and CAAT-box that were located at -25 bp and -65 bp, respectively,from the transcriptional start site (Fig S4). Some othercis-acting elements, such as the G-Box, GT1-motif,Sp1, CATT-motif, and MNF1, were involved as well,and all of these elements were related to light response.In addition, the elements of LTR (low-temperature responsiveness), O2-site (zein metabolism regulation),MSA-like (cell cycle regulation), circadian (circadian control), and GATA-box (light-mediated regulation and nitrate-dependent control) were found to be present in this cloned 5′-USR ofMiD6fad(Fig.S4).Most of these elements were also found in the promoters of other FAD genes (Table S2). As a comparison result, the cloned 5′-USR ofMiD6fadhad 14, 12, and 12 elements identical to the reported FAD promoters from the marine fungusThraustochytriumsp. FJN-10 (Huang et al., 2011) and higher plantsSesamumindicum(Nayeri and Yarizade, 2014) andBrassicanapus(Xiao et al., 2014), respectively. This cloned fragment was therefore considered to be an FAD promoter. In addition, the presence of these putative elements suggested that the transcription ofMiD6fadcould be regulated by light, low-temperature,nitrogen, etc.

Fig.1 Gas chromatography-mass spectrometry of fatty acid methyl esters in yeast

Table 2 Fatty acid desaturation of different substrates supplied to the transgenic yeast Y-MiD6FAD
3.4 Functional characterization of the 5′-USR of MiD6fad
To determine whether the 5′-USR ofMiD6fadfunctions as a promoter in yeast, the coding sequence of GFP as a reporter gene was cloned and introduced into the pYES2 vector under the control of the GAL1 promoter (Fig.S5). Until this step, the construct pYGFP can theoretically be used to identify whether a target insert acts as a promoter by adding glucose alone into the medium for the culture of transgenic yeast. However, during this cultivation of transgenic yeast with this construct alone, weak fluorescence of GFP was observed from the transgenic line, owing to the possible contamination of galactose in the added glucose (in that the former was an inducer of the GAL1 promoter). To avoid this confusion, the GAL1 and T7 promoter were then substituted with a 448-bp fragment cloned from the coding sequence ofMiD6fad(Fig.S6). Subsequently, a 1 965-bp fragment(Fig.S4) from this 2 347-bp-long 5′-USR ofMiD6fad,containing all of the above-mentionedcis-regulatory elements, was subcloned and ligated between the 448-bp fragment (Fig.S7) andgfpas shown in Fig.2a.Lastly, the recombinant vector pY-448-1965-GFP was constructed and then transformed into BY4741(Matahis3Δleu2Δmet15Δura3Δ) for the identification of function. Green fluorescence that emerged from GFP was captured (Fig.2b) by a laser confocal microscope from the two transformed yeasts Y-448-1965-GFP and Y-GFP, the latter of which was regarded as a positive control while cultured with galactose as an inducer. In contrast, no visible fluorescence was observed from the transformed yeast Y-448-GFP. These images (Fig.2b) illustrated that the cloned 1 965-bp 5′-USR ofMiD6fadwas able to drive GFP expression as a promoter in yeast.
In the fluorescent images of yeast cells (Fig.2b), it was observed that not all cells had the similar intensity of GFP fluorescence, probably due to their different stages of cell division. To quantitatively compare the differences among the transformed yeasts Y-448-1965-GFP, Y-GFP, and Y-448-GFP, the FI was evaluated by adjusting the concentration of fresh yeast cells to an identical level. Although the FI in the transformed line Y-448-1965-GFP (FI=1 516± 57,n=9) was lower than that in the positive control Y-GFP(FI=1 696± 206,n=9), they had no statistical difference(P>0.05). But both of them differed from the transgenic line Y-448-GFP (FI=515± 52,n=9) at an extremely significant level (P<0.01). This quantitative analysis suggested that the cloned 1 965-bp 5′-USR ofMiD6fad(Fig.S4) could drive the expression of GFP as same as the GAL1 promoter in yeast.
Regarding the unexpected effect of possible cytoplasmic metabolites on the FI detection of GFP as detected in the transgenic line Y-448-GFP, Western blot was used to confirm the expression of GFP in yeast cells. The Western blot images of transformed yeasts (Fig.3) illustrated that the expressed GFP protein was detected in the transformed line Y-448-1965-GFP as well as the positive control line Y-GFP and its molecular weight was about 27 kDa. But in transformed line Y-448-GFP that did not carry the cloned 1 965-bp fragment, no GFP protein was detected. This experimental result proved that GFP was expressed in yeast cells under the control of this cloned microalgal promoter although the blotting was lighter than that in the positive control (Fig.3).
4 DISCUSSION
The geneMiD6fadhas been cloned fromMyrmecia incisaby Liu et al. (2012). The deduced amino acid sequence ofMiD6fadis found to be characterized by four transmembrane domains, five distinct hydrophobic regions, and three conserved histidinerich motifs corresponding to the sequences HxxxH,HxxHH and QxxHH (Liu et al., 2012), which are typical of all front-end FADs (Los and Murata, 1998;Meesapyodsuk and Qiu, 2012). The N-terminus of MiD6FAD has a fusion cytochromeb5 domain with the HPGG motif (Liu et al., 2012), implying that it can introduce a double bond at a site closer to the carboxyl terminus than any of the pre-existing double bonds in the substrate fatty acid, as reported by Warude et al. (2006) and Meesapyodsuk and Qiu(2012). This is supported by the GC-MS profiles(Fig.1) of fatty acids extracted from transgenic yeast withMiD6fad, in that a double bond is introduced at the sixth carbon atom from the carboxyl terminus of the new products GLA and SDA, compared to their corresponding precursors LA and ALA, respectively.MiD6FAD is thus experimentally proven to be a Δ6 FAD, in addition to the previous prediction only according to the bioinformatics analysis (Liu et al.,2012).
MiD6FAD is also found in this study to desaturate LA (an ω-6 fatty acid) and ALA (an ω-3 fatty acid) in yeast at a very similar efficiency, i.e., 3.14% and 2.21% (Table 2), respectively, showing that this enzyme has no preference for LA or ALA, as reviewed by Meesapyodsuk and Qiu (2012) in the most-studied eukaryotes. The desaturation of MiD6FAD seems to be less efficient than that of ω 3 FAD (29.73% for the conversion from LA to ALA) and the elongation of Δ6 fatty acid elongase (23.89% for conversion from GLA to DGLA and 41% for SDA to eicosatetraenoic acid) as documented by Li et al. (2012) and Yu et al.(2012), respectively, in this microalga as well. It is therefore suggested that Δ6 FAD could act as one of rate-limiting enzymes for the biosynthesis of downstream PUFAs, which agrees with the inferences of other plant FAD studies (Qi et al., 2004; Wu et al.,2013). In this case, understanding the regulatory elements in the 5′-USR ofMiD6fadwill help us to improve the ArA level, for example, by increasing the transcriptional level of this gene in changing environments. This is supported in part by the simultaneous increase in both theMiD6fadmRNA transcript (Liu et al., 2012) and terminal product ArA level (Tong et al., 2011; Yu et al., 2012) inM.incisaduring the culture of nitrogen starvation stress. It is reasonable to think that the 5′-USR ofMiD6fadpossibly has some signal-responsive elements to nitrogen starvation and even to other unknown environmental factors.

Fig.2 Schematic representation of the expression vector pY-448-1965-GFP construction (a) and confocal microscopic images(b) of yeast cells transformed with the construct, pY-448-GFP or pY-GFP, both of the latter which were taken as a negative or positive control, respectively
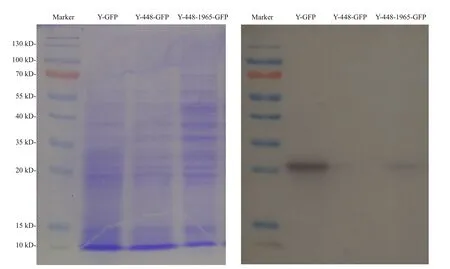
Fig.3 Electrophoresis profile of total proteins from the transgenic yeasts (left) with different constructs as used in Fig.2 and its corresponding Western blot pattern (right) using the primary antibody, anti-GFP rabbit IgG antibody (Life Technologies, New York, USA)
To better understand this phenomenon, a 2 347-bp 5′-USR ofMiD6fadwas cloned by a genome walking approach in this study, and one 1 965-bp part (Fig.S4)of this sequence was proven to drive GFP expression in yeast (Fig.2b). Moreover, its ability to drive GFP expression is functionally comparable to the GAL1 promoter because of no significant difference(P>0.05) between their estimated FI data, but both of them are extremely significantly different (P<0.01)from the negative control yeast strain Y-448-GFP carrying no promoter. It must be noted, however, that the noisy fluorescence is evidently present in the negative control, possibly owing to the contamination of some cytoplasmic metabolic coenzymes, for example, NADH and FAD, with similar wavelengths to GFP, which were investigated by Skala et al. (2007)and Kensy et al. (2009). So it is acceptable to find that there is no significant difference between the transgenic line Y-448-GFP and its original strain BY4741 in fluorescence intensity (FI=474± 18,n=9).Because equivalent quantities of yeast biomass are used in the quantitative comparison of FI, the effect of these contaminants on the fluorescence estimate by a multi-mode microplate reader is considered to be the same. To further verify the promoter ability of the cloned 1 965-bp fragment, Western blot was carried out by using a commercial anti-GFP rabbit IgG antibody, and this experimental result (Fig.3)illustrates that the target fragment is able to promote the expression of GFP in yeast cells.
In the functionally identified 1 965-bp 5′-USR ofMiD6fad(Fig.S4), it is of interest to find 3 copies of the GATA box except the basic transcriptional regulatory elements. The GATA box has been documented in the promoter regions of theArabidopsisthalianachloroplast ω-3 FAD gene (Nishiuchi et al.,1995),Sesamumindicumextra-plastidial FAD2 desaturase gene (Kim et al., 2006), andElaeis guineensisstearoyl-acyl-carrier-protein desaturase gene (Saed Taha et al., 2012) for binding with GATA transcription factors. Many GATA transcription factors have been reported to activate or deactivate genes in response to an environmental deficiency(e.g., nitrogen) from the surroundings (Lowry and Atchley, 2000). In other words, when nitrogen is deficient, the GATA factors can bind to the GATA box of a target gene promoter, thus activating the expression of this gene (Chiang and Marzluf, 1994;Reyes et al., 2004; Camargo et al., 2007). In this 5′-USR ofMiD6fad(Fig.S4), one GATA box is positioned at -771 bp upstream from the transcriptional start site, while the other two are located in the 5′-untranslated region. The latter two GATA core elements, located between +635 bp and +664 bp downstream from the transcriptional start site,constitute an ideal GATA-binding site according to the established criteria by Chiang and Marzluf (1994).The existence of these GATA core elements and the two searched unigenes (Text S1) coding for GATA regulatory factors from the transcriptome database ofM.incisa(Ouyang et al., 2013a) suggest thatMiD6fadwould have a regulation system mediated by GATA regulatory factors. This system has been studied in the control of nitrate reductase gene expression mediated by NIT2, an orthologous GATA factor, in the fungusNeurosporacrassa(Chiang and Marzluf, 1994;Rastogi et al., 1997; Tao and Marzluf, 1999), higher plants (Rastogi et al., 1997; Reyes et al., 2004; Zhang et al., 2015) and the microalgaChlamydomonas reinhardtii(Schnell and Lefebvre, 1993; Camargo et al., 2007). This possibly explains, in part, whyMiD6fadhas been transcribed increasingly inM.incisawith the culture enduring nitrogen starvation stress (Liu et al., 2012), although it remains to be determined whether GATA factors can function as regulators and then bind at the predicted GATA box sites in response to nitrogen starvation stress.
During the functional identification ofMiD6fadby feeding the transgenic yeast with LA or ALA added to the YPD medium at 28°C (usually for the routine culture of yeast) or 20°C, the desaturated products corresponding to these two fatty acids cannot be detected by GC-MS (Table S3). However, when the culture of the transgenic line is shifted to a low temperature such as 10°C, the new products (GLA and SDA) can be detected as shown in Fig.1. These experimental results suggest thatMiD6fadshould be up-regulated by low temperature in yeast, just as the documented genedesDcodes for Δ 6 FAD inSynechocystissp. PCC 6803 (Los et al., 1997; Suzuki et al., 2000). It is thus proposed thatMiD6fadmight participate in the redox components of the yeast Δ 9 FAD system, as suggested by Martin et al. (2007),partially in that both yeast Δ 9 FAD (a low-temperatureinducible desaturase) andM.incisaΔ 6 FAD contain the same cytochromeb5 domain. As a result, the transformedMiD6fadseemingly increases the double bond content of the fatty acid chains of membrane lipids by introducing new double bonds (Fig.1) to help the transgenic yeast adapt to low temperature.The yeast redox components of the Δ 9 FAD system actually consist of cytochromeb5 and NADH cytochromeb5 reductase (Martin et al., 2007), which are encoded by one and two searched unigenes,respectively (Texts S2 and S3) from the transcriptome database ofM.incisa(Ouyang et al., 2013a). The redox components are hence postulated to be present in this microalga, andcis-acting elements involved in low-temperature responsiveness are expected to exist in the functionally identified 1 965-bp 5′-USR ofMiD6fad. The latter speculation is supported by the finding that an LTR element, whose consensus is CCGAAA but TTTCGG on the opposite strand, as described by Dunn et al. (1998), is positioned at+230 bp downstream from the transcriptional start site (Fig.S4). However, whether and how this LTR element responds to low temperature remains to be investigated.
This computational analysis of the functionally identified 1 965-bp 5′-USR ofMiD6fadclearly provides information about the regulated mechanism of ArA biosynthesis inM.incisain changing environments. The levels of ArA in this microalga are anticipated to be increased by shifting the culture to low temperatures, in addition to the nitrogen limitation as documented previously (Tong et al., 2011; Ouyang et al., 2013b).
5 CONCLUSION
This study confirms the primary function ofMiD6fadand a 1 965-bp 5′-USR ofMiD6fadby heterologous expression inS.cerevisiae. The results demonstrate thatMiD6fadencodes Δ6 FAD (Fig.1),which is involved in both ω-3 and ω-6 pathways of fatty acid biosynthesis, and the cloned 1 965-bp 5′-USR ofMiD6fad(Fig.S4) can drive GFP gene expression in yeast (Figs.2 and 3). Further investigation of the function of the 5′-USR ofMiD6fadwith a series of 5′-terminal deletion regions must be carried out. The presence of several putativecisacting regulatory elements in this identified promoter sheds new light on the regulation mechanism of Δ6 FAD transcription for the production of ArA inM.incisain changing environments, although a detailed investigation of them, such as the GATA box and LTR, remains to be completed.
6 DATA AVAILABILITY STATEMENT
The 1 965-bp 5′-USR ofMiD6fadwas deposited in GenBank under the accession No. KU987614.
Functional Characterization of a Δ6 Fatty Acid Desaturase Gene and Its 5′-Upstream Region Cloned from the Arachidonic Acid-rich MicroalgaMyrmeciaincisaReisigl(Chlorophyta)
Li Zhang, Hai-Sheng Cao, Pu Ning, Zhi-Gang Zhou*
Key Laboratory of Exploration and Utilization of Aquatic Genetic Resources
Conferred by Ministry of Education, Shanghai Ocean University, Shanghai 201306,China
National Demonstration Center for the Experimental Teaching of Fisheries Science,Shanghai Ocean University, Shanghai 201306, China
International Research Center for Marine Biosciences Conferred by Ministry of Science and Technology, Shanghai Ocean University, Shanghai 201306, China
*Author for correspondence: e-mail zgzhou@shou.edu.cn. Tel: 0086-21-61900424;Fax: 0086-21-61900405 9 10 11
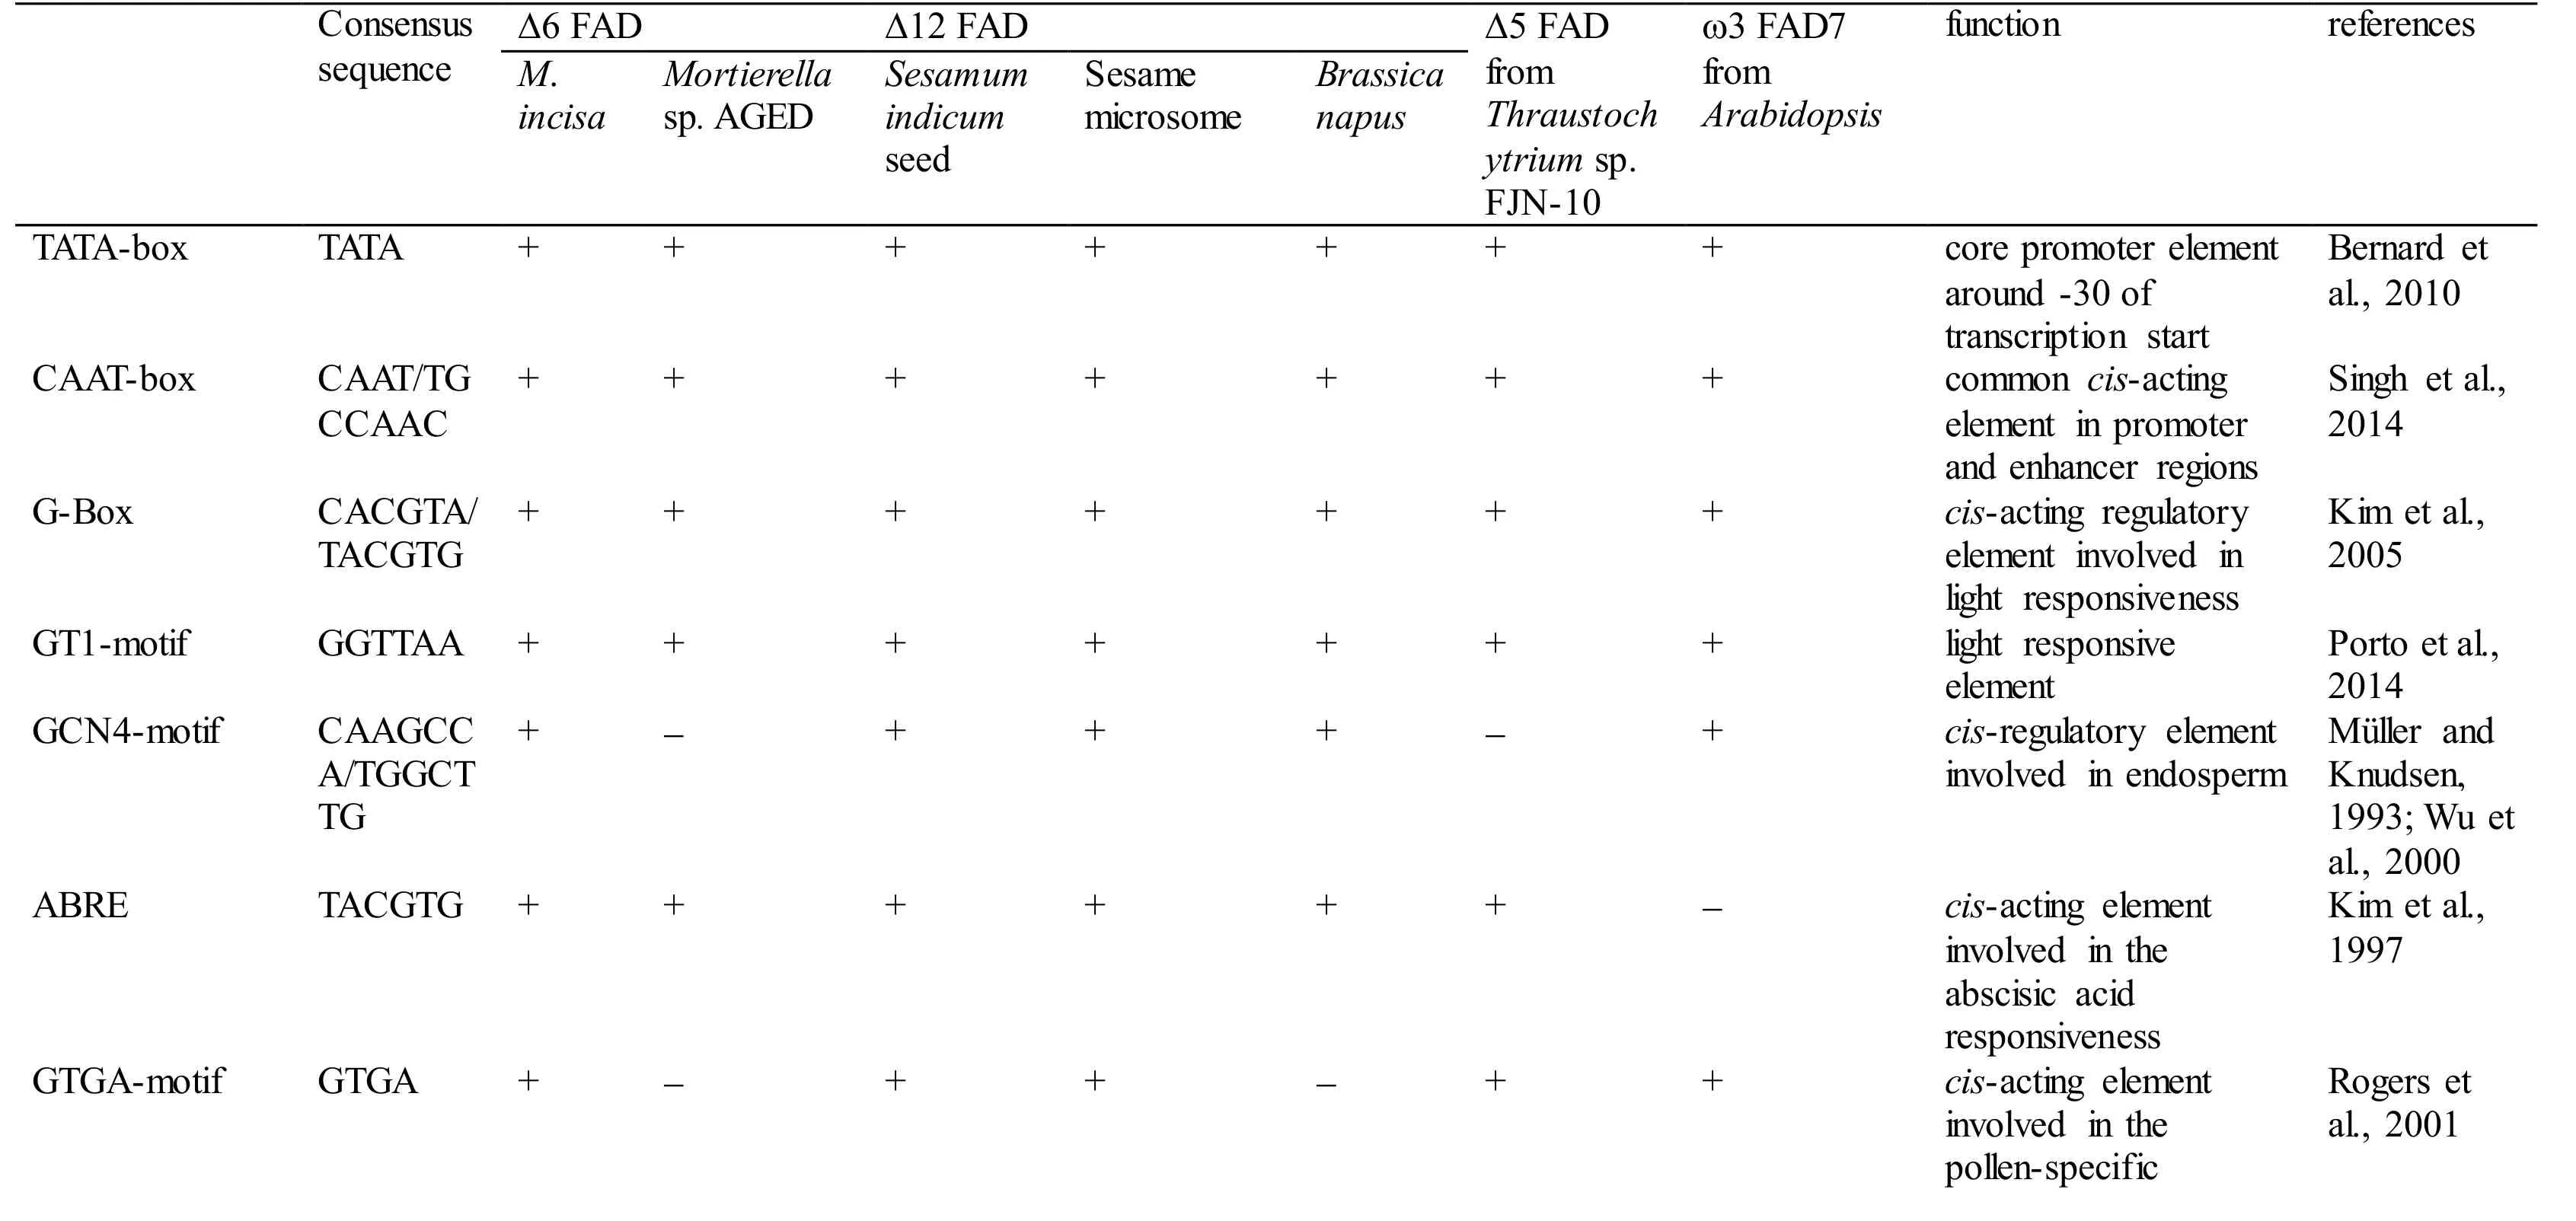
Table S2 Comparison of the cis-regulatory elements present in the fatty acid desaturase gene promoters in Myrmecia incisa and other organisms.
?

Note: + and - denote the presence and absence, respectively.
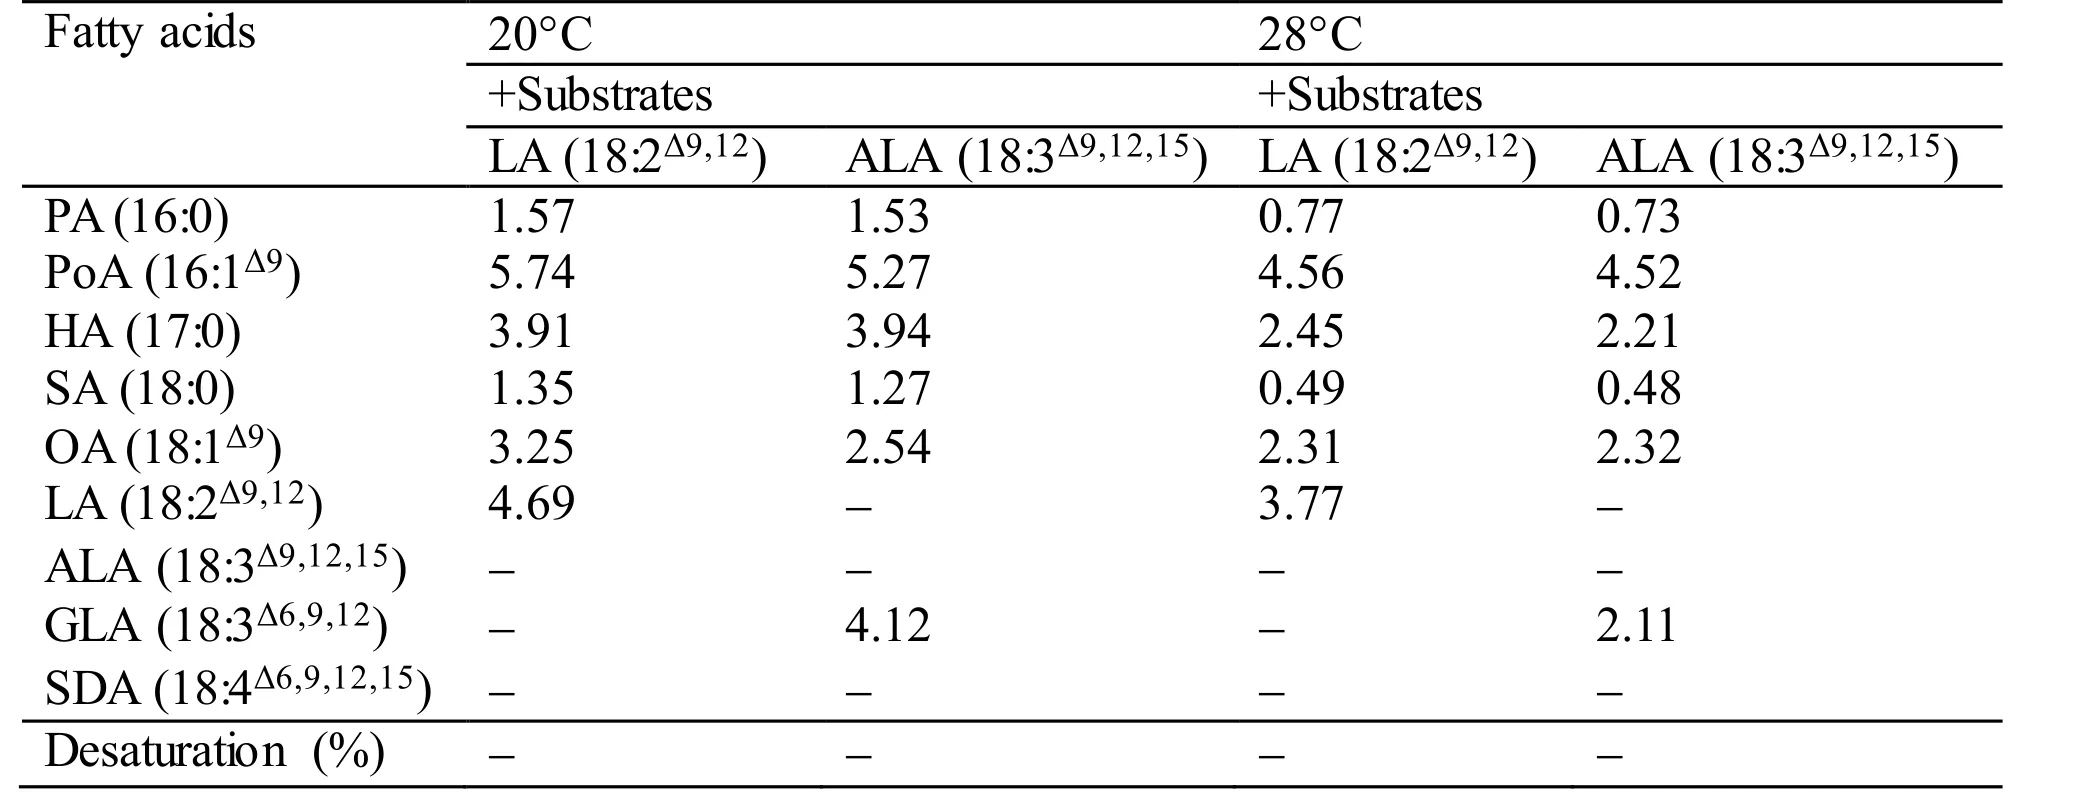
Table S3 Fatty acid desaturation of different substrates supplied to the transgenic yeast Y-MiD6FAD. The values given are expressed as mg fatty acid methyl esters identified by GC-MS detection per gram dry cell weight. In case of desaturated substrates, this is also expressed as % desaturation (product/(product+substrate)×100).All values are the means of two independent experiments.
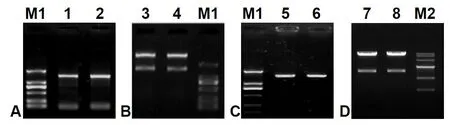
Fig. S1 Electrophoresis patterns of cDNA amplified product of Myrmecia incisa Δ6 FAD gene (A), the endonuclear restrictive digestion of the pMD19-T-MiD6FAD vector (B), the amplified product from Escherichia coli DH5α containing recombinant vector pYES2-MiD6FAD (C), and the pYES2-MiD6FAD vectors from transformed Saccharomyces cerevisiae (D).
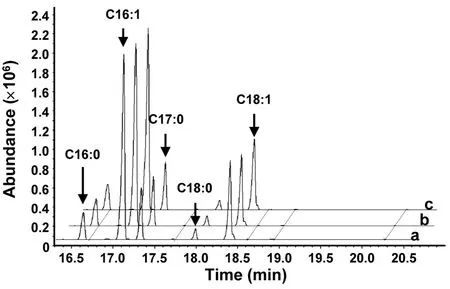
Fig. S2 Gas chromatography-mass spectrometry of fatty acid methyl esters in yeast.
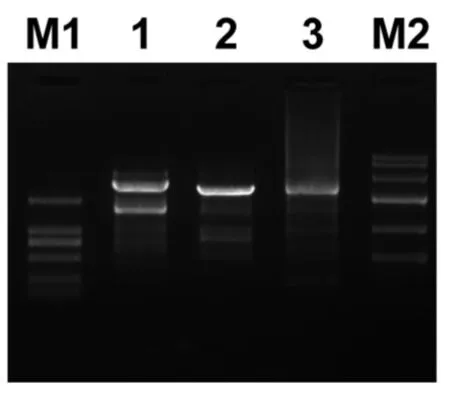
Fig. S3 Electrophoresis pattern of PCR amplified products for cloning of 5′-upstream region of MiD6FAD by a genome walking approach.
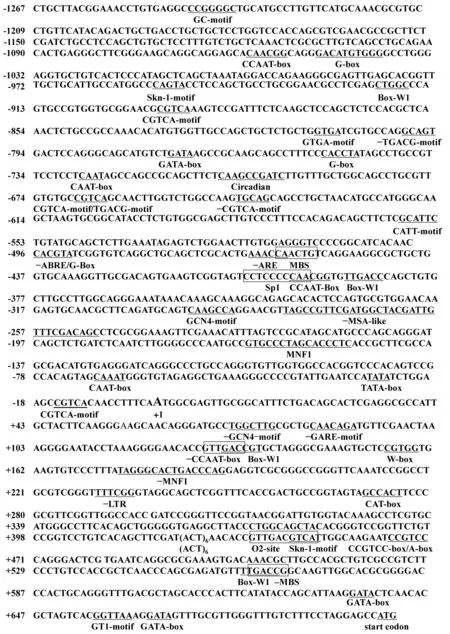
Fig. S4 Nucleotide sequence of the 5′-upstream region of the M. incisa Δ6 FADgene.
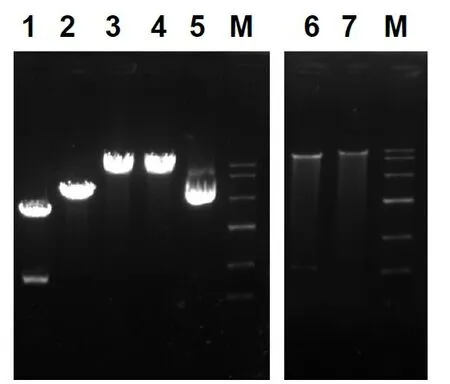
Fig. S5 Restriction digestion patterns for the construction (left) and confirmation(right) of the vector pY-GFP.

Fig. S6 Restriction digestion patterns for the construction (left) and confirmation(right) of the vector pY-448-GFP.
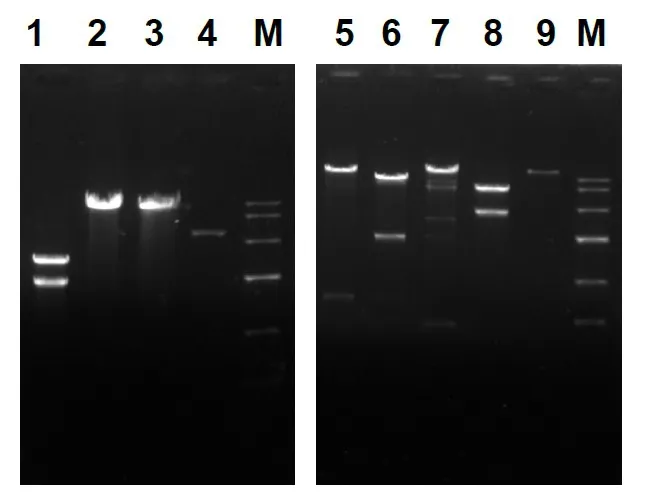
Fig. S7 Restriction digestion patterns for the construction (left) and confirmation(right) of the vector pY-448-1965-GFP.
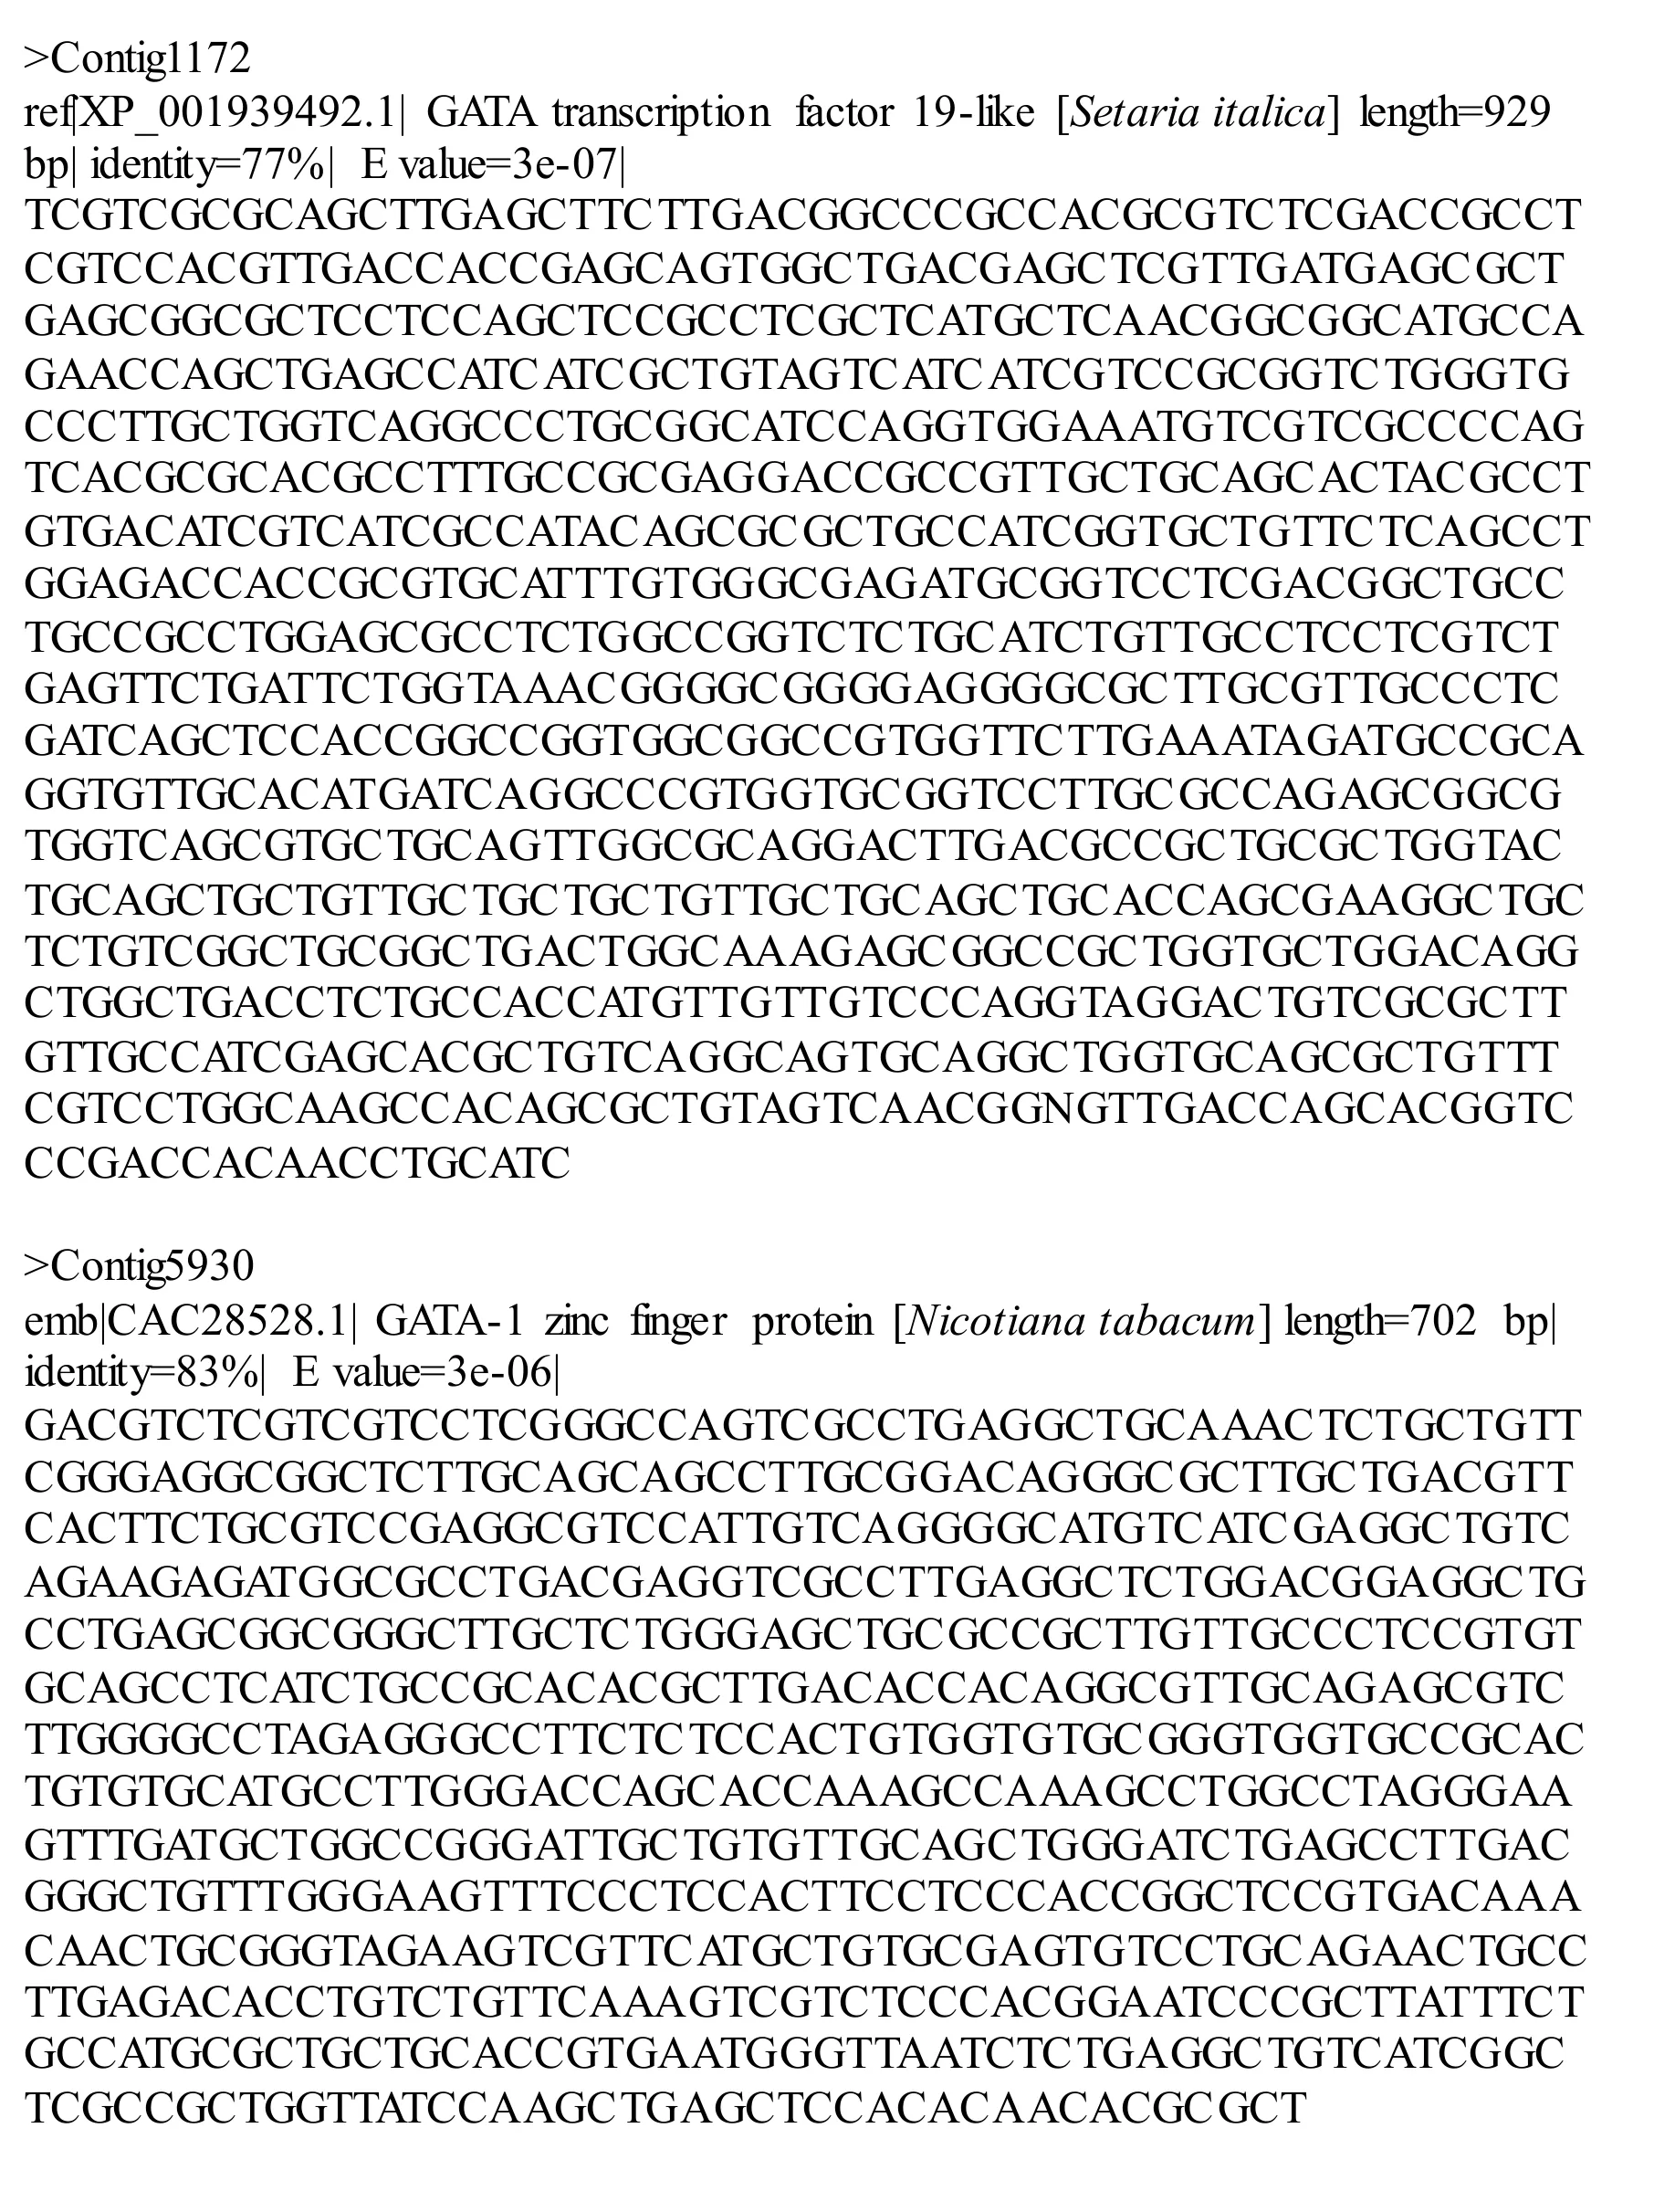
Text S1 Two unigenes searched from the transcriptome database of Myrmecia incisa coding for GATA transcription factor.
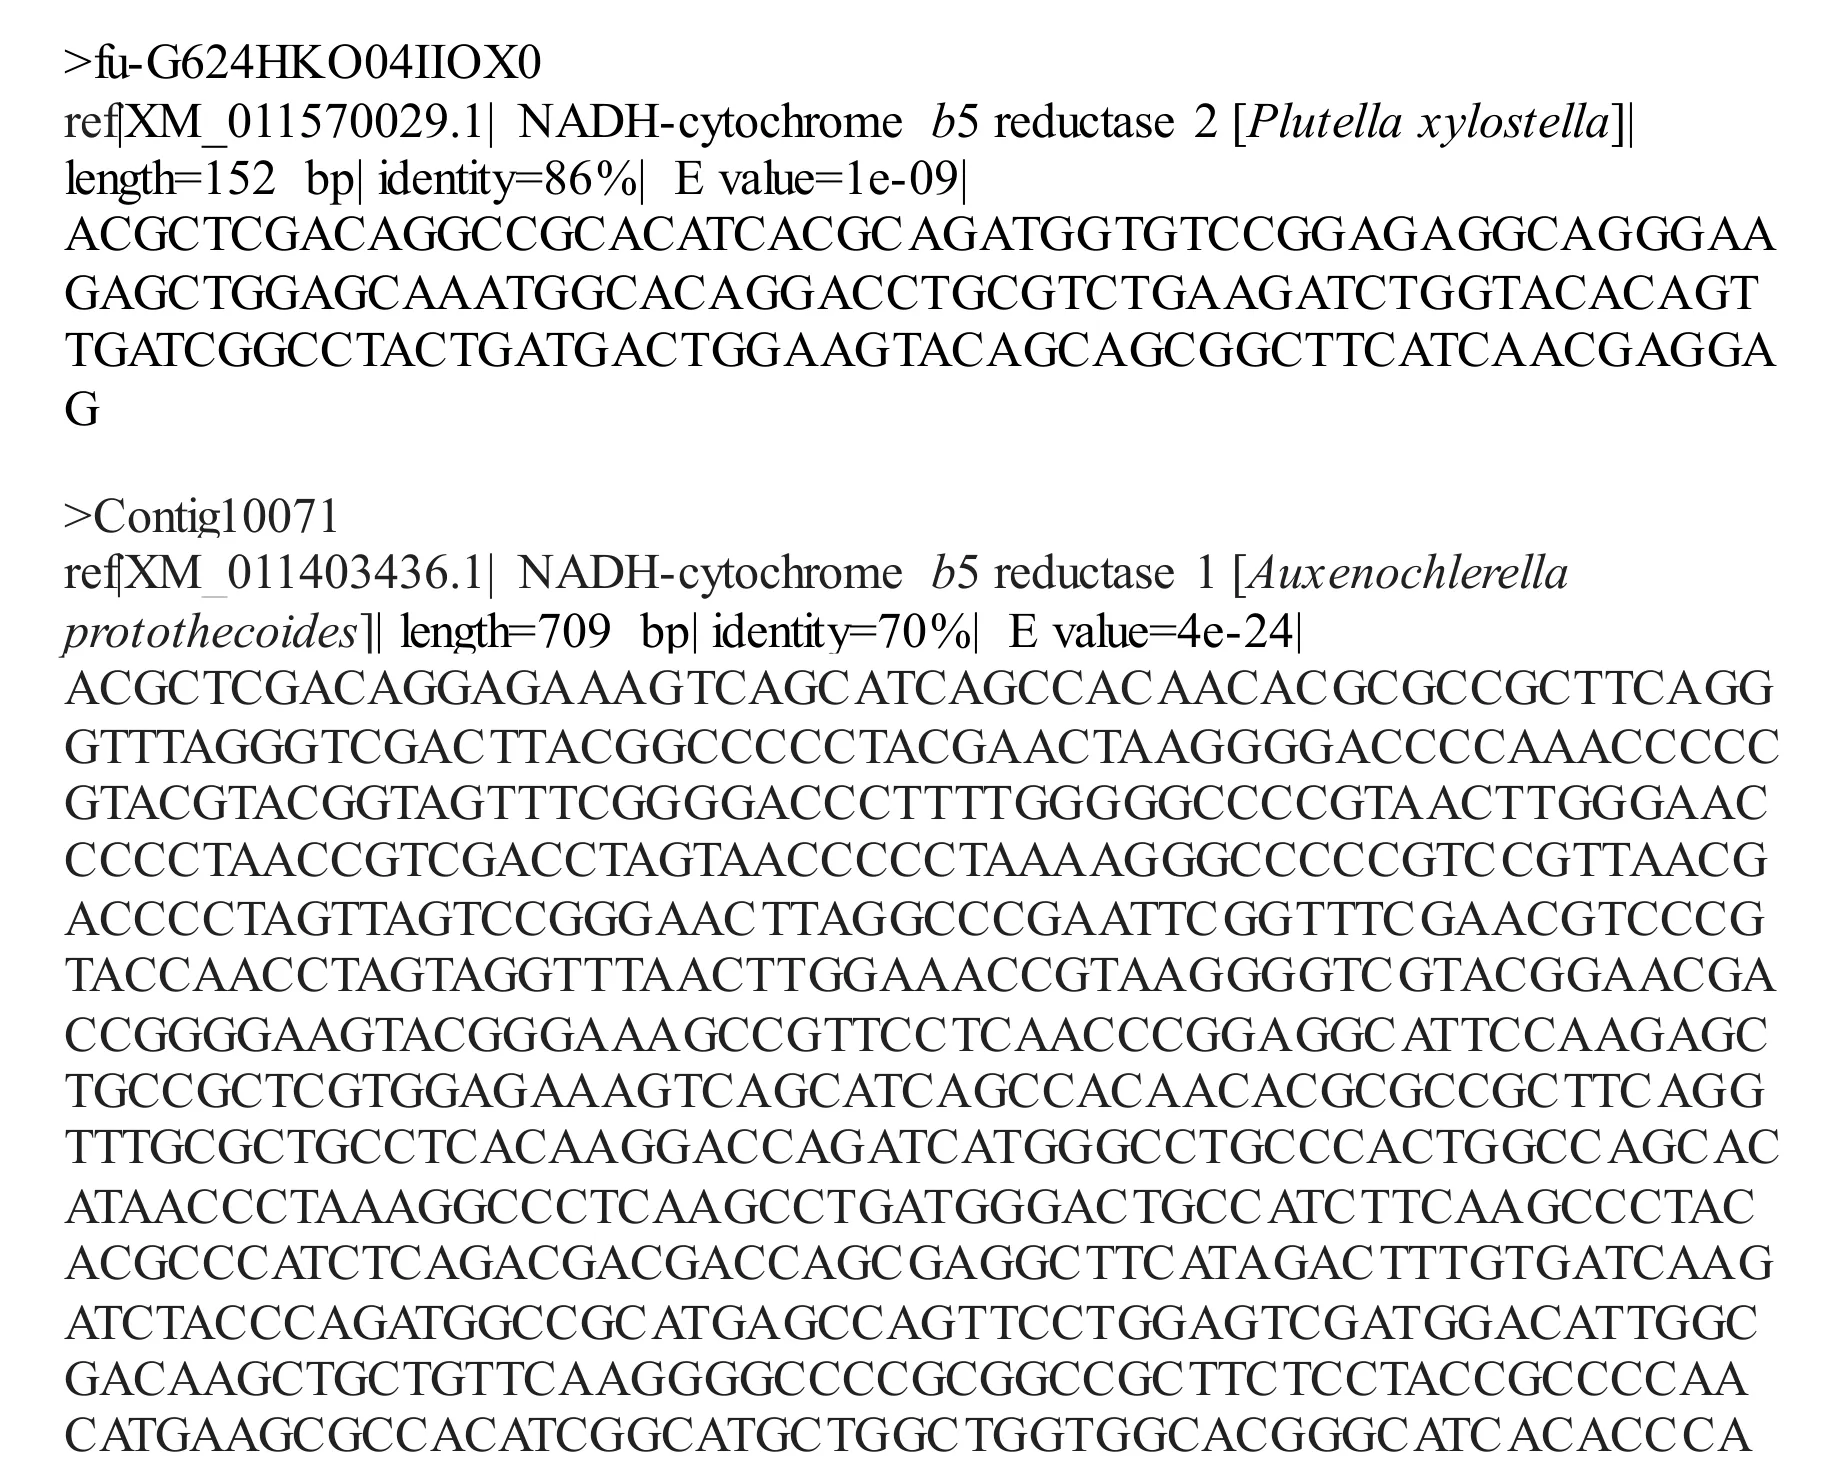
Text S2 Two unigenes searched from the transcriptome database of Myrmecia incisa coding for NADH-cytochrome b5 reductase.
Text S3 One unigene searched from the transcriptome database of Myrmecia incisa coding for cytochrome b5.
猜你喜欢
杂志排行

Journal of Oceanology and Limnology的其它文章
- Neuroanatomy and morphological diversity of brain cells from adult crayfish Cherax quadricarinatus*
- On the influence of season and salinity on the phenology of invertebrates in Australian saline lakes, with special reference to those of the Paroo in the semiarid inland
- Man-made plutonium radioisotopes in the salt lakes of the Crimean peninsula
- Cladophora mats in a Crimean hypersaline lake: structure,dynamics, and inhabiting animals
- Antimony speciation at the sediment-water interface of the Poyang Lake: response to seasonal variation*
- Seasonal variations of phosphorus species in the Tuohe River,China. Part I. Sediments*